3D Imaging Market by Component (Hardware, Solutions, and Services), Deployment Mode, Organization Size, Vertical (Manufacturing, Media and Entertainment, and Architecture and Construction), and Region - Global Forecast to 2025


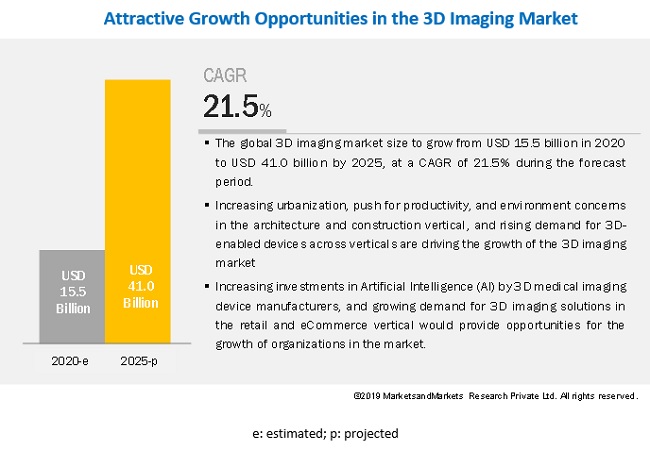
[216 Pages Report] The global 3D imaging market size to grow from USD 15.5 billion in 2020 to USD 41.0 billion by 2025, at a Compound Annual Growth Rate (CAGR) of 21.5% during the forecast period. The major growth factors of the 3D imaging market are the increasing demand for 3D image sensors from verticals, such as manufacturing, automotive, and media and entertainment. The growing demand for 3D accelerometers in smart phones and gaming consoles is also expected to drive the market growth.
Among solutions, the 3D layout and animation segment to grow at the highest CAGR during the forecast period
The 3D imaging market consist of several software used for the creation of 3D animation, which can range from professional high-end ones to the affordable low-end versions. 3D layout and animation represent the spatial relation between the size and location of the object. Animation basically shows the sequential description of the object, how it will move, and change over time. This solution is increasingly being adopted across diverse verticals, such as media and entertainment and construction to offer improved services for end users. 3D imaging companies, such as Autodesk offer the 3ds Max and Maya solutions for media, entertainment, and gaming verticals to enhance their animation and motion pictures quality. Adobe offers 3D animation software that helps photographers to create animated clips and fluid spatial effects that enhance photo quality. The software provides various designing tools for various vendors in the gaming industry to enhance their 3D model.
Cloud deployment mode to grow at a rapid pace during the forecast period
Most vendors in the 3D imaging market offer cloud-based 3D imaging solutions to maximize profits and automate the equipment maintenance process, effectively. The adoption of cloud-based 3D imaging solutions is expected to grow, owing to benefits, such as easy maintenance of image data generated, cost-effectiveness, agility, flexibility, scalability, and effective management of these solutions. Companies prefer to adopt cloud-based 3D imaging solutions, as these support their regional, cross-regional or cross-country data recovery strategies. This enables them to ensure resilience in case of disasters.
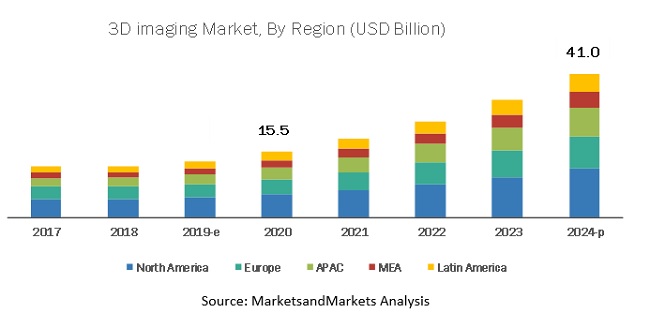
North America to hold the highest market share during the forecast period
North America is expected to hold the highest share in the global 3D imaging market, while Asia Pacific (APAC) is expected to grow at the highest CAGR during the forecast period. The region is witnessing significant developments in the market. North America is projected to hold the largest market size during the forecast period. Key factors favoring the growth of the market in North America include increasing investments for Research and Development (R&D) process and widespread adoption of the 3D technology in the region. The growing number of 3D imaging players across regions is expected to drive the market growth further. Major North American vendors in the market are GE Healthcare (US), Autodesk (US), Trimble (US), FARO (US), Google (US), Adobe (US), HP (US), Lockheed Martin (US), Able Software (US), Esri (US), Bentley Systems (US), Pixologic (US).
Key market players
Major vendors in the global 3D imaging market include GE Healthcare (US), Autodesk (US), STMicroelectronics (Switzerland), Panasonic (Japan), and Sony (Japan), Philips (Netherland), Trimble (US), FARO (US), , Google (US), Adobe (US), HP (US), Dassault Systemes (France), Lockheed Martin (US), Topcon (Japan), Able Software (US), Maxon (Germany), Esri (US), Bentley Systems (US), Pixologic (US), Pix4D (Switzerland). These vendors have adopted various organic and inorganic growth strategies, such as new product launches, partnerships and collaborations, and mergers and acquisitions, to expand their presence in the global market.
STMicroelectronics (Switzerland) offers amplifiers, comparators, automotive microcontrollers, data converters, diodes, rectifiers, Micro-Electro-Mechanical Systems (MEMS), sensors, motor drives, transistors, and thyristors. These products are used in automobiles, personal electronics, communications equipment, and Internet of Things (IoT) devices. The company operates through three business segments: automotive and discrete group; analog, MEMS, and sensors group; and microcontrollers and digital Integrated CircuitsGroup. The automotive and discrete group segment comprises automotive ICs and discrete power transistor products, while the analog, MEMS, and sensors group includes analog ICs and smart power products for industrial, computer, and personal electronics markets. The microcontrollers and digital ICs group consists of microcontrollers, Electrically Erasable Programmable Read-Only Memories, and aerospace and defense products that include components for microwave and millimeter-wave solutions. The company offers position sensors through its analog, MEMS, and sensors group segment. Using the Time-of-Flight (ToF) principle, the company developed and patented its own technology called FlightSense to offer a new generation of high-accuracy proximity sensors.
Get online access to the report on the World's First Market Intelligence Cloud
- Easy to Download Historical Data & Forecast Numbers
- Company Analysis Dashboard for high growth potential opportunities
- Research Analyst Access for customization & queries
- Competitor Analysis with Interactive dashboard
- Latest News, Updates & Trend analysis
Request Sample Scope of the Report
Get online access to the report on the World's First Market Intelligence Cloud
- Easy to Download Historical Data & Forecast Numbers
- Company Analysis Dashboard for high growth potential opportunities
- Research Analyst Access for customization & queries
- Competitor Analysis with Interactive dashboard
- Latest News, Updates & Trend analysis

|
Report Metric |
Details |
|
Market size available for years |
20182025 |
|
Base year considered |
2019 |
|
Forecast period |
20202025 |
|
Forecast units |
Billion (USD) |
|
Segments covered |
Component, Deployment Mode, Organization Size, Vertical, and Region |
|
Geographies covered |
North America, Europe, APAC, Latin America, and MEA |
|
Companies covered |
GE Healthcare (US), Autodesk (US), STMicroelectronics (Switzerland), Panasonic (Japan), and Sony (Japan), Philips (Netherland), Trimble (US), FARO (US), , Google (US), Adobe (US), HP (US), Dassault Systèmes (France), Lockheed Martin (US), Topcon (Japan), Able Software (US), Maxon (Germany), Esri (US), Bentley Systems (US), Pixologic (US), and Pix4D (Switzerland). |
This research report categorizes the market based on components, deployment modes, organization size, verticals, and regions.
By component, the 3D imaging market is divided into the following segments:
- Solutions
- 3D modeling
- 3D scanning
- 3D layout and animation
- 3D visualization and rendering
- Hardware
- 3D display
- 3D sensors
- Services
- Managed Services
- Profession Services
- Consulting
- Deployment and Integration
- Support and Maintenance
By deployment mode, the 3D imaging market is divided into the following segments:
- Cloud
- On-premises
By organization size, the 3D imaging market is divided into the following segments:
- Large Enterprises
- Small and Medium-sized Enterprises (SMEs)
By vertical, the 3D imaging market is divided into the following segments:
- Aerospace and Defense
- Automotive and Transportation
- Manufacturing
- Healthcare and Life Sciences
- Architecture and Construction
- Media and Entertainment
- Retail and Consumer Goods
- Others (Energy and Utilities, Education, Agricultural irrigation, and BFSI)
By region, the 3D imaging market is divided into the following segments:
- North America
- United States (US)
- Canada
- Europe
- United Kingdom (UK)
- Germany
- France
- Rest of Europe
- Asia Pacific (APAC)
- China
- Japan
- India
- Rest of APAC
- Middle East and Africa (MEA)
- Kingdom of Saudi Arabia (KSA)
- United Arab Emirates (UAE)
- South Africa
- Rest of MEA
- Latin America
- Brazil
- Mexico
- Rest of Latin America
Critical questions answered by the report:
- What are the current trends driving the 3D imaging market?
- In which vertical are most industrial companies deploying 3D imaging solutions?
- Where will recent developments of market vendors take the industry in the mid- to long-term?
- Who are the top vendors in the market, and what is their competitive analysis?
- What are the drivers and challenges faced by vendors in the market?
Frequently Asked Questions (FAQ):
What is 3D Imaging?
3D imaging is the process of creating the illusion of depth in an image. Technological advancements and evolution of specialized inspection techniques in industrial applications, have enabled users to obtain accurate and timeless 3D data on objects, by providing 3D images for testing purposes.
What are the top vendors in 3D Imaging market?
Major vendors offering 3D Imaging and services includes GE Healthcare, Autodesk, STMicroelectronics, Panasonic, Sony, Trimble, FARO, Philips, Google, Adobe, HP. These vendors have adopted different types of organic and inorganic growth strategies such as new product launches, partnerships and collaborations, and mergers and acquisitions to expand their offerings in the market.
What is the market size of 3D Imaging market?
The global 3D imaging market size to grow from USD 15.5 billion in 2020 to USD 41.0 billion by 2025, at a Compound Annual Growth Rate (CAGR) of 21.5% during the forecast period. The major growth factors of the 3D imaging market are the increasing demand for 3D image sensors from verticals, such as manufacturing, automotive, and media and entertainment. The growing demand for 3D accelerometers in smart phones and gaming consoles is also expected to drive the market growth
Which industry verticals are adopting 3D Imaging solutions and services?
The top industry verticals adopting 3D Imaging and services include aerospace and defense, automotive and transportation, manufacturing, healthcare and life sciences, and architecture and construction. Rising demand for 3D-enabled devices across verticals, and increasing urbanization, push for productivity, and environment concerns in the architecture and construction vertical to drive the adoption of 3D imaging solutions and services.
What are the regulations impacting the 3D Imaging Market?
The acts or regulations having impact on the growth of 3D imaging market include General Data Protection Regulation, Health Insurance Portability and Accountability Act (HIPAA), Health Information Technology for Economic and Clinical Health Act, California Consumer Privacy Act, Sarbanes-Oxley Act Of 2002, and Payment Card Industry Data Security Standard. .
To speak to our analyst for a discussion on the above findings, click Speak to Analyst
TABLE OF CONTENTS
1 INTRODUCTION (Page No. - 19)
1.1 OBJECTIVES OF THE STUDY
1.2 MARKET DEFINITION
1.2.1 INCLUSIONS AND EXCLUSIONS
1.3 MARKET SCOPE
1.3.1 MARKET SEGMENTATION
1.3.2 REGIONS COVERED
1.4 YEARS CONSIDERED FOR THE STUDY
1.5 CURRENCY CONSIDERED
1.6 STAKEHOLDERS
2 RESEARCH METHODOLOGY (Page No. - 22)
2.1 RESEARCH DATA
2.1.1 SECONDARY DATA
2.1.2 PRIMARY DATA
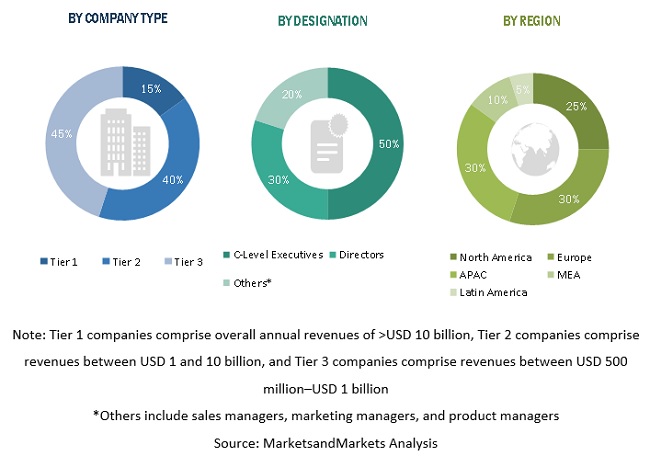
2.1.2.1 Breakup of primary profiles
2.1.3 MARKET BREAKUP AND DATA TRIANGULATION
2.1.3.1 Key industry insights
2.2 MARKET SIZE ESTIMATION
2.2.1 TOP-DOWN APPROACH
2.2.2 BOTTOM-UP APPROACH
2.3 MARKET FORECAST
2.4 ASSUMPTIONS FOR THE STUDY
2.5 LIMITATIONS OF THE STUDY
3 EXECUTIVE SUMMARY (Page No. - 33)
4 PREMIUM INSIGHTS (Page No. - 39)
4.1 ATTRACTIVE MARKET OPPORTUNITIES IN THE MARKET
4.2 TOP 3 VERTICALS
4.3 3D IMAGING MARKET, BY REGION
4.4 NORTH AMERICA 3D IMAGING MARKET, BY COMPONENT AND VERTICAL
5 MARKET OVERVIEW AND INDUSTRY TRENDS (Page No. - 42)
5.1 INTRODUCTION
5.2 MARKET DYNAMICS
5.2.1 DRIVERS
5.2.1.1 Rising demand for 3D-enabled devices across verticals
5.2.1.2 Increasing urbanization, push for productivity, and environment concerns in the architecture and construction vertical
5.2.2 RESTRAINTS
5.2.2.1 High maintenance costs of 3D imaging hardware
5.2.2.2 Interoperability issues with 3D imaging solutions and hardware
5.2.3 OPPORTUNITIES
5.2.3.1 Increasing investments in AI by 3D medical imaging device manufacturers
5.2.3.2 High demand for 3D imaging solutions in the retail and eCommerce vertical
5.2.4 CHALLENGES
5.2.4.1 High power consumption requirements for 3D image processing
5.2.4.2 Impact of Coronavirus outbreak on the global economy
5.3 USE CASES
5.3.1 TATA INTERACTIVE SYSTEMS (TIS) COLLABORATED WITH AUTODESK TO INNOVATE ELEARNING WITH 3D ANIMATION
5.3.2 JP CULLEN ADOPTED TRIMBLE SOLUTIONS TO BUILD HIGHER QUALITY PRODUCT WITH 3D MODELING
5.3.3 KOBELCO CONSTRUCTION MACHINERY COLLABORATED WITH DASSAULT SYSTÈMES TO MANAGE ITS GLOBAL MANUFACTURING OPERATIONS
5.3.4 FEOPS COLLABORATED WITH DASSAULT SYSTÈMES TO IMPROVE OUTCOMES IN HEART VALVE REPLACEMENT
5.3.5 TRUEPOINT PROVIDED 3D LASER SCANNING AND MODELING SERVICES FOR A POWER PLANT IN MICHIGAN
5.3.6 CHINA RAILWAY DESIGN CORPORATION ADOPTED DASSAULT SYSTÈMES 3DEXPERIENCE PLATFORM TO DESIGN THEIR RAILWAY PROJECTS
5.3.7 BIOLITE ADOPTED AUTODESK SOFTWARE TO CREATE ELECTRICITY GENERATING BIOMASS STOVES FOR IMPROVING PUBLIC HEALTH
5.4 REGULATORY COMPLIANCES
5.4.1 GENERAL DATA PROTECTION REGULATION
5.4.2 HEALTH INSURANCE PORTABILITY AND ACCOUNTABILITY ACT OF 1996
5.5 3D IMAGING TECHNIQUES
5.6 3D IMAGING APPLICATIONS
5.6.1 CONSUMER ELECTRONICS
5.6.1.1 Smartphones
5.6.1.2 Wearable electronics
5.6.1.3 Television
5.6.1.4 Tablets
5.6.1.5 Others
5.6.2 HEALTHCARE
5.6.2.1 MRI or scan
5.6.2.2 Surgery
5.6.2.3 Telemedicine
5.6.2.4 Tomosynthesis
5.6.3 AEROSPACE AND DEFENSE
5.6.3.1 Volumetric 3D display
5.6.3.2 3D acoustic sensors
5.6.3.3 3D LIDAR
5.6.4 INDUSTRIAL ROBOTICS
5.6.4.1 Tier management
5.6.4.2 Real-time 3D imaging sensing
5.6.5 MEDIA AND ENTERTAINMENT
5.6.5.1 3D animation
5.6.5.2 3D gaming
5.6.6 AUTOMOTIVE AND TRANSPORTATION
5.6.6.1 Time-of-Flight
5.6.6.2 Lane departure warning system
5.6.6.3 Blind spot viewing
5.6.6.4 Pedestrian detection
5.6.7 SECURITY AND SURVEILLANCE
5.6.7.1 Face detection
5.6.7.2 Skin texture analysis
5.6.7.3 Biometrics
5.7 3D MODELING TECHNIQUES
5.8 3D DISPLAY
5.9 3D SENSORS
5.1 3D IMAGING: EMERGING TRENDS
5.10.1 3D PRINTING
5.10.2 TIME-OF-FLIGHT APPLICATIONS
5.10.3 SHEET-OF-LIGHT APPLICATIONS
5.10.4 3D X-RAY IMAGING
5.10.5 ROBOTICS
5.11 FUTURE OUTLOOK
5.11.1 THE MOVE FROM 3D IMAGING TO 4D IMAGING
5.11.2 ROLE OF ADJACENT TECHNOLOGIES IN 3D IMAGING
5.11.2.1 AI in 3D imaging
5.11.2.2 IoT in 3D imaging
5.11.2.3 Blockchain in 3D imaging
6 3D IMAGING MARKET, BY COMPONENT (Page No. - 69)
6.1 INTRODUCTION
6.2 HARDWARE
6.2.1 3D DISPLAY
6.2.2 3D IMAGE SENSORS
6.2.2.1 CMOS 3D image sensors
6.2.2.2 3D electro-optical image sensors
6.2.2.3 3D TOF image sensors
6.3 SOLUTIONS
6.3.1 3D MODELING
6.3.2 3D SCANNING
6.3.3 3D LAYOUT AND ANIMATION
6.3.4 3D VISUALIZATION AND RENDERING
6.3.5 IMAGE RECONSTRUCTION
6.4 SERVICES
6.4.1 MANAGED SERVICES
6.4.2 PROFESSIONAL SERVICES
6.4.2.1 Consulting
6.4.2.2 Support and maintenance
6.4.2.3 Deployment and integration
7 3D IMAGING MARKET, BY DEPLOYMENT MODE (Page No. - 86)
7.1 INTRODUCTION
7.2 ON-PREMISES
7.3 CLOUD
8 3D IMAGING MARKET, BY ORGANIZATION SIZE (Page No. - 90)
8.1 INTRODUCTION
8.2 LARGE ENTERPRISES
8.3 SMALL AND MEDIUM-SIZED ENTERPRISES
9 3D IMAGING MARKET, BY VERTICAL (Page No. - 94)
9.1 INTRODUCTION
9.2 AEROSPACE AND DEFENSE
9.3 AUTOMOTIVE AND TRANSPORTATION
9.4 MANUFACTURING
9.5 HEALTHCARE AND LIFE SCIENCES
9.6 ARCHITECTURE AND CONSTRUCTION
9.7 MEDIA AND ENTERTAINMENT
9.8 RETAIL AND ECOMMERCE
9.9 OTHER VERTICALS
10 3D IMAGING MARKET, BY REGION (Page No. - 105)
10.1 INTRODUCTION
10.2 NORTH AMERICA
10.2.1 UNITED STATES
10.2.2 CANADA
10.3 EUROPE
10.3.1 UNITED KINGDOM
10.3.2 GERMANY
10.3.3 FRANCE
10.3.4 REST OF EUROPE
10.4 ASIA PACIFIC
10.4.1 CHINA
10.4.2 JAPAN
10.4.3 INDIA
10.4.4 REST OF ASIA PACIFIC
10.5 MIDDLE EAST AND AFRICA
10.5.1 KINGDOM OF SAUDI ARABIA
10.5.2 UNITED ARAB EMIRATES
10.5.3 SOUTH AFRICA
10.5.4 REST OF MIDDLE EAST AND AFRICA
10.6 LATIN AMERICA
10.6.1 BRAZIL
10.6.2 MEXICO
10.6.3 REST OF LATIN AMERICA
11 COMPETITIVE LANDSCAPE (Page No. - 148)
11.1 MICROQUADRANT OVERVIEW
11.2 COMPETITIVE LEADERSHIP MAPPING
11.2.1 VISIONARY LEADERS
11.2.2 INNOVATORS
11.2.3 DYNAMIC DIFFERENTIATORS
11.2.4 EMERGING COMPANIES
12 COMPANY PROFILES (Page No. - 150)
12.1 INTRODUCTION
(Business overview, Solutions and Services offered, Recent developments, SWOT analysis & Right-to-win)*
12.2 GE HEALTHCARE
12.3 AUTODESK
12.4 STMICROELECTRONICS
12.5 PANASONIC
12.6 SONY
12.7 TRIMBLE
12.8 FARO
12.9 PHILIPS
12.10 GOOGLE
12.11 ADOBE
12.12 HP
12.13 DASSAULT SYSTÈMES
12.14 LOCKHEED MARTIN
12.15 TOPCON
12.16 ABLE SOFTWARE
12.17 MAXON
12.18 ESRI
12.19 BENTLEY SYSTEMS
12.20 PIXOLOGIC
12.21 PIX4D
*Details on Business overview, Solutions and Services offered, Recent developments, SWOT analysis & Right-to-win might not be captured in case of unlisted companies.
13 APPENDIX (Page No. - 204)
13.1 INDUSTRY EXPERTS
13.2 DISCUSSION GUIDE
13.3 KNOWLEDGE STORE: MARKETSANDMARKETS SUBSCRIPTION PORTAL
13.4 AVAILABLE CUSTOMIZATIONS
13.5 RELATED REPORTS
13.6 AUTHOR DETAILS
LIST OF TABLES (107 Tables)
TABLE 1 UNITED STATES DOLLAR EXCHANGE RATE, 20172019
TABLE 2 FACTOR ANALYSIS
TABLE 3 GLOBAL 3D IMAGING MARKET SIZE AND GROWTH RATE, 20182025 (USD MILLION, Y-O-Y %)
TABLE 4 3D IMAGING MARKET SIZE, BY COMPONENT, 20182025 (USD MILLION)
TABLE 5 HARDWARE: MARKET SIZE, BY TYPE, 20182025 (USD MILLION)
TABLE 6 HARDWARE: MARKET SIZE, BY REGION, 20182025 (USD MILLION)
TABLE 7 3D DISPLAY MARKET SIZE, BY REGION, 20182025 (USD MILLION)
TABLE 8 3D IMAGING MARKET SIZE, BY 3D IMAGE SENSOR TYPE, 20182025 (USD MILLION)
TABLE 9 3D IMAGE SENSORS MARKET SIZE, BY REGION, 20182025 (USD MILLION)
TABLE 10 SOLUTIONS: MARKET SIZE, BY TYPE, 20182025 (USD MILLION)
TABLE 11 SOLUTIONS: MARKET SIZE, BY REGION, 20182025 (USD MILLION)
TABLE 12 3D MODELING MARKET SIZE, BY REGION, 20182025 (USD MILLION)
TABLE 13 3D SCANNING MARKET SIZE, BY REGION, 20182025 (USD MILLION)
TABLE 14 3D LAYOUT AND ANIMATION MARKET SIZE, BY REGION, 20182025 (USD MILLION)
TABLE 15 3D VISUALIZATION AND RENDERING MARKET SIZE, BY REGION, 20182025 (USD MILLION)
TABLE 16 IMAGE RECONSTRUCTION MARKET SIZE, BY REGION, 20182025 (USD MILLION)
TABLE 17 3D IMAGING MARKET SIZE, BY SERVICE, 20182025 (USD MILLION)
TABLE 18 SERVICES: 3D IMAGING MARKET SIZE, BY REGION, 20182025 (USD MILLION)
TABLE 19 MANAGED SERVICES MARKET SIZE, BY REGION, 20182025 (USD MILLION)
TABLE 20 PROFESSIONAL SERVICES: 3D IMAGING MARKET SIZE, BY TYPE, 20182025 (USD MILLION)
TABLE 21 PROFESSIONAL SERVICES MARKET SIZE, BY REGION, 20182025 (USD MILLION)
TABLE 22 3D IMAGING MARKET SIZE, BY DEPLOYMENT MODE, 20182025 (USD MILLION)
TABLE 23 ON-PREMISES: MARKET SIZE, BY REGION, 20182025 (USD MILLION)
TABLE 24 CLOUD: MARKET SIZE, BY REGION, 20182025 (USD MILLION)
TABLE 25 3D IMAGING MARKET SIZE, BY ORGANIZATION SIZE, 20182025 (USD MILLION)
TABLE 26 LARGE ENTERPRISES: MARKET SIZE, BY REGION, 20182025 (USD MILLION)
TABLE 27 SMALL AND MEDIUM-SIZED ENTERPRISES: MARKET SIZE, BY REGION, 20182025 (USD MILLION)
TABLE 28 3D IMAGING MARKET SIZE, BY VERTICAL, 20182025 (USD MILLION)
TABLE 29 AEROSPACE AND DEFENSE: MARKET SIZE, BY REGION, 20182025 (USD MILLION)
TABLE 30 AUTOMOTIVE AND TRANSPORTATION: MARKET SIZE, BY REGION, 20182025 (USD MILLION)
TABLE 31 MANUFACTURING: MARKET SIZE, BY REGION, 20182025 (USD MILLION)
TABLE 32 HEALTHCARE AND LIFE SCIENCES: MARKET SIZE, BY REGION, 20182025 (USD MILLION)
TABLE 33 ARCHITECTURE AND CONSTRUCTION: MARKET SIZE, BY REGION, 20182025 (USD MILLION)
TABLE 34 MEDIA AND ENTERTAINMENT: MARKET SIZE, BY REGION, 20182025 (USD MILLION)
TABLE 35 RETAIL AND ECOMMERCE: MARKET SIZE, BY REGION, 20182025 (USD MILLION)
TABLE 36 OTHER VERTICALS: MARKET SIZE, BY REGION, 20182025 (USD MILLION)
TABLE 37 3D IMAGING MARKET SIZE, BY REGION, 20182025 (USD MILLION)
TABLE 38 NORTH AMERICA: 3D IMAGING MARKET SIZE, BY COMPONENT, 20182025 (USD MILLION)
TABLE 39 NORTH AMERICA: MARKET SIZE, BY SOLUTION, 20182025 (USD MILLION)
TABLE 40 NORTH AMERICA: MARKET SIZE, BY HARDWARE, 20182025 (USD MILLION)
TABLE 41 NORTH AMERICA: MARKET SIZE, BY 3D IMAGE SENSOR TYPE, 20182025 (USD MILLION)
TABLE 42 NORTH AMERICA: MARKET SIZE, BY SERVICE, 20182025 (USD MILLION)
TABLE 43 NORTH AMERICA: MARKET SIZE, BY PROFESSIONAL SERVICE, 20182025 (USD MILLION)
TABLE 44 NORTH AMERICA: MARKET SIZE, BY DEPLOYMENT MODE, 20182025 (USD MILLION)
TABLE 45 NORTH AMERICA: MARKET SIZE, BY ORGANIZATION SIZE, 20182025 (USD MILLION)
TABLE 46 NORTH AMERICA: MARKET SIZE, BY VERTICAL, 20182025 (USD MILLION)
TABLE 47 NORTH AMERICA: MARKET SIZE, BY COUNTRY, 20182025 (USD MILLION)
TABLE 48 UNITED STATES: 3D IMAGING MARKET SIZE, BY COMPONENT, 20182025 (USD MILLION)
TABLE 49 UNITED STATES: MARKET SIZE, BY ORGANIZATION SIZE, 20182025 (USD MILLION)
TABLE 50 CANADA: 3D IMAGING MARKET SIZE, BY COMPONENT, 20182025 (USD MILLION)
TABLE 51 CANADA: MARKET SIZE, BY ORGANIZATION SIZE, 20182025 (USD MILLION)
TABLE 52 EUROPE: 3D IMAGING MARKET SIZE, BY COMPONENT, 20182025 (USD MILLION)
TABLE 53 EUROPE: MARKET SIZE, BY SOLUTION, 20182025 (USD MILLION)
TABLE 54 EUROPE: MARKET SIZE, BY HARDWARE, 20182025 (USD MILLION)
TABLE 55 EUROPE: MARKET SIZE, BY 3D IMAGE SENSOR TYPE, 20182025 (USD MILLION)
TABLE 56 EUROPE: MARKET SIZE, BY SERVICE, 20182025 (USD MILLION)
TABLE 57 EUROPE: MARKET SIZE, BY PROFESSIONAL SERVICE, 20182025 (USD MILLION)
TABLE 58 EUROPE: MARKET SIZE, BY DEPLOYMENT MODE, 20182025 (USD MILLION)
TABLE 59 EUROPE: MARKET SIZE, BY ORGANIZATION SIZE, 20182025 (USD MILLION)
TABLE 60 EUROPE: MARKET SIZE, BY VERTICAL, 20182025 (USD MILLION)
TABLE 61 EUROPE: MARKET SIZE, BY COUNTRY, 20182025 (USD MILLION)
TABLE 62 UNITED KINGDOM: MARKET SIZE, BY COMPONENT, 20182025 (USD MILLION)
TABLE 63 GERMANY: MARKET SIZE, BY COMPONENT, 20182025 (USD MILLION)
TABLE 64 FRANCE: MARKET SIZE, BY COMPONENT, 20182025 (USD MILLION)
TABLE 65 REST OF EUROPE: MARKET SIZE, BY COMPONENT, 20182025 (USD MILLION)
TABLE 66 ASIA PACIFIC: 3D IMAGING MARKET SIZE, BY COMPONENT, 20182025 (USD MILLION)
TABLE 67 ASIA PACIFIC: MARKET SIZE, BY SOLUTION, 20182025 (USD MILLION)
TABLE 68 ASIA PACIFIC: MARKET SIZE, BY HARDWARE, 20182025 (USD MILLION)
TABLE 69 ASIA PACIFIC: MARKET SIZE, BY 3D IMAGE SENSOR TYPE, 20182025 (USD MILLION)
TABLE 70 ASIA PACIFIC: MARKET SIZE, BY SERVICE, 20182025 (USD MILLION)
TABLE 71 ASIA PACIFIC: MARKET SIZE, BY PROFESSIONAL SERVICE, 20182025 (USD MILLION)
TABLE 72 ASIA PACIFIC: MARKET SIZE, BY DEPLOYMENT MODE, 20182025 (USD MILLION)
TABLE 73 ASIA PACIFIC: MARKET SIZE, BY ORGANIZATION SIZE, 20182025 (USD MILLION)
TABLE 74 ASIA PACIFIC: MARKET SIZE, BY VERTICAL, 20182025 (USD MILLION)
TABLE 75 ASIA PACIFIC: MARKET SIZE, BY COUNTRY, 20182025 (USD MILLION)
TABLE 76 CHINA: MARKET SIZE, BY COMPONENT, 20182025 (USD MILLION)
TABLE 77 JAPAN: MARKET SIZE, BY COMPONENT, 20182025 (USD MILLION)
TABLE 78 INDIA: MARKET SIZE, BY COMPONENT, 20182025 (USD MILLION)
TABLE 79 REST OF ASIA PACIFIC: MARKET SIZE, BY COMPONENT, 20182025 (USD MILLION)
TABLE 80 MIDDLE EAST AND AFRICA: 3D IMAGING MARKET SIZE, BY COMPONENT, 20182025 (USD MILLION)
TABLE 81 MIDDLE EAST AND AFRICA: MARKET SIZE, BY SOLUTION, 20182025 (USD MILLION)
TABLE 82 MIDDLE EAST AND AFRICA: MARKET SIZE, BY HARDWARE, 20182025 (USD MILLION)
TABLE 83 MIDDLE EAST AND AFRICA: MARKET SIZE, BY 3D IMAGE SENSOR TYPE, 20182025 (USD MILLION)
TABLE 84 MIDDLE EAST AND AFRICA: MARKET SIZE, BY SERVICE, 20182025 (USD MILLION)
TABLE 85 MIDDLE EAST AND AFRICA: MARKET SIZE, BY PROFESSIONAL SERVICE, 20182025 (USD MILLION)
TABLE 86 MIDDLE EAST AND AFRICA: MARKET SIZE, BY DEPLOYMENT MODE, 20182025 (USD MILLION)
TABLE 87 MIDDLE EAST AND AFRICA: MARKET SIZE, BY ORGANIZATION SIZE, 20182025 (USD MILLION)
TABLE 88 MIDDLE EAST AND AFRICA: MARKET SIZE, BY VERTICAL, 20182025 (USD MILLION)
TABLE 89 MIDDLE EAST AND AFRICA: MARKET SIZE, BY COUNTRY, 20182025 (USD MILLION)
TABLE 90 KINGDOM OF SAUDI ARABIA: MARKET SIZE, BY COMPONENT, 20182025 (USD MILLION)
TABLE 91 UNITED ARAB EMIRATES: MARKET SIZE, BY COMPONENT, 20182025 (USD MILLION)
TABLE 92 SOUTH AFRICA: MARKET SIZE, BY COMPONENT, 20182025 (USD MILLION)
TABLE 93 REST OF MIDDLE EAST AND AFRICA: MARKET SIZE, BY COMPONENT, 20182025 (USD MILLION)
TABLE 94 LATIN AMERICA: 3D IMAGING MARKET SIZE, BY COMPONENT, 20182025 (USD MILLION)
TABLE 95 LATIN AMERICA: MARKET SIZE, BY SOLUTION, 20182025 (USD MILLION)
TABLE 96 LATIN AMERICA: MARKET SIZE, BY HARDWARE, 20182025 (USD MILLION)
TABLE 97 LATIN AMERICA: MARKET SIZE, BY 3D IMAGE SENSOR TYPE, 20182025 (USD MILLION)
TABLE 98 LATIN AMERICA: MARKET SIZE, BY SERVICE, 20182025 (USD MILLION)
TABLE 99 LATIN AMERICA: MARKET SIZE, BY PROFESSIONAL SERVICE, 20182025 (USD MILLION)
TABLE 100 LATIN AMERICA: MARKET SIZE, BY DEPLOYMENT MODE, 20182025 (USD MILLION)
TABLE 101 LATIN AMERICA: MARKET SIZE, BY ORGANIZATION SIZE, 20182025 (USD MILLION)
TABLE 102 LATIN AMERICA: MARKET SIZE, BY VERTICAL, 20182025 (USD MILLION)
TABLE 103 LATIN AMERICA: MARKET SIZE, BY COUNTRY, 20182025 (USD MILLION)
TABLE 104 BRAZIL: MARKET SIZE, BY COMPONENT, 20182025 (USD MILLION)
TABLE 105 MEXICO: MARKET SIZE, BY COMPONENT, 20182025 (USD MILLION)
TABLE 106 REST OF LATIN AMERICA: 3D IMAGING MARKET SIZE, BY COMPONENT, 20182025 (USD MILLION)
TABLE 107 EVALUATION CRITERIA
LIST OF FIGURES (72 Figures)
FIGURE 1 3D IMAGING MARKET: RESEARCH DESIGN
FIGURE 2 DATA TRIANGULATION
FIGURE 3 3D IMAGING MARKET: TOP-DOWN AND BOTTOM-UP APPROACHES
FIGURE 4 MARKET SIZE ESTIMATION METHODOLOGY APPROACH 1 (SUPPLY SIDE): REVENUE OF HARDWARE/SOLUTIONS/SERVICES OF THE 3D IMAGING MARKET
FIGURE 5 MARKET SIZE ESTIMATION METHODOLOGY APPROACH 2 BOTTOM-UP (SUPPLY SIDE): COLLECTIVE REVENUE OF ALL HARDWARE/SOLUTIONS/SERVICES OF THE 3D IMAGING MARKET
FIGURE 6 MARKET SIZE ESTIMATION METHODOLOGY APPROACH 3 TOP-DOWN (DEMAND SIDE): SHARE OF 3D IMAGING SOLUTIONS THROUGH THE OVERALL 3D IMAGING SPENDING
FIGURE 7 MARKET SIZE ESTIMATION METHODOLOGY: APPROACH 4 BOTTOM-UP (DEMAND SIDE)
FIGURE 8 3D IMAGING MARKET SNAPSHOT, BY COMPONENT
FIGURE 9 MARKET SNAPSHOT, BY HARDWARE
FIGURE 10 MARKET SNAPSHOT, BY 3D IMAGE SENSOR TYPE
FIGURE 11 MARKET SNAPSHOT, BY SOLUTION
FIGURE 12 MARKET SNAPSHOT, BY SERVICE
FIGURE 13 MARKET SNAPSHOT, BY PROFESSIONAL SERVICE
FIGURE 14 MARKET SNAPSHOT, BY DEPLOYMENT MODE
FIGURE 15 MARKET SNAPSHOT, BY ORGANIZATION SIZE
FIGURE 16 MARKET SNAPSHOT, BY VERTICAL
FIGURE 17 MARKET SNAPSHOT, BY REGION
FIGURE 18 RISING DEMAND FOR 3D-ENABLED DEVICES ACROSS VERTICALS AND INCREASING URBANIZATION TO DRIVE THE 3D IMAGING MARKET GROWTH
FIGURE 19 MANUFACTURING VERTICAL TO GROW AT THE HIGHEST CAGR DURING THE FORECAST PERIOD
FIGURE 20 NORTH AMERICA TO HOLD THE HIGHEST MARKET SHARE IN 2020
FIGURE 21 HARDWARE COMPONENT AND HEALTHCARE AND LIFE SCIENCES VERTICAL TO ACCOUNT FOR THE HIGHEST SHARES IN THE NORTH AMERICA 3D IMAGING MARKET IN 2020
FIGURE 22 DRIVERS, RESTRAINTS, OPPORTUNITIES, AND CHALLENGES: 3D IMAGING MARKET
FIGURE 23 3D IMAGING TECHNIQUES
FIGURE 24 3D IMAGING APPLICATIONS IN CONSUMER ELECTRONICS
FIGURE 25 3D IMAGING APPLICATIONS IN HEALTHCARE
FIGURE 26 3D IMAGING APPLICATIONS IN AEROSPACE AND DEFENSE
FIGURE 27 3D IMAGING APPLICATIONS IN INDUSTRIAL ROBOTICS
FIGURE 28 3D IMAGING APPLICATIONS IN MEDIA AND ENTERTAINMENT
FIGURE 29 3D IMAGING APPLICATIONS IN AUTOMOTIVE AND TRANSPORTATION
FIGURE 30 3D IMAGING APPLICATIONS IN SECURITY AND SURVEILLANCE
FIGURE 31 TYPES OF 3D MODELING
FIGURE 32 TYPES OF 3D DISPLAY TECHNOLOGY
FIGURE 33 TYPES OF 3D SENSOR TECHNOLOGY
FIGURE 34 SERVICES SEGMENT TO GROW AT THE HIGHEST CAGR DURING THE FORECAST PERIOD
FIGURE 35 3D IMAGE SENSORS SEGMENT TO GROW AT A HIGHER CAGR DURING THE FORECAST PERIOD
FIGURE 36 3D TIME-OF-FLIGHT IMAGE SENSORS SEGMENT TO REGISTER THE HIGHEST CAGR DURING THE FORECAST PERIOD
FIGURE 37 3D LAYOUT AND ANIMATION SEGMENT TO GROW AT THE HIGHEST CAGR DURING THE FORECAST PERIOD
FIGURE 38 MANAGED SERVICES SEGMENT TO GROW AT A HIGHER CAGR DURING THE FORECAST PERIOD
FIGURE 39 SUPPORT AND MAINTENANCE SERVICES SEGMENT TO GROW AT THE HIGHEST CAGR DURING THE FORECAST PERIOD
FIGURE 40 CLOUD SEGMENT TO REGISTER A HIGHER CAGR DURING THE FORECAST PERIOD
FIGURE 41 SMALL AND MEDIUM-SIZED ENTERPRISES SEGMENT TO REGISTER A HIGHER CAGR DURING THE FORECAST PERIOD
FIGURE 42 MANUFACTURING VERTICAL TO GROW AT THE HIGHEST CAGR DURING THE FORECAST PERIOD
FIGURE 43 ASIA PACIFIC TO GROW AT THE HIGHEST CAGR DURING THE FORECAST PERIOD
FIGURE 44 CHINA TO ACCOUNT FOR THE HIGHEST CAGR DURING THE FORECAST PERIOD
FIGURE 45 NORTH AMERICA TO HOLD THE LARGEST MARKET SIZE DURING THE FORECAST PERIOD
FIGURE 46 NORTH AMERICA: MARKET SNAPSHOT
FIGURE 47 3D LAYOUT AND ANIMATION SEGMENT TO GROW AT THE HIGHEST CAGR DURING THE FORECAST PERIOD IN NORTH AMERICA
FIGURE 48 3D LAYOUT AND ANIMATION SEGMENT TO GROW AT THE HIGHEST CAGR DURING THE FORECAST PERIOD IN EUROPE
FIGURE 49 ASIA PACIFIC: MARKET SNAPSHOT
FIGURE 50 3D LAYOUT AND ANIMATION SEGMENT TO GROW AT THE HIGHEST CAGR DURING THE FORECAST PERIOD IN ASIA PACIFIC
FIGURE 51 3D LAYOUT AND ANIMATION SEGMENT TO GROW AT THE HIGHEST CAGR DURING THE FORECAST PERIOD IN MIDDLE EAST AND AFRICA
FIGURE 52 3D LAYOUT AND ANIMATION SEGMENT TO GROW AT THE HIGHEST CAGR DURING THE FORECAST PERIOD IN LATIN AMERICA
FIGURE 53 3D IMAGING MARKET (GLOBAL), COMPETITIVE LEADERSHIP MAPPING, 2020
FIGURE 54 GE HEALTHCARE: COMPANY SNAPSHOT
FIGURE 55 GE HEALTHCARE: SWOT ANALYSIS
FIGURE 56 AUTODESK: COMPANY SNAPSHOT
FIGURE 57 AUTODESK: SWOT ANALYSIS
FIGURE 58 STMICROELECTRONICS: COMPANY SNAPSHOT
FIGURE 59 STMICROELECTRONICS: SWOT ANALYSIS
FIGURE 60 PANASONIC: COMPANY SNAPSHOT
FIGURE 61 PANASONIC: SWOT ANALYSIS
FIGURE 62 SONY: COMPANY SNAPSHOT
FIGURE 63 SONY: SWOT ANALYSIS
FIGURE 64 TRIMBLE: COMPANY SNAPSHOT
FIGURE 65 TRIMBLE: SWOT ANALYSIS
FIGURE 66 FARO: COMPANY SNAPSHOT
FIGURE 67 FARO: SWOT ANALYSIS
FIGURE 68 PHILIPS: COMPANY SNAPSHOT
FIGURE 69 GOOGLE: COMPANY SNAPSHOT
FIGURE 70 ADOBE: COMPANY SNAPSHOT
FIGURE 71 HP: COMPANY SNAPSHOT
FIGURE 72 DASSAULT SYSTÈMES: COMPANY SNAPSHOT
The study involved four major activities in estimating the current market size of the 3D imaging market. An extensive secondary research was done to collect information on the market, peer market, and the parent market. The next step was to validate these findings, assumptions, and sizing with industry experts across the value chain through primary research. Both top-down and bottom-up approaches were used to estimate the total market size. After that, the market breakup and data triangulation procedures were used to estimate the market size of the segments and subsegments of the market.
Secondary Research
In the secondary research process, various secondary sources, such as Journal American College of Radiology, Journal of Imaging Science and Technology, and The International Journal on Imaging Processing have been referred to, for identifying and collecting information for this study. Secondary sources included annual reports; press releases and investor presentations of companies; whitepapers, certified publications, and articles by recognized authors; Research and Development (R&D) organizations; regulatory bodies; and databases. Journals, repositories, and resources from the International Journal of Computer Vision, were referred to understand the integration of 3D imaging.
Primary Research
Various primary sources from both supply and demand sides were interviewed to obtain qualitative and quantitative information of the market. The primary sources from the supply side included various industry experts, such as Chief Experience Officers (CXOs), Vice Presidents (VPs), directors, from business development, marketing, product development/innovation teams, and related key executives from 3D imaging vendors, system integrators, professional service providers, industry associations, and geographic information system consultants and key opinion leaders. All possible parameters that affect the market covered in this research study have been accounted for, viewed in extensive detail, verified through primary research, and analyzed to get the final quantitative and qualitative data.
The following is the breakup of primary profiles:
To know about the assumptions considered for the study, download the pdf brochure
Market Size Estimation
Both top-down and bottom-up approaches were used to estimate and validate the total size of the 3D imaging market. The top-down approach was used to derive the revenue contribution of top vendors and their offerings in the market. The bottom-up approach was used to arrive at the overall market size of the global market using key companies revenue and their offerings in the market. The research methodology used to estimate the market size includes the following:
- The key players in the market were identified through extensive secondary research.
- The market size, in terms of value, was determined through primary and secondary research processes.
- All percentage, shares split, and breakups were determined using secondary sources and verified through primary sources.
Data Triangulation
After arriving at the overall market size using the market size estimation processes as explained above, the market was split into several segments and subsegments. To complete the overall market engineering process and arrive at the exact statistics of each market segment and subsegment, data triangulation and market breakup procedures were employed, wherever applicable. The overall market size was then used in the top-down procedure to estimate the size of other individual markets via percentage splits of the market segmentation.
Report Objectives
- To analyze the market by component, deployment mode, organization size, vertical, and region for the 3D imaging market
- To define, segment, and project the global market size for market
- To understand the structure of the market by identifying its various subsegments
- To provide detailed information about the key factors influencing the growth of the market (drivers, restraints, opportunities, and industry-specific challenges)
- To analyze the micromarkets concerning individual growth trends, prospects, and their contribution to the overall market
- To project the size of the market and its submarkets, in terms of value, for the five regions including North America, Europe, Asia Pacific (APAC), Middle East and Africa (MEA), and Latin America (along with their respective key countries)
- To profile key players and comprehensively analyze their core competencies
- To understand the competitive landscape and identify significant growth strategies adopted by players across key regions
- To analyze competitive developments, such as expansions and fundings, new product launches, mergers and acquisitions, strategic partnerships, and agreements, in the 3D imaging market
Available customizations
With the given market data, MarketsandMarkets offers customizations as per the companys specific needs. The following customization options are available for the report:
Product analysis
- Product matrix provides a detailed comparison of the product portfolio of each company
Geographic analysis
- Further breakup of the North American 3D imaging market
- Further breakup of the European market
- Further breakup of the APAC market
- Further breakup of the Latin American market
- Further breakup of the MEA market
Company information
- Detailed analysis and profiling of additional market players up to 5


Growth opportunities and latent adjacency in 3D Imaging Market
Indepth understanding of the 3D market and all verticals and also how it may pertain to Medical 3D use.
Gather insights into 3D Imaging Market by Display Technology (Anaglyphy, Stereoscopy, Auto-stereoscopy), Imaging Solution (3D Modeling, 3D Scanning), Hardware (3D Display, 3D Sensor), Industry Vertical, Region and it's Global Forecast to 2020.
Gather insights into 3D Imaging Market by Display Technology (Anaglyphy, Stereoscopy, Auto-stereoscopy), Imaging Solution (3D Modeling, 3D Scanning), Hardware (3D Display, 3D Sensor), Industry Vertical, Region and it's Global Forecast to 2020.
Interested in the 3D measurement, scanning, imaging and surveying technology companies and markets.
Understanding market potential for 3D modelling market
Gather insights into 3D scanning and printing services.