5G Chipsets Market

5G Chipsets Market Size, Share and Industry Growth Analysis Report by Type (Modems, RFICs), Frequency (Sub - 6 GHz, 24 - 29 GHz, Above 39 GHz), Process Node (Less than 10 nm, 10 to 28 nm, Above 28 nm), End-use (Telecommunication Infrastructure, Mobile Devices) and Region - Global Growth Driver and Industry Forecast to 2028

Report Code: SE 6368 Mar, 2023, by marketsandmarkets.com

Updated on : May 30, 2023

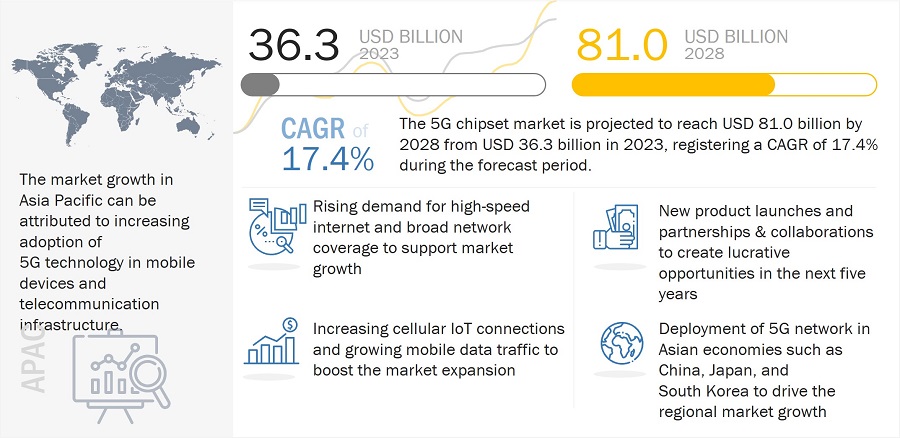
[233 Pages Report] Global 5G chipset market in terms of revenue was estimated to be worth USD 36.3 billion in 2023 and is poised to reach USD 81.0 billion by 2028, growing at a CAGR of 17.4% from 2023 to 2028. The new research study consists of an industry trend analysis of the market.

Key features fueling the growth of 5G Chipsets are the major factors driving the growth of the 5G chipset market are the growing demand for high-speed internet with better network coverage, increasing cellular and M2M IoT connections, and an increase in adoption of 5G in automobiles.
5G Chipsets Market

5G Chipsets Market Forecast to 2028

To know about the assumptions considered for the study, Request for Free Sample Report

Market Dynamics

Driver: Increased demand for high-speed internet

Rising demand for high-speed internet and extensive network coverage for several applications is likely to benefit the market in the forecast period. Growing distance learning, autonomous driving, multiuser gaming, and videoconferencing are anticipated to augment the 5g chipset market. Other factors include rising live streaming,  increasing demand for telemedicine, and the growing popularity of augmented reality. For instance, in June 2021, Reliance Jio (Mumbai) collaborated with NXP Semiconductor (Netherlands) to implement a 5G NR O-RAN small cell solution incorporating NXP’s Layerscape multicore processors. The combined solution powered new RAN networks that delivered high performances. It enabled a wide range of 5G use cases for broadband access and Industry 4.0 and IoT applications, including telemedicine, tele-education, augmented/virtual reality, drone-based agricultural monitoring, and more. Thus, 5G cellular services are expected to witness growing adoption to meet the demand for high-speed internet and high-quality voice services. Alongside this, the increasing penetration of connected devices in commercial and residential applications is expected to generate demand for short-range connectivity devices for extended coverage.

Restraint: High cost of 5G Devices

 The cost of 5G-capable smartphone chipsets will probably be higher than the price of existing 4G chipsets. In 2019, only high-end smartphones were equipped with first-generation 5G chipsets. Mass deployment in 2020–2021 was based on second- and third-generation chipsets. Only a small number of high-end smartphones employ Qualcomm's flagship Snapdragon 8-series Processor, which only supports 5G. By making its 7-series and 6-series lineups available on 5G, the business dramatically increased its 5G selection. For mid-range smartphones, Snapdragon 765 and Snapdragon 690 are already available. The 4-series chipset, which are utilized in less expensive phones was launched for to a larger audience. MediaTek and Qualcomm are anticipated to decrease the prices more in future.

Opportunity: Rising demand from autonomous cars, smart cities, and healthcare sector

5G network offers different features such as high-speed data transfer rate, low latency, and consistent connectivity-all easily manageable with previous-generation technology. These features are useful across various industries. For instance, in autonomous cars/connected cars, the low latency of 5G networks is critical to implement safety systems and real-time V2V and V2I communications. In smart cities, there are dense arrays of wireless sensors that enable various services and applications, right from environmental services and pollution monitoring to security surveillance, traffic management, and smart parking. Apparently, 5G infrastructure plays an integral role in meeting various requirements of several connected devices and numerous sensors that are being deployed. Furthermore, in healthcare, 5G networks could become a revolutionary development. For instance, in an emergency situation, a 5G network can help avail services such as telemedicine and emergency care providers. The wide adoption of 5G networks in different business segments would further increase opportunities for the 5G chipset market.

Challenge: Design challenges in RF Front Modules

 Demand for wireless communication systems with robust transmitting and receiving performance is growing tremendously as society shifts toward emerging technologies. The increase in efficiency increases the operating time in battery-powered products, thereby reducing the electric consumption of wireless base stations and similar applications. It is up to the RF device designer to balance and mitigate sensitivities to operating conditions while providing an easily implementable device that can accommodate the varied requirements of the targeted applications. Therefore, it is challenging to accommodate all the evolving technologies while designing robust RF semiconductor devices.

The 5G Chipsets market for the mobile devices segment held the largest share

In mobile devices segment, the acceleration of 5G connectivity is having a major impact on smartphones, tablets, and AR/VR devices. Amidst all the sub-segments of mobile devices, the smartphone’s share is expected to be highest. Smartphones and tablets will be the key opportunistic market space in the consumer electronics sector for the 5G chipsets market. The laptop market is also one of the major opportunities for 5G in devices beyond smartphones.

Asia Pacific accounted for the largest share of the 5G Chipsets market

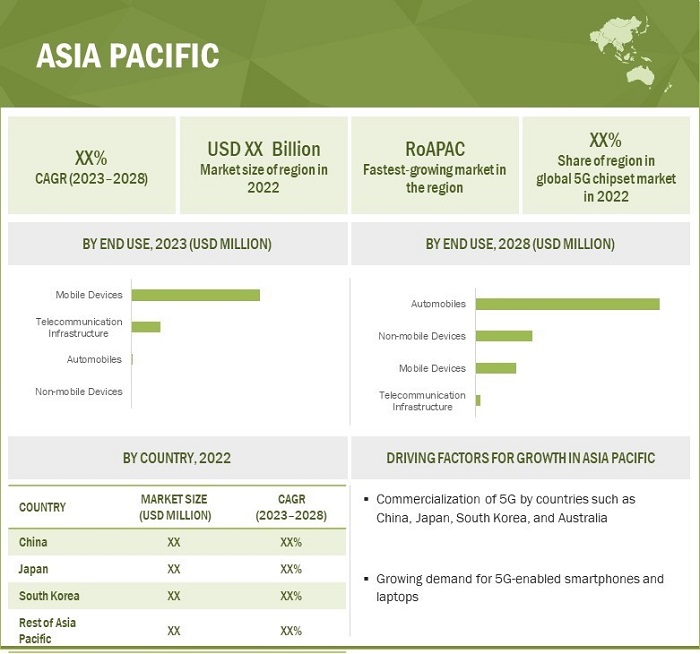
5G network would play an integral role in advanced technologies such as IoT and M2M communication and applications such as smart cities and industrial automation. 5G connectivity is suited to these areas, as it provides simultaneous connectivity for multiple devices and has low latency, which, in turn, improves the system's overall performance. According to GSMA, the total mobile connections in Asia Pacific will be 430 million on 5G networks by 2025. Between FY2022 and FY2025, mobile operators in the Asia Pacific region are set to invest USD 227 billion in 5G deployments. With 5G already launched in 19 countries, with others having plans to roll out in the coming time, Asia Pacific is anticipated to be the largest market for 5G chipsets industry.
5G Chipsets Market by Region

5G Chipsets Market by Region

To know about the assumptions considered for the study, download the pdf brochure

Top 5G Chipset Companies - Key Market Players

The 5G Chipsets companies have implemented various types of organic as well as inorganic growth strategies, such as new product launches and acquisitions, to strengthen their offerings in the market. The major players in the 5G Chipsets market are Qualcomm Technologies, Inc. (US), MediaTek Inc. (Taiwan), Huawei Technologies Co., Ltd. (China), SAMSUNG (South Korea), and Broadcom (US) among others.  The other companies profiled in the report are Qorvo, Inc (US), Skyworks Solutions, Inc.  (US), Analog Devices, Inc. (US), Marvell (US), Anokiwave, Inc  (US), NXP Semiconductors (Netherlands), Xilinx (Acquired by AMD) (US), Texas Instruments Incorporated (US),  Murata Manufacturing Co., Ltd. (Japan), Renesas Electronics Corporation (Japan), Infineon Technologies AG (Germany), MACOM (US), u-blox (Switzerland), Sivers IMA (Sweden), Unisoc (Shanghai) Technologies Co., Ltd. (China), Arm Limited (UK), Cadence Design Systems, Inc. (US), Fibocom Wireless Inc. (China), Quectel (China), and OMMIC (France).

Get online access to the report on the World's First Market Intelligence Cloud

  • Easy to Download Historical Data & Forecast Numbers
  • Company Analysis Dashboard for high growth potential opportunities
  • Research Analyst Access for customization & queries
  • Competitor Analysis with Interactive dashboard
  • Latest News, Updates & Trend analysis
Request Sample

Scope of the Report

Report Metric

Details

Estimated Market Size USD 36.3 Billion
Projected Market Size USD 81.0 Billion
Growth Rate 17.4%

Years considered

2019–2028

Base year considered

2022

Forecast period

2023–2028

Forecast units

Value (USD million/billion)

Segments covered

Type, End – Use, Process Node, and Frequency

Regions covered

North America, Europe, APAC, and the Rest of the World

Companies covered

 Qualcomm Technologies, Inc. (US), MediaTek Inc. (Taiwan), Huawei Technologies Co., Ltd. (China), SAMSUNG (South Korea), and Broadcom (US), Qorvo, Inc (US), Skyworks Solutions, Inc.  (US), Analog Devices, Inc. (US), Marvell (US), Anokiwave, Inc  (US), NXP Semiconductors (Netherlands), Xilinx (Acquired by AMD) (US), Texas Instruments Incorporated (US),  Murata Manufacturing Co., Ltd. (Japan), Renesas Electronics Corporation (Japan), Infineon Technologies AG (Germany), MACOM (US), u-blox (Switzerland), Sivers IMA (Sweden), Unisoc (Shanghai) Technologies Co., Ltd. (China), Arm Limited (UK), Cadence Design Systems, Inc. (US), Fibocom Wireless Inc. (China), Quectel (China), and OMMIC (France). The study includes an in-depth competitive analysis of these key players in the 5G Chipsets market with their company profiles, recent developments, and key market strategies.

5G Chipsets Market Highlights

In this report, the overall 5G Chipsets market has been segmented based on Type, End – Use, Process Node, and Frequency

Segment

Subsegment

By Type:

  • MODEMs
  • RFICs
    • RF TRANSCEIVER
    • RF FE

By End–Use:

  • Telecommunication Infrastructure
    • Macro Cells
    • Small Cell
    • Customer Premises Equipment (CPE)
  • Mobile Devices
    • Smartphones
    • Tablets & Laptops
    • Mobile Hubs
    • Robots/Drones
    • Wearables
    • AR/VR Devices
  • Non-Mobile Devices
    • IoT Gateways
    • Surveillance Cameras
  • Automobile

By Region:

  • North America
    • US
    • Canada
    • Mexico
  • Europe
    • UK
    • Germany
    • France
    • Rest of Europe
  • APAC
    • China
    • Japan
    • South Korea
    • Rest of Asia Pacific
  • Rest of the World
    • Middle East and Africa
    • South America

Recent Developments

  •  In December 2022, MediaTek Inc. announced its newest chipset for premium 5G smartphones. Smartphones, the Dimensity 8200. The new chipset delivers unparalleled power efficiency. It also integrates an octa-core CPU with four Arm Cortex-A78 cores operating up to 3.1 GHz and a powerful Mali-G610 graphics engine for better application performance.
  • In December 2022, Skyworks Solution launched the SKY66319-11, a highly efficient, wide instantaneous bandwidth possessing a fully input/output matched power amplifier (PA) with high gain and linearity. The compact 5 × 5 mm PA is designed for TDD 4G LTE and 5G systems operating from 4400 to 5000 MHz. The active biasing circuitry is integrated to compensate PA performance over temperature, voltage, and process variation
  • In December 2022, Skyworks Solutions, Inc. introduced the highest efficiency portfolio of Wi-Fi front-end modules (FEMs) in the industry in collaboration with Broadcom, addressing the power, performance, and thermal requirements of Wi-Fi 6/6E-enabled devices in next-generation enterprise and internet of things (IoT) products.
  • In November 2022, Qualcomm Technologies, Inc. partnered with Siemens to reimagine building automation by applying a 5G private network (PN) based on the Snapdragon X55 5G Modem-RF System in the Americas.

Frequently Asked Questions (FAQ):

To speak to our analyst for a discussion on the above findings, click Speak to Analyst

TABLE OF CONTENTS
 
1 INTRODUCTION (Page No. - 28)
    1.1 STUDY OBJECTIVES 
    1.2 MARKET DEFINITION 
           1.2.1 INCLUSIONS AND EXCLUSIONS
    1.3 STUDY SCOPE 
           1.3.1 MARKETS COVERED
           1.3.2 REGIONAL SCOPE
           1.3.3 YEARS CONSIDERED
    1.4 CURRENCY CONSIDERED 
    1.5 LIMITATIONS 
    1.6 STAKEHOLDERS 
    1.7 SUMMARY OF CHANGES 
 
2 RESEARCH METHODOLOGY (Page No. - 32)
    2.1 RESEARCH DATA 
           FIGURE 1 RESEARCH DESIGN
           2.1.1 SECONDARY AND PRIMARY RESEARCH
           2.1.2 SECONDARY DATA
                    2.1.2.1 Major secondary sources
                    2.1.2.2 Secondary sources
           2.1.3 PRIMARY DATA
                    2.1.3.1 Primary interviews with experts
                    2.1.3.2 Primary sources
                    2.1.3.3 Breakdown of primaries
                    2.1.3.4 Key industry insights
    2.2 MARKET SIZE ESTIMATION 
           2.2.1 BOTTOM-UP APPROACH
                    2.2.1.1 Approach to derive market share using bottom-up analysis (demand side)
                               FIGURE 2 BOTTOM-UP APPROACH
           2.2.2 TOP-DOWN APPROACH
                    2.2.2.1 Approach to derive market share using top-down analysis (supply side)
                               FIGURE 3 TOP-DOWN APPROACH
    2.3 MARKET BREAKDOWN AND DATA TRIANGULATION 
           FIGURE 4 DATA TRIANGULATION
    2.4 RESEARCH ASSUMPTIONS 
    2.5 ASSUMPTIONS RELATED TO RECESSION 
           TABLE 1 ASSUMPTIONS RELATED TO RECESSION
 
3 EXECUTIVE SUMMARY (Page No. - 41)
    3.1 GROWTH RATE ASSUMPTIONS/FORECASTS 
    3.2 RECESSION IMPACT ANALYSIS 
           FIGURE 5 GDP GROWTH PROJECTIONS TILL 2023 FOR MAJOR ECONOMIES
           FIGURE 6 PROJECTIONS FOR 5G CHIPSETS MARKET, 2019–2028
           FIGURE 7 YEARLY GROWTH TREND IN 5G CHIPSETS MARKET
           TABLE 2 5G CHIPSETS MARKET, 2019–2022 (USD BILLION)
           TABLE 3 5G CHIPSETS MARKET, 2023–2028 (USD BILLION)
           FIGURE 8 RFICS SEGMENT TO ACCOUNT FOR LARGER SHARE OF 5G CHIPSETS MARKET DURING FORECAST PERIOD
           FIGURE 9 AUTOMOBILE SEGMENT TO REGISTER HIGHEST CAGR IN 5G CHIPSETS MARKET DURING FORECAST PERIOD
           FIGURE 10 10–28 NM SEGMENT TO HOLD LARGEST SHARE OF 5G CHIPSETS MARKET IN 2028
           FIGURE 11 ASIA PACIFIC TO ACCOUNT FOR LARGEST SHARE OF 5G CHIPSETS MARKET DURING FORECAST PERIOD
 
4 PREMIUM INSIGHTS (Page No. - 48)
    4.1 ATTRACTIVE OPPORTUNITIES FOR PLAYERS IN 5G CHIPSETS MARKET 
           FIGURE 12 GROWING DEMAND FOR HIGH-SPEED INTERNET AND BROAD NETWORK COVERAGE
    4.2 5G CHIPSETS MARKET FOR MOBILE DEVICES, BY END USE 
           FIGURE 13 WEARABLES SEGMENT TO REGISTER HIGHEST CAGR BETWEEN 2023 AND 2028
    4.3 5G CHIPSETS MARKET FOR TELECOMMUNICATION INFRASTRUCTURE, BY END USE 
           FIGURE 14 CPE SEGMENT TO EXHIBIT HIGHEST CAGR BETWEEN 2023 AND 2028
    4.4 ASIA PACIFIC 5G CHIPSETS MARKET, BY END USE AND COUNTRY 
           FIGURE 15 MOBILE DEVICES SEGMENT AND CHINA TO HOLD LARGEST SHARES OF ASIA PACIFIC 5G CHIPSETS MARKET IN 2023
    4.5 5G CHIPSETS MARKET, BY FREQUENCY 
           FIGURE 16 SUB–6 GHZ SEGMENT TO HOLD LARGEST SHARE OF 5G CHIPSET MARKET IN 2028
    4.6 5G CHIPSETS MARKET, BY REGION 
           FIGURE 17 EUROPE TO RECORD HIGHEST CAGR BETWEEN 2023 AND 2028
 
5 MARKET OVERVIEW (Page No. - 51)
    5.1 INTRODUCTION 
    5.2 MARKET DYNAMICS 
           FIGURE 18 5G CHIPSETS MARKET: DRIVERS, RESTRAINTS, OPPORTUNITIES, AND CHALLENGES
           5.2.1 DRIVERS
                    5.2.1.1 Rising demand for high-speed internet and broad network coverage
                               FIGURE 19 GLOBAL MOBILE SUBSCRIPTIONS PER 100 PEOPLE
                    5.2.1.2 High use of M2M communication technology
                               FIGURE 20 GLOBAL IOT CONNECTIONS, 2020 VS. 2026
                               FIGURE 21 GLOBAL M2M CONNECTIONS (BILLION UNITS)
                    5.2.1.3 Growing mobile data traffic
                               FIGURE 22 MOBILE 5G DATA TRAFFIC, 2018–2028 (EB PER MONTH)
                               FIGURE 23 GLOBAL MOBILE DATA USAGE, 2022 VS. 2028
           5.2.2 RESTRAINTS
                    5.2.2.1 High cost of 5G chipsets for mobile devices
           5.2.3 OPPORTUNITIES
                    5.2.3.1 Rising demand for 5G network in automobiles, smart cities, and healthcare sector
                    5.2.3.2 Emergence of private 5G networks to address wireless communication requirements in industrial IoT
                               TABLE 4 USE CASES FOR PRIVATE 5G
           5.2.4 CHALLENGES
                    5.2.4.1 Design challenges for RF devices operating at higher frequency
    5.3 VALUE CHAIN ANALYSIS 
           FIGURE 24 5G CHIPSETS MARKET: VALUE CHAIN ANALYSIS
           TABLE 5 5G CHIPSETS MARKET: VALUE CHAIN ANALYSIS
    5.4 5G ECOSYSTEM ANALYSIS 
           FIGURE 25 5G TECHNOLOGY ECOSYSTEM
    5.5 PORTER’S FIVE FORCES ANALYSIS 
           TABLE 6 5G CHIPSETS MARKET: PORTER’S FIVE FORCES ANALYSIS
    5.6 PRICING ANALYSIS 
           FIGURE 26 AVERAGE SELLING PRICE OF 5G CHIPSETS, BY END USE
           FIGURE 27 GLOBAL AVERAGE PRICE TREND OF 5G CHIPSETS
           TABLE 7 AVERAGE PRICE OF 5G CHIPSET COMPONENTS
    5.7 PATENT ANALYSIS 
           FIGURE 28 5G CHIPSETS MARKET: PATENT ANALYSIS
           TABLE 8 RECENT PATENT REGISTRATIONS
    5.8 TRADE ANALYSIS 
           TABLE 9 EXPORT DATA FOR ELECTRONIC INTEGRATED CIRCUITS, BY COUNTRY, 2017–2021
           FIGURE 29 EXPORT DATA FOR HS CODE 854231, BY COUNTRY, 2017–2021 (USD MILLION)
           TABLE 10 IMPORT DATA FOR ELECTRONIC INTEGRATED CIRCUITS, BY COUNTRY, 2017–2021
           FIGURE 30 IMPORT DATA FOR HS CODE 854231, BY COUNTRY, 2017–2021 (USD MILLION)
    5.9 TARIFF AND REGULATORY LANDSCAPE 
           5.9.1 REGULATORY LANDSCAPE
           5.9.2 TARIFF
                    TABLE 11 TARIFF FOR ELECTRONIC INTEGRATED CIRCUITS AS PROCESSORS AND CONTROLLERS EXPORTED BY US, 2021
                    TABLE 12 TARIFF FOR ELECTRONIC INTEGRATED CIRCUITS AS PROCESSORS AND CONTROLLERS EXPORTED BY CHINA, 2021
                    TABLE 13 TARIFF FOR ELECTRONIC INTEGRATED CIRCUITS AS PROCESSORS AND CONTROLLERS EXPORTED BY GERMANY, 2021
    5.10 CASE STUDY ANALYSIS 
           5.10.1 USCELLULAR USES ERICSSON’S 5G MMWAVE EXTENDED RANGE FWA SERVICES TO DELIVER HIGH-SPEED BROADBAND SERVICES
           5.10.2 TUSASS AND ERICSSON CONNECTED GREENLAND WITH 5G
           5.10.3 INSEEGO’S 5G SOLUTIONS ENHANCED DIGITAL INFRASTRUCTURES OF SMART CITIES IN SOUTHERN EUROPE
    5.11 TECHNOLOGY ANALYSIS 
           FIGURE 31 5G CAPABILITIES
           5.11.1 COMPLEMENTARY TECHNOLOGY
                    5.11.1.1 Message queuing telemetry transport (MQTT)
                    5.11.1.2 Massive multiple input, multiple output (MIMO)
           5.11.2 ADJACENT TECHNOLOGY
                    5.11.2.1 Internet of Things (IoT)
                    5.11.2.2 Network slicing in radio access network (RAN)
 
6 5G CHIPSETS MARKET, BY TYPE (Page No. - 75)
    6.1 INTRODUCTION 
           FIGURE 32 RFICS SEGMENT TO DOMINATE 5G CHIPSETS MARKET DURING FORECAST PERIOD
           TABLE 14 5G CHIPSETS MARKET, BY TYPE, 2019–2022 (USD MILLION)
           TABLE 15 5G CHIPSETS MARKET, BY TYPE, 2023–2028 (USD MILLION)
    6.2 MODEMS 
           6.2.1 HIGH USE OF 5G BASEBAND PROCESSORS IN SMARTPHONES
                    TABLE 16 MODEMS: 5G CHIPSETS MARKET, BY END USE, 2019–2022 (USD MILLION)
                    TABLE 17 MODEMS: 5G CHIPSETS MARKET, BY END USE, 2023–2028 (USD MILLION)
                    TABLE 18 MODEMS: 5G CHIPSETS MARKET, BY END USE, 2019–2022 (MILLION UNITS)
                    TABLE 19 MODEMS: 5G CHIPSETS MARKET, BY END USE, 2023–2028 (MILLION UNITS)
                    TABLE 20 MODEMS: 5G CHIPSETS MARKET, BY TELECOMMUNICATION INFRASTRUCTURE, 2019–2022 (USD MILLION)
                    TABLE 21 MODEMS: 5G CHIPSETS MARKET, BY TELECOMMUNICATION INFRASTRUCTURE, 2023–2028 (USD MILLION)
                    FIGURE 33 SMARTPHONES SEGMENT TO HOLD LARGEST SHARE OF 5G CHIPSETS MARKET FOR MODEMS DURING FORECAST PERIOD
                    TABLE 22 MODEMS: 5G CHIPSETS MARKET, BY MOBILE DEVICES, 2019–2022 (USD MILLION)
                    TABLE 23 MODEMS: 5G CHIPSETS MARKET, BY MOBILE DEVICES, 2023–2028 (USD MILLION)
                    TABLE 24 MODEMS: 5G CHIPSETS MARKET, BY MOBILE DEVICE, 2019–2022 (MILLION UNITS)
                    TABLE 25 MODEMS: 5G CHIPSETS MARKET, BY MOBILE DEVICES, 2023–2028 (MILLION UNITS)
                    TABLE 26 MODEMS: 5G CHIPSETS MARKET, BY NON-MOBILE DEVICES, 2019–2022 (USD MILLION)
                    TABLE 27 MODEMS: 5G CHIPSETS MARKET, BY NON-MOBILE DEVICE, 2023–2028 (USD MILLION)
    6.3 RADIO FREQUENCY INTEGRATED CIRCUITS (RFICS) 
           6.3.1 CRUCIAL ROLE IN DESIGNING 5G CHIPSETS
                    FIGURE 34 RF TRANSCEIVERS SEGMENT TO REGISTER HIGHER CAGR IN 5G CHIPSETS MARKET FOR RFICS DURING FORECAST PERIOD
                    TABLE 28 RFICS: 5G CHIPSETS MARKET, BY END USE, 2019–2022 (USD MILLION)
                    TABLE 29 RFICS: 5G CHIPSETS MARKET, BY END USE, 2023–2028 (USD MILLION)
                    TABLE 30 RFICS: 5G CHIPSETS MARKET, BY END USE, 2019–2022 (MILLION UNITS)
                    TABLE 31 RFICS: 5G CHIPSETS MARKET, BY END USE, 2023–2028 (MILLION UNITS)
                    TABLE 32 RFICS: 5G CHIPSETS MARKET, BY TELECOMMUNICATION INFRASTRUCTURE, 2019–2022 (USD MILLION)
                    TABLE 33 RFICS: 5G CHIPSETS MARKET, BY TELECOMMUNICATION INFRASTRUCTURE, 2023–2028 (USD MILLION)
                    TABLE 34 RFICS: 5G CHIPSETS MARKET, BY MOBILE DEVICES, 2019–2022 (USD MILLION)
                    TABLE 35 RFICS: 5G CHIPSETS MARKET, BY MOBILE DEVICES, 2023–2028 (USD MILLION)
                    TABLE 36 RFICS: 5G CHIPSETS MARKET, BY MOBILE DEVICE, 2019–2022 (MILLION UNITS)
                    TABLE 37 RFICS: 5G CHIPSETS MARKET, BY MOBILE DEVICES, 2023–2028 (MILLION UNITS)
                    TABLE 38 RFICS: 5G CHIPSETS MARKET, BY NON-MOBILE DEVICES, 2019–2022 (USD MILLION)
                    TABLE 39 RFICS: 5G CHIPSETS MARKET, BY NON-MOBILE DEVICE, 2023–2028 (USD MILLION)
                    TABLE 40 RFICS: 5G CHIPSETS MARKET, BY NON-MOBILE DEVICE, 2019–2022 (MILLION UNITS)
                    TABLE 41 RFICS: 5G CHIPSETS MARKET, BY NON-MOBILE DEVICES, 2023–2028 (MILLION UNITS)
                    TABLE 42 5G CHIPSETS MARKET, BY RFICS TYPE, 2019–2022 (USD MILLION)
                    TABLE 43 5G CHIPSETS MARKET, BY RFICS TYPE, 2023–2028 (USD MILLION)
           6.3.2 RF TRANSCEIVERS
                    6.3.2.1 Increasing demand for wideband RF transceivers in 5G communication
                               TABLE 44 RF TRANSCEIVERS: 5G CHIPSETS MARKET, BY END USE, 2019–2022 (USD MILLION)
                               TABLE 45 RF TRANSCEIVERS: 5G CHIPSETS MARKET, BY END USE, 2023–2028 (USD MILLION)
                               TABLE 46 RF TRANSCEIVERS: 5G CHIPSETS MARKET, BY END USE, 2019–2022 (MILLION UNITS)
                               TABLE 47 RF TRANSCEIVERS: 5G CHIPSETS MARKET, BY END USE, 2023–2028 (MILLION UNITS)
           6.3.3 RF FE
                    6.3.3.1 Power amplifiers
                               6.3.3.1.1 Increasing applications of GaN-based power amplifiers in base stations
                    6.3.3.2 Switches
                               6.3.3.2.1 Technological advancements in telecom industry
                    6.3.3.3 Low-noise amplifiers
                               6.3.3.3.1 Increased applications of low-noise amplifiers (LNAs) in automobiles, consumer devices, and telecom equipment
                    6.3.3.4 Filters
                               6.3.3.4.1 Evolution of filters to become smaller, highly integrated, and handle higher power
                    6.3.3.5 Others
                               TABLE 48 RF FE: 5G CHIPSETS MARKET, BY END USE, 2019–2022 (USD MILLION)
                               TABLE 49 RF FE: 5G CHIPSETS MARKET, BY END USE, 2023–2028 (USD MILLION)
                               TABLE 50 RF FE: 5G CHIPSETS MARKET, BY END USE, 2019–2022 (MILLION UNITS)
                               TABLE 51 RF FE: 5G CHIPSETS MARKET, BY END USE, 2023–2028 (MILLION UNITS)
 
7 5G CHIPSETS MARKET, BY END USE (Page No. - 91)
    7.1 INTRODUCTION 
           FIGURE 35 MOBILE DEVICES SEGMENT TO HOLD LARGEST SHARE OF 5G CHIPSETS MARKET DURING FORECAST PERIOD
           TABLE 52 5G CHIPSETS MARKET, BY END USE, 2019–2022 (USD MILLION)
           TABLE 53 5G CHIPSETS MARKET, BY END USE, 2023–2028 (USD MILLION)
           TABLE 54 AVAILABILITY OF 5G DEVICES
    7.2 TELECOMMUNICATION INFRASTRUCTURE 
           TABLE 55 TELECOMMUNICATION INFRASTRUCTURE: 5G CHIPSETS MARKET, BY TYPE, 2019–2022 (USD MILLION)
           TABLE 56 TELECOMMUNICATION INFRASTRUCTURE: 5G CHIPSETS MARKET, BY TYPE, 2023–2028 (USD MILLION)
           TABLE 57 TELECOMMUNICATION INFRASTRUCTURE: 5G CHIPSETS MARKET, BY REGION, 2019–2022 (USD MILLION)
           TABLE 58 TELECOMMUNICATION INFRASTRUCTURE: 5G CHIPSETS MARKET, BY REGION, 2023–2028 (USD MILLION)
           7.2.1 MACRO CELL
                    7.2.1.1 Features large coverage area and high-efficiency output
                               TABLE 59 MACRO CELL: 5G CHIPSETS MARKET, BY TYPE, 2019–2022 (USD MILLION)
                               TABLE 60 MACRO CELL: 5G CHIPSETS MARKET, BY TYPE, 2023–2028 (USD MILLION)
                               TABLE 61 MACRO CELL: 5G CHIPSETS MARKET FOR RFICS, BY TYPE, 2019–2022 (USD MILLION)
                               TABLE 62 MACRO CELL: 5G CHIPSETS MARKET FOR RFICS, BY TYPE, 2023–2028 (USD MILLION)
           FIGURE 36 NORTH AMERICA TO REGISTER HIGHEST CAGR IN 5G CHIPSETS MARKET FOR MACRO CELLS DURING FORECAST PERIOD
                               TABLE 63 MACRO CELL: 5G CHIPSETS MARKET, BY REGION, 2019–2022 (USD MILLION)
                               TABLE 64 MACRO CELL: 5G CHIPSETS MARKET, BY REGION, 2023–2028 (USD MILLION)
           7.2.2 SMALL CELLS
                    7.2.2.1 Essential for applications demanding high bandwidth
                               TABLE 65 SMALL CELLS: 5G CHIPSETS MARKET, BY TYPE, 2019–2022 (USD MILLION)
                               TABLE 66 SMALL CELLS: 5G CHIPSETS MARKET, BY TYPE, 2023–2028 (USD MILLION)
                               TABLE 67 SMALL CELLS: 5G CHIPSETS MARKET, BY REGION, 2019–2022 (USD MILLION)
                               TABLE 68 SMALL CELLS: 5G CHIPSETS MARKET, BY REGION, 2023–2028 (USD MILLION)
           7.2.3 CUSTOMER PREMISES EQUIPMENT (CPE)
                    7.2.3.1 Rising demand in various industries
                               TABLE 69 CPE: 5G CHIPSETS MARKET, BY TYPE, 2019–2022 (USD MILLION)
                               TABLE 70 CPE: 5G CHIPSETS MARKET, BY TYPE, 2023–2028 (USD MILLION)
                               TABLE 71 CPE: 5G CHIPSETS MARKET, BY REGION, 2019–2022 (USD MILLION)
                               TABLE 72 CPE: 5G CHIPSETS MARKET, BY REGION, 2023–2028 (USD MILLION)
    7.3 MOBILE DEVICES 
           FIGURE 37 SMARTPHONES SEGMENT TO ACCOUNT FOR LARGEST SHARE OF 5G CHIPSETS MARKET FOR MOBILE DEVICES DURING FORECAST PERIOD
           TABLE 73 MOBILE DEVICES: 5G CHIPSETS MARKET, BY TYPE, 2019–2022 (USD MILLION)
           TABLE 74 MOBILE DEVICES: 5G CHIPSETS MARKET, BY TYPE, 2023–2028 (USD MILLION)
           TABLE 75 MOBILE DEVICES: 5G CHIPSETS MARKET, BY REGION, 2019–2022 (USD MILLION)
           TABLE 76 MOBILE DEVICES: 5G CHIPSETS MARKET, BY REGION, 2023–2028 (USD MILLION)
           7.3.1 SMARTPHONES
                    7.3.1.1 Rising demand for 5G smartphones
                               FIGURE 38 MODEMS SEGMENT TO HOLD LARGER SHARE OF 5G CHIPSETS MARKET FOR SMARTPHONES DURING FORECAST PERIOD
                               TABLE 77 SMARTPHONES: 5G CHIPSETS MARKET, BY TYPE, 2019–2022 (USD MILLION)
                               TABLE 78 SMARTPHONES: 5G CHIPSETS MARKET, BY TYPE, 2023–2028 (USD MILLION)
                               TABLE 79 SMARTPHONES: 5G CHIPSETS MARKET FOR RFICS, BY TYPE, 2019–2022 (USD MILLION)
                               TABLE 80 SMARTPHONES: 5G CHIPSETS MARKET FOR RFICS, BY TYPE, 2023–2028 (USD MILLION)
           7.3.2 TABLETS & LAPTOPS
                    7.3.2.1 Development of 5G-enabled tablets and laptops
                               TABLE 81 TABLETS & LAPTOPS: 5G CHIPSETS MARKET, BY TYPE, 2019–2022 (USD MILLION)
                               TABLE 82 TABLETS & LAPTOPS: 5G CHIPSETS MARKET, BY TYPE, 2023–2028 (USD MILLION)
                               TABLE 83 TABLETS & LAPTOPS: 5G CHIPSETS MARKET FOR RFICS, BY TYPE, 2019–2022 (USD MILLION)
                               TABLE 84 TABLETS & LAPTOPS: 5G CHIPSETS MARKET FOR RFICS, BY TYPE, 2023–2028 (USD MILLION)
           7.3.3 MOBILE HUBS
                    7.3.3.1 Growing use of mobile hubs to provide scalable and reliable mobile communication and data processing capabilities to smart mobile objects
                               TABLE 85 MOBILE HUBS: 5G CHIPSETS MARKET, BY TYPE, 2019–2022 (USD MILLION)
                               TABLE 86 MOBILE HUBS: 5G CHIPSETS MARKET, BY TYPE, 2023–2028 (USD MILLION)
                               TABLE 87 MOBILE HUBS: 5G CHIPSETS MARKET FOR RFICS, BY TYPE, 2019–2022 (USD MILLION)
                               TABLE 88 MOBILE HUBS: 5G CHIPSETS MARKET FOR RFICS, BY TYPE, 2023–2028 (USD MILLION)
           7.3.4 ROBOTS/DRONES
                    7.3.4.1 Rising adoption of autonomous robots with 5G wireless networking capabilities
                               TABLE 89 ROBOTS/DRONES: 5G CHIPSETS MARKET, BY TYPE, 2019–2022 (USD MILLION)
                               TABLE 90 ROBOTS/DRONES: 5G CHIPSETS MARKET, BY TYPE, 2023–2028 (USD MILLION)
                               FIGURE 39 RF FE SEGMENT TO ACCOUNT FOR LARGER SHARE OF 5G CHIPSETS MARKET FOR RFICS IN ROBOTS BETWEEN 2023 AND 2028
           7.3.5 WEARABLES
                    7.3.5.1 Rising demand for wearables tethered via wireless technologies to smartphones
                               TABLE 91 WEARABLES: 5G CHIPSETS MARKET, BY TYPE, 2019–2022 (USD MILLION)
                               TABLE 92 WEARABLES: 5G CHIPSETS MARKET, BY TYPE, 2023–2028 (USD MILLION)
           7.3.6 AR/VR DEVICES
                    7.3.6.1 5G to offer heavy bandwidth required by AR/VR devices
                               TABLE 93 AR/VR DEVICES: 5G CHIPSETS MARKET, BY TYPE, 2019–2022 (USD MILLION)
                               TABLE 94 AR/VR DEVICES: 5G CHIPSETS MARKET, BY TYPE, 2023–2028 (USD MILLION)
    7.4 NON-MOBILE DEVICES 
           FIGURE 40 SURVEILLANCE CAMERAS SEGMENT TO LEAD 5G CHIPSETS MARKET FOR NON-MOBILE DEVICES DURING FORECAST PERIOD
           TABLE 95 NON-MOBILE DEVICES: 5G CHIPSETS MARKET, BY TYPE, 2019–2022 (USD MILLION)
           TABLE 96 NON-MOBILE DEVICES: 5G CHIPSETS MARKET, BY TYPE, 2023–2028 (USD MILLION)
           TABLE 97 NON-MOBILE DEVICES: 5G CHIPSETS MARKET, BY REGION, 2019–2022 (USD MILLION)
           TABLE 98 NON-MOBILE DEVICES: 5G CHIPSETS MARKET, BY REGION, 2023–2028 (USD MILLION)
           7.4.1 IOT GATEWAYS
                    7.4.1.1 Enhanced capacity and coverage of 5G network
                               FIGURE 41 RFICS SEGMENT TO DOMINATE 5G CHIPSETS MARKET FOR IOT GATEWAYS BETWEEN 2023 AND 2028
                               TABLE 99 IOT GATEWAYS: 5G CHIPSETS MARKET, BY TYPE, 2019–2022 (USD MILLION)
                               TABLE 100 IOT GATEWAYS: 5G CHIPSETS MARKET, BY TYPE, 2023–2028 (USD MILLION)
                               TABLE 101 IOT GATEWAYS: 5G CHIPSETS MARKET FOR RFICS, BY TYPE, 2019–2022 (USD MILLION)
                               TABLE 102 IOT GATEWAYS: 5G CHIPSETS MARKET FOR RFICS, BY TYPE, 2023–2028 (USD MILLION)
           7.4.2 SURVEILLANCE CAMERAS
                    7.4.2.1 Rising criminal and fraudulent activities
                               TABLE 103 SURVEILLANCE CAMERAS: 5G CHIPSETS MARKET, BY TYPE, 2019–2022 (USD MILLION)
                               TABLE 104 SURVEILLANCE CAMERAS: 5G CHIPSETS MARKET, BY TYPE, 2023–2028 (USD MILLION)
                               TABLE 105 SURVEILLANCE CAMERAS: 5G CHIPSETS MARKET FOR RFICS, BY TYPE, 2019–2022 (USD MILLION)
                               TABLE 106 SURVEILLANCE CAMERAS: 5G CHIPSETS MARKET FOR RFICS, BY TYPE, 2023–2028 (USD MILLION)
    7.5 AUTOMOBILES 
           7.5.1 5G CHIPSETS TO WITNESS HIGH ADOPTION IN TELEMATICS
           7.5.2 CELLULAR V2X
                    7.5.2.1 5G V2X to foster synergies between automobile and other verticals
                               FIGURE 42 ASIA PACIFIC TO EXHIBIT HIGHEST CAGR IN 5G CHIPSETS MARKET FOR AUTOMOBILES BETWEEN 2023 AND 2028
                               TABLE 107 AUTOMOBILES: 5G CHIPSETS MARKET, BY TYPE, 2019–2022 (USD MILLION)
                               TABLE 108 AUTOMOBILES: 5G CHIPSETS MARKET, BY TYPE, 2023–2028 (USD MILLION)
                               TABLE 109 AUTOMOBILES: 5G CHIPSETS MARKET FOR RFICS, BY TYPE, 2019–2022 (USD MILLION)
                               TABLE 110 AUTOMOBILES: 5G CHIPSETS MARKET FOR RFICS, BY TYPE, 2023–2028 (USD MILLION)
                               TABLE 111 AUTOMOBILES: 5G CHIPSETS MARKET, BY REGION, 2019–2022 (USD MILLION)
                               TABLE 112 AUTOMOBILES: 5G CHIPSETS MARKET, BY REGION, 2023–2028 (USD MILLION)
 
8 5G CHIPSETS MARKET, BY FREQUENCY (Page No. - 116)
    8.1 INTRODUCTION 
           FIGURE 43 24–39 GHZ SEGMENT TO REGISTER HIGHEST CAGR IN 5G CHIPSETS MARKET FROM 2023 TO 2028
           TABLE 113 5G CHIPSETS MARKET, BY FREQUENCY, 2019–2022 (USD MILLION)
           TABLE 114 5G CHIPSETS MARKET, BY FREQUENCY, 2023–2028 (USD MILLION)
    8.2 SUB–6 GHZ 
           8.2.1 HIGH DEMAND FOR SUB-6 GHZ 5G CHIPSETS FROM QUALCOMM, MEDIATEK, AND SAMSUNG
    8.3 24–39 GHZ 
           8.3.1 GROWING NEED TO ADDRESS MOBILE DATA TRAFFIC ISSUE
    8.4 ABOVE 39 GHZ 
           8.4.1 INCREASING ADOPTION OF ABOVE 39 GHZ SPECTRUM FOR FIXED POINT-TO-POINT AND POINT-TO-MULTIPOINT SATELLITE OPERATIONS
 
9 5G CHIPSETS MARKET, BY PROCESS NODE (Page No. - 120)
    9.1 INTRODUCTION 
           FIGURE 44 10–28 NM SEGMENT TO RECORD HIGHEST CAGR IN 5G CHIPSETS MARKET DURING FORECAST PERIOD
           TABLE 115 5G CHIPSETS MARKET, BY PROCESS NODE, 2019–2022 (USD MILLION)
           TABLE 116 5G CHIPSETS MARKET, BY PROCESS NODE, 2023–2028 (USD MILLION)
    9.2 LESS THAN 10 NM 
           9.2.1 RISING DEPLOYMENT OF 5–7 NM 5G CHIPSETS IN SMARTPHONES
    9.3 10–28 NM 
           9.3.1 HIGH ADOPTION OF PROCESS NODES RANGING FROM 10–28 NM IN MOBILE DEVICES
    9.4 ABOVE 28 NM 
           9.4.1 INCREASING APPLICATIONS OF RF COMPONENTS WITH PROCESS NODES ABOVE 28 NM IN 5G INFRASTRUCTURE
 
10 5G CHIPSETS MARKET, BY REGION (Page No. - 123)
     10.1 INTRODUCTION 
             FIGURE 45 SOUTH AMERICA AND MEXICO TO BE NEW HOTSPOTS FOR 5G CHIPSETS MARKET DURING FORECAST PERIOD
             TABLE 117 5G CHIPSETS MARKET, BY REGION, 2019–2022 (USD MILLION)
             TABLE 118 5G CHIPSETS MARKET, BY REGION, 2023–2028 (USD MILLION)
     10.2 NORTH AMERICA 
           FIGURE 46 NORTH AMERICA: 5G CHIPSETS MARKET SNAPSHOT
             10.2.1 NORTH AMERICA: RECESSION IMPACT
                        TABLE 119 NORTH AMERICA: 5G CHIPSETS MARKET, BY END USE, 2019–2022 (USD MILLION)
                        TABLE 120 NORTH AMERICA: 5G CHIPSETS MARKET, BY END USE, 2023–2028 (USD MILLION)
                        TABLE 121 NORTH AMERICA: 5G CHIPSETS MARKET, BY COUNTRY, 2019–2022 (USD MILLION)
                        TABLE 122 NORTH AMERICA: 5G CHIPSETS MARKET, BY COUNTRY, 2023–2028 (USD MILLION)
             10.2.2 US
                        10.2.2.1 Collaboration of Department of Defense (DoD) with industry players and academia under 5G-to-Next G initiative
             10.2.3 CANADA
                        10.2.3.1 Rising investments in clean energy, drive-less vehicle, and smart city projects
             10.2.4 MEXICO
                        10.2.4.1 Deployment of 5G network by companies on trial basis
     10.3 EUROPE 
           FIGURE 47 EUROPE: 5G CHIPSETS MARKET SNAPSHOT
             10.3.1 EUROPE: RECESSION IMPACT
                        TABLE 123 5G ACTIVITIES IN EUROPE
                        TABLE 124 EUROPE: 5G CHIPSETS MARKET, BY END USE, 2019–2022 (USD MILLION)
                        TABLE 125 EUROPE: 5G CHIPSETS MARKET, BY END USE, 2023–2028 (USD MILLION)
                        TABLE 126 EUROPE: 5G CHIPSETS MARKET, BY COUNTRY, 2019–2022 (USD MILLION)
                        TABLE 127 EUROPE: 5G CHIPSETS MARKET, BY COUNTRY, 2023–2028 (USD MILLION)
             10.3.2 UK
                        10.3.2.1 UK to dominate 5G chipsets market in Europe with increasing PPP activities
             10.3.3 GERMANY
                        10.3.3.1 Developments by Vodafone and T-Mobile companies in 5G
             10.3.4 FRANCE
                        10.3.4.1 Deployment of connected car technologies by renowned car manufacturers
             10.3.5 REST OF EUROPE
     10.4 ASIA PACIFIC 
           FIGURE 48 ASIA PACIFIC: 5G CHIPSETS MARKET SNAPSHOT
             10.4.1 ASIA PACIFIC: RECESSION IMPACT
                        TABLE 128 ASIA PACIFIC: 5G CHIPSETS MARKET, BY END USE, 2019–2022 (USD MILLION)
                        TABLE 129 ASIA PACIFIC: 5G CHIPSETS MARKET, BY END USE, 2023–2028 (USD MILLION)
                        TABLE 130 ASIA PACIFIC: 5G CHIPSETS MARKET, BY COUNTRY, 2019–2022 (USD MILLION)
                        TABLE 131 ASIA PACIFIC: 5G CHIPSETS MARKET, BY COUNTRY, 2023–2028 (USD MILLION)
             10.4.2 CHINA
                        10.4.2.1 Expanding 5G chipsets market
             10.4.3 JAPAN
                        10.4.3.1 Rising development and deployment of 5G infrastructure
             10.4.4 SOUTH KOREA
                        10.4.4.1 Increasing collaborations between government and private companies to launch 5G mobile networks
             10.4.5 REST OF ASIA PACIFIC
     10.5 ROW 
           FIGURE 49 ROW: 5G CHIPSETS MARKET SNAPSHOT
             10.5.1 ROW: RECESSION IMPACT
                        TABLE 132 ROW: 5G CHIPSETS MARKET, BY END USE, 2019–2022 (USD MILLION)
                        TABLE 133 ROW: 5G CHIPSETS MARKET, BY END USE, 2023–2028 (USD MILLION)
                        TABLE 134 ROW: 5G CHIPSETS MARKET, BY COUNTRY, 2019–2022 (USD MILLION)
                        TABLE 135 ROW: 5G CHIPSETS MARKET, BY COUNTRY, 2023–2028 (USD MILLION)
             10.5.2 MIDDLE EAST & AFRICA
                        10.5.2.1 Increasing demand for 5G in UAE, Saudi Arabia, and Qatar
             10.5.3 SOUTH AMERICA
                        10.5.3.1 Rising demand for smartphones and mobile networks in Brazil, Mexico, Chile, and Argentina
 
11 COMPETITIVE LANDSCAPE (Page No. - 144)
     11.1 OVERVIEW 
     11.2 REVENUE ANALYSIS 
             FIGURE 50 THREE-YEAR REVENUE ANALYSIS OF TOP FIVE PLAYERS IN 5G CHIPSETS MARKET
     11.3 MARKET SHARE ANALYSIS 
             FIGURE 51 5G CHIPSETS MARKET SHARE, 2022
             TABLE 136 5G CHIPSETS MARKET: DEGREE OF COMPETITION
     11.4 COMPANY EVALUATION QUADRANT, 2022 
             11.4.1 STARS
             11.4.2 EMERGING LEADERS
             11.4.3 PERVASIVE PLAYERS
             11.4.4 PARTICIPANTS
                        FIGURE 52 GLOBAL 5G CHIPSETS MARKET: KEY COMPANY EVALUATION QUADRANT, 2022
     11.5 SMALL AND MEDIUM-SIZED ENTERPRISES (SMES) EVALUATION QUADRANT, 2022 
             11.5.1 PROGRESSIVE COMPANIES
             11.5.2 RESPONSIVE COMPANIES
             11.5.3 DYNAMIC COMPANIES
             11.5.4 STARTING BLOCKS
                        FIGURE 53 GLOBAL 5G CHIPSETS MARKET: SME EVALUATION QUADRANT, 2022
                        TABLE 137 5G CHIPSETS MARKET: COMPANY FOOTPRINT
                        TABLE 138 5G CHIPSETS MARKET: TYPE FOOTPRINT
                        TABLE 139 5G CHIPSETS MARKET: APPLICATION FOOTPRINT
                        TABLE 140 5G CHIPSETS MARKET: REGIONAL FOOTPRINT
     11.6 COMPETITIVE SCENARIOS AND TRENDS 
             11.6.1 PRODUCT LAUNCHES
                        TABLE 141 5G CHIPSETS MARKET: PRODUCT LAUNCHES, FEBRUARY 2019–DECEMBER 2022
             11.6.2 DEALS
                        TABLE 142 5G CHIPSETS MARKET: DEALS, FEBRUARY 2019–DECEMBER 2022
             11.6.3 OTHERS
                        TABLE 143 5G CHIPSETS MARKET: OTHERS, FEBRUARY 2020–OCTOBER 2022
 
12 COMPANY PROFILES (Page No. - 165)
     12.1 KEY PLAYERS 
(Business overview, Products offered, Recent developments, Product launches, Deals, MnM view, Key strengths/Right to win, Strategic choices made, and Weaknesses/competitive threats)*  
             12.1.1 QUALCOMM TECHNOLOGIES, INC.
                        TABLE 144 QUALCOMM TECHNOLOGIES, INC.: COMPANY OVERVIEW
                        FIGURE 54 QUALCOMM TECHNOLOGIES, INC.: COMPANY SNAPSHOT
             12.1.2 SAMSUNG
                        TABLE 145 SAMSUNG: COMPANY OVERVIEW
                        FIGURE 55 SAMSUNG: COMPANY SNAPSHOT
             12.1.3 MEDIATEK INC.
                        TABLE 146 MEDIATEK INC.: COMPANY OVERVIEW
                        FIGURE 56 MEDIATEK INC.: COMPANY SNAPSHOT
             12.1.4 HUAWEI TECHNOLOGIES CO., LTD.
                        TABLE 147 HUAWEI TECHNOLOGIES CO., LTD.: COMPANY OVERVIEW
                        FIGURE 57 HUAWEI TECHNOLOGIES CO., LTD.: COMPANY SNAPSHOT
             12.1.5 BROADCOM
                        TABLE 148 BROADCOM: COMPANY OVERVIEW
                        FIGURE 58 BROADCOM: COMPANY SNAPSHOT
             12.1.6 QORVO
                        TABLE 149 QORVO: COMPANY OVERVIEW
                        FIGURE 59 QORVO: COMPANY SNAPSHOT
             12.1.7 SKYWORKS SOLUTIONS, INC.
                        TABLE 150 SKYWORKS SOLUTIONS, INC.: COMPANY OVERVIEW
                        FIGURE 60 SKYWORKS: COMPANY SNAPSHOT
             12.1.8 ANALOG DEVICES
                        TABLE 151 ANALOG DEVICES: COMPANY OVERVIEW
                        FIGURE 61 ANALOG DEVICES: COMPANY SNAPSHOT
             12.1.9 MARVELL
                        TABLE 152 MARVELL: COMPANY OVERVIEW
                        FIGURE 62 MARVELL: COMPANY SNAPSHOT
             12.1.10 ANOKIWAVE INC.
                        TABLE 153 ANOKIWAVE INC.: COMPANY OVERVIEW
             12.1.11 NXP SEMICONDUCTOR
                        TABLE 154 NXP SEMICONDUCTOR: COMPANY OVERVIEW
                        FIGURE 63 NXP SEMICONDUCTOR: COMPANY SNAPSHOT
     12.2 OTHER PLAYERS 
             12.2.1 XILINX
             12.2.2 TEXAS INSTRUMENTS INCORPORATED
             12.2.3 MURATA MANUFACTURING CO., LTD.
             12.2.4 RENESAS ELECTRONICS CORPORATION
             12.2.5 INFINEON TECHNOLOGIES AG
             12.2.6 MACOM
             12.2.7 U-BLOX
             12.2.8 SIVERS IMA
             12.2.9 UNISOC (SHANGHAI) TECHNOLOGIES CO., LTD.
             12.2.10 ARM LIMITED
             12.2.11 CADENCE DESIGN SYSTEMS, INC.
             12.2.12 FIBOCOM WIRELESS INC.
             12.2.13 QUECTEL
             12.2.14 OMMIC
*Details on Business overview, Products offered, Recent developments, Product launches, Deals, MnM view, Key strengths/Right to win, Strategic choices made, and Weaknesses/competitive threats might not be captured in case of unlisted companies.  
 
13 APPENDIX (Page No. - 226)
     13.1 DISCUSSION GUIDE 
     13.2 KNOWLEDGESTORE: MARKETSANDMARKETS’ SUBSCRIPTION PORTAL 
     13.3 RELATED REPORTS 
     13.4 AUTHOR DETAILS 
 

The study involves four major activities for estimating the size of the 5G chipsets market. Exhaustive secondary research has been conducted to collect information related to the market. The next step has been validating these findings, assumptions, and sizing with the industry experts across the value chain through primary research. Bottom-up approaches have been used to estimate and validate the size of the 5G Chipsets market and other dependent submarkets. The leading players in the market have been identified through secondary research, and their market share in the key regions has been determined through primary and secondary research. This entire procedure includes the study of the annual and financial reports of the top players and extensive interviews with the industry experts such as chief executive officers, vice presidents, directors, and marketing executives for key insights.

Secondary Research

In the secondary research process, various secondary sources have been referred to for identifying and collecting information important for this study. Secondary sources such as The Organization for Economic Co-operation and Development (OECD), Center for Security and Emerging Technology, The Japan External Trade Organization (JETRO), Semiconductor Industry Association, and SEMI have been used to identify and collect information for an extensive technical and commercial study of the 5G chipsets market.

Primary Research

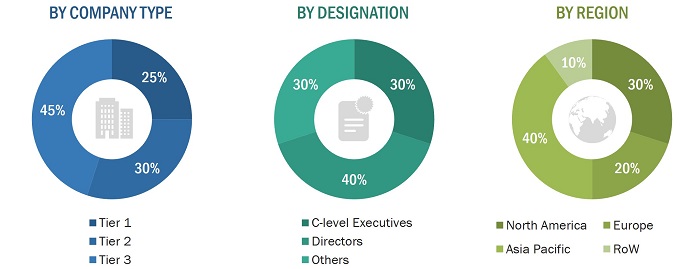
Extensive primary research was conducted after understanding and analyzing the 5G chipsets market through secondary research. Several primary interviews were conducted with key opinion leaders from both the demand- and supply-side vendors across major regions—North America, Europe, APAC, and RoW. Approximately 30% of the primary interviews were conducted with the demand-side vendors and 70% with the supply-side vendors. This primary data was mainly collected through telephonic interviews/web conferences, which consist of 85% of total primary interviews, as well as questionnaires and e-mails.
5G Chipsets Market Size, and Share

To know about the assumptions considered for the study, download the pdf brochure

Market Size Estimation

The 5G Chipsets market consists of by type: Modems and RFICs. 5G chipsets is usually employed in the following end – uses; telecommunication, mobile devices, non–mobile devices, and automobile. Top-down and bottom-up approaches have been used to estimate and validate the size of the 5G chipsets market and other dependent submarkets. The leading players in the market have been identified through secondary research, and their market share in the key regions has been determined through primary and secondary research. This entire procedure includes the study of the annual and financial reports of the top players and extensive interviews with the industry experts such as chief executive officers, vice presidents, directors, and marketing executives for key insights.

Data Triangulation

After arriving at the overall market size from the market size estimation process explained earlier, the total market was split into several segments and subsegments. To complete the overall market engineering process and arrive at the exact statistics for all segments and subsegments data triangulation and market breakdown procedures have been employed, wherever applicable. The data has been triangulated by studying various factors and trends from both the demand and supply sides. Along with this, the market has been validated using both top-down and bottom-up approaches.

Study Objectives:

  • To describe and forecast the 5G Chipsets market, in terms of value, by type, process node, frequency, end – use.
  • To describe and forecast the 5G Chipsets market, in terms of value, for four main regions – North America, Europe, APAC, and the Rest of the World.
  • To provide detailed information regarding the major factors influencing the market growth (drivers, restraints, opportunities, and challenges)
  • To strategically analyze micromarkets1 with respect to individual growth trends, prospects, and contributions to the total market
  • To study the complete value chain of the 5G Chipsets market
  • To analyze opportunities in the market for stakeholders by identifying high-growth segments of the 5G Chipsets ecosystem
  • To profile key players and comprehensively analyze their market position in terms of ranking and core competencies2, and provide a detailed competitive landscape of the market
  • To analyze the competitive developments, such as joint ventures, collaborations, agreements, contracts, partnerships, mergers & acquisitions, new product developments, and research and development (R&D), in the 5G Chipsets market

Available Customizations:

With the given market data, MarketsandMarkets offers customizations according to the specific requirements of companies. The following customization options are available for the report.

Company information:

  • Detailed analysis and profiling of additional market players (up to 5)
Custom Market Research Services

We will customize the research for you, in case the report listed above does not meet with your exact requirements. Our custom research will comprehensively cover the business information you require to help you arrive at strategic and profitable business decisions.

Request Customization

Instant Answers with GPT - Ask Now!

Ask real questions. Get complete answers !
Report Code
SE 6368
Published ON
Mar, 2023
Choose License Type
BUY NOW
  • SHARE
X
Request Customization
Speak to Analyst
Speak to Analyst
OR FACE-TO-FACE MEETING
PERSONALIZE THIS RESEARCH
  • Triangulate with your Own Data
  • Get Data as per your Format and Definition
  • Gain a Deeper Dive on a Specific Application, Geography, Customer or Competitor
  • Any level of Personalization
REQUEST A FREE CUSTOMIZATION
LET US HELP YOU!
  • What are the Known and Unknown Adjacencies Impacting the 5G Chipsets Market
  • What will your New Revenue Sources be?
  • Who will be your Top Customer; what will make them switch?
  • Defend your Market Share or Win Competitors
  • Get a Scorecard for Target Partners
CUSTOMIZED WORKSHOP REQUEST
+1-888-600-6441
  • Call Us
  • +1-888-600-6441 (Corporate office hours)
  • +1-888-600-6441 (US/Can toll free)
  • +44-800-368-9399 (UK office hours)
CONNECT WITH US
ABOUT TRUST ONLINE
©2023 MarketsandMarkets Research Private Ltd. All rights reserved
DMCA.com Protection Status Website Feedback