Access Control Market

Access Control Market by Offering (Hardware-Card-based, Biometric, & Multi-technology Readers, Electronic Locks, Controllers; Software; Services), ACaaS (Hosted, Managed, Hybrid), Vertical and Region- Global Forecast to 2028

Report Code: SE 3145 Mar, 2023, by marketsandmarkets.com

[255 Pages Report] The global Access Control Market size is projected to grow from USD 9.9 billion in 2023 to USD 14.9 billion by 2028; it is expected to grow at a CAGR of 8.4% from 2023 to 2028.

The extensive use of access control in home security and ongoing technological advancements and increasing deployment of wireless security systems across all verticals are responsible to drive market growth during the forecast period. Factors such as rising demand for collaborative growing implementation of mobile-based access control in long run are fueling the market growth for access control industry.
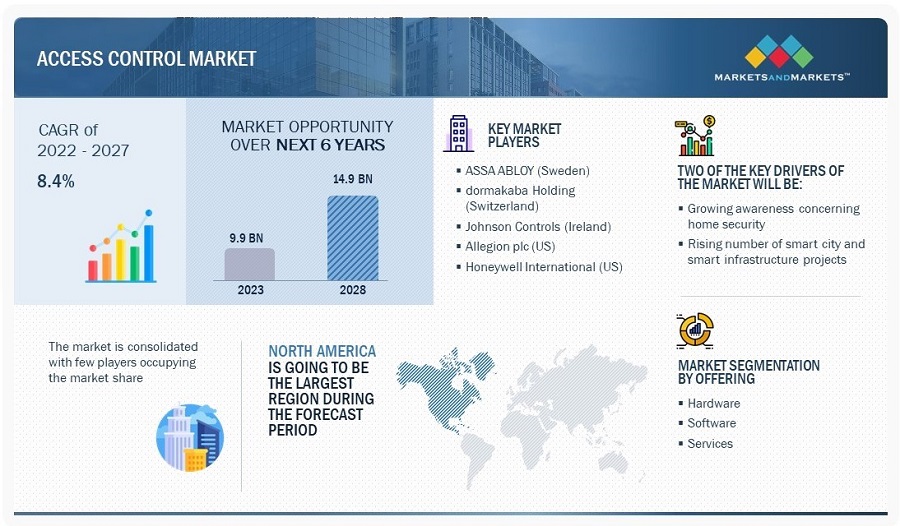
Access Control Market

Access Control Market Forecast to 2028

To know about the assumptions considered for the study, Request for Free Sample Report

Access Control Market Dynamics

Driver: Increasing adoption of IoT-based security systems with cloud computing platforms

IoT has enhanced the quality and efficiency of automation systems by allowing them to exchange data securely and linking smart objects to the internet. Connected security systems communicate with devices through the cloud, which helps to monitor key areas remotely. Moreover, IoT-based security systems are safe because they are authenticated with passwords to avoid hacking. Several businesses are shifting their traditional practices to IoT as the technology can be used in numerous solutions, such as smart alarm systems and smart garage door openers.

Restraint: Security and privacy concerns related to unauthorized access and data breaches in access control environment

The growing number of cybercrimes and terrorist attacks globally has led to increased concerns regarding the safety and security of assets and people. In most industries, physical and logical security are separate departments as their requirements and approaches are different. Inadequate access control causes intruders to gain unauthorized access to organizational data. Intruder breaching can be attributed directly to a lack of proper access control service.

Opportunity: Growing implementation of mobile-based access control

There are several benefits associated with mobile access control. Besides offering a convenient way of entering a building, it also gives property managers and staff a simple and efficient way to manage access permissions. Key areas where mobile-based access control can be used are:

  • Multifamily apartment buildings
  • Commercial and mixed-use properties
  • Gated communities
  • The integration of biometrics with mobile devices enhances the level of security in various applications. Biometrics-enabled smartphones represent a complementary new platform, and it is perceived that it will expand the market for authentication systems and improve user security and convenience.

Challenge: Low awareness among users about availability and benefits of advanced security solutions

For centuries, access control systems have been existing in their simplest form as mechanical locks; with technology’s evolution, there have been various improvements and innovations. Access control systems now leverage technologies such as biometrics, radio frequency (RF), near-field communication (NFC), cloud computing, and Bluetooth. However, the need for training and testing and the cost of implementing smart locks erode their attractiveness to end-users. Low awareness regarding newly developed wireless locks and their extended benefits when integrated with the cloud act as a challenge to the growth of this market.  

Access Control Market Ecosystem

The access control market is highly competitive. It is marked by the presence of a few tier-1 companies, such as ASSA ABLOY (Sweden), Johnson Controls (Ireland), dorm Akaba Holding (Switzerland), Allegion plc (Ireland), Honeywell International (US), and Neap (Netherlands). These companies have created a competitive ecosystem by investing in research and development activities to launch highly efficient and reliable access control solutions.
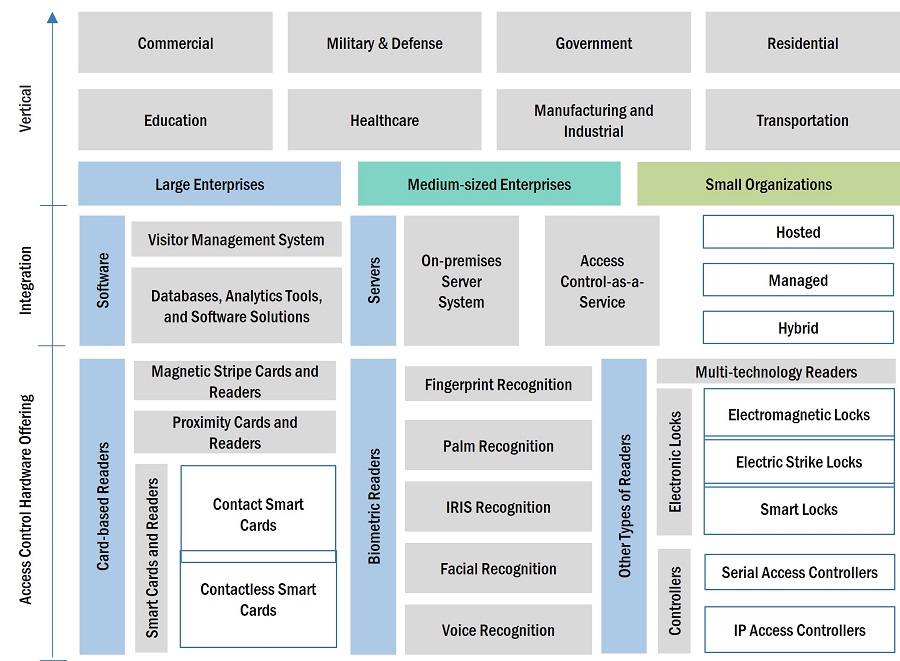
Access Control Market by Ecosystem

Software by offering to register highest CAGR during forecast period

The software market, by offering, is estimated to grow at the highest CAGR during the forecast period. The software enables configuring a security system with support for an unlimited number of workstations, cardholders, and users. It also provides various features and functions to restrict access to resources or information based on the user's identity and permissions. Access control software is commonly used in industries such as healthcare, finance, and government, where sensitive information needs to be protected from unauthorized access.

Based on access control as a service, managed Acaras is expected to witness highest growth during the forecast period

The managed Acaras market is expected to grow at the highest CAGR during the forecast period. The key feature of managed services is that all operational processes can be controlled off-site by a team of highly skilled personnel. It means the end-user can be guaranteed that their data is secure, and they can only focus on their most critical business functions.

Residential vertical to grow at highest CAGR during the forecast period.

The residential vertical is expected to witness the highest growth rate during the forecast period. The increasing theft and burglary rates globally have led to security becoming a major concern for individuals, residential complexes, and private residential buildings.

North America by region to witness highest growth rate.

North America is more advanced than other regions in terms of the implementation of access control systems. Companies in the US, Canada, and Mexico are making efforts to enhance their expertise and develop innovative access control systems and services. Honeywell International (US), AMAG Technologies, Inc. (US), Cross Match Technologies, Inc. (US), and 3M Cogent, Inc. (US) are the key players offering access control in this region.
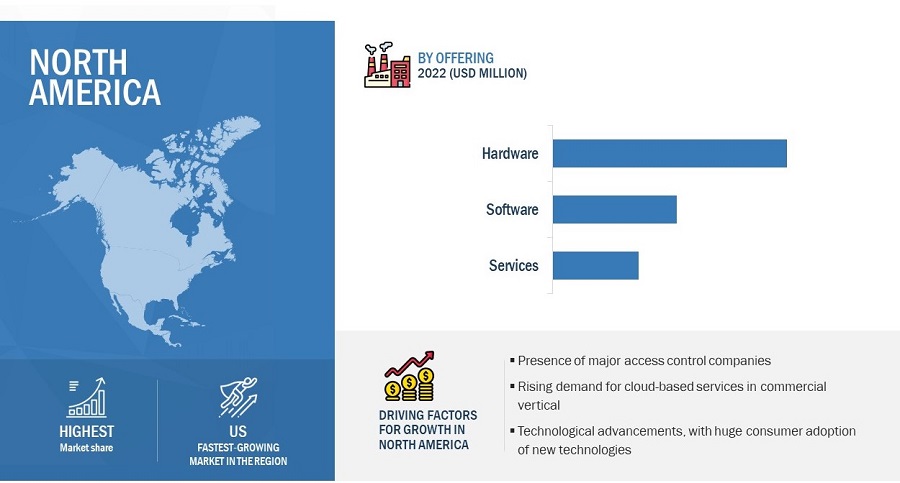
Access Control Market by Region

Access Control Market by Region

To know about the assumptions considered for the study, download the pdf brochure

Key Market Players

The access control companies such as dormakaba Holding (Switzerland), ASSA ABLOY (Sweden), Allegion plc (Ireland), Johnson Controls (Ireland), and Honeywell International (US). These players have adopted product launches/developments, contracts, collaborations, agreements, and acquisitions to grow in the market.

Get online access to the report on the World's First Market Intelligence Cloud

  • Easy to Download Historical Data & Forecast Numbers
  • Company Analysis Dashboard for high growth potential opportunities
  • Research Analyst Access for customization & queries
  • Competitor Analysis with Interactive dashboard
  • Latest News, Updates & Trend analysis
Request Sample

Scope of the Report

Report Metric

Details

Market size available for years

2019–2023

Base year considered

2022

Forecast period

2023–2028

Forecast units

Value (USD Million)

Segments covered

By Type, By Model, By Offering, Access Control as a Service, By Vertical and By Region

Geographies covered

Asia Pacific, Europe, North America and Rest of World

Companies covered

The key players operating in the access control market ASSA ABLOY (Sweden), Johnson Controls (Ireland), dormakaba Holding (Switzerland), Allegion plc (Ireland), Honeywell International (US), Identiv (US), Nedap N.V. (Netherlands), Suprema HQ (South Korea), Bosch Security Systems (US), and Thales Group (France)

Access Control Market Highlights

The study categorizes the access control market based on By Type, By Model, By Offering, Access Control as a Service, By Vertical and By Region

Segment

Subsegment

By Offering:

  • Hardware
  • Software
  • Services

By Vertical:

  • Commercial
  • Military & Defense
  • Government
  • Residential
  • Education
  • Healthcare
  • Manufacturing & Industrial
  • Transportation

By Type:

  • Physical Access Control
  • Logical Access Control
  • Mobile Access Control

By Acaras:

  • Hosted
  • Managed
  • Hybrid

By Model:

  • Discretionary Access Control
  • Mandatory Access Control
  • Role-based Access Control
  • Rule- based Access Control
  • Attribute- based Access Control
  • Risk adaptive Access Control
  • Identity- based Access Control

By Region:

  • North America
  • Europe
  • Asia Pacific
  • RoW

Recent Developments

  • In February 2023, Johnson Controls (Ireland) and Alcatraz AI (US) collaborated for an intelligent frictionless access control solution. With this collaboration, the integration of the Johnson Controls CURE 9000 solution and Rock from Alcatraz AI will provide powerful AI-enabled facial authentication technology for fast and accurate access control.
  • In February 2023, Identic (US) partnered with Trace-ID (Spain), a UHF RFID technology and solutions provider. The partnership expanded Ident’s manufacturing footprint, enabling the company to add to its extensive product portfolio, further strengthening its position as a global leader in RFID technology.
  • In January 2023, Abloy Oy, a part of ASSA ABLOY (Sweden), introduced ABLOY Key Deposit for Keyless Access. It enables keyless access to properties with a smartphone via a Bluetooth Low Energy (BLE) connection. With this device, property managers can grant different user groups access to properties via the users’ mobile phones—without needing key logistics—and access control.

Frequently Asked Questions (FAQ):

To speak to our analyst for a discussion on the above findings, click Speak to Analyst

TABLE OF CONTENTS
 
1 INTRODUCTION (Page No. - 30)
    1.1 STUDY OBJECTIVES 
    1.2 MARKET DEFINITION 
           1.2.1 INCLUSIONS AND EXCLUSIONS
    1.3 STUDY SCOPE 
           FIGURE 1 ACCESS CONTROL MARKET: SEGMENTATION
           1.3.1 GEOGRAPHIC SCOPE
           1.3.2 YEARS CONSIDERED
    1.4 CURRENCY CONSIDERED 
    1.5 VOLUME UNIT CONSIDERED 
    1.6 LIMITATIONS 
    1.7 STAKEHOLDERS 
    1.8 SUMMARY OF CHANGES 
 
2 RESEARCH METHODOLOGY (Page No. - 36)
    2.1 RESEARCH DATA 
           FIGURE 2 ACCESS CONTROL MARKET: RESEARCH DESIGN
           2.1.1 SECONDARY & PRIMARY RESEARCH
           2.1.2 SECONDARY DATA
                    2.1.2.1 Major secondary sources
                    2.1.2.2 Secondary sources
           2.1.3 PRIMARY DATA
                    2.1.3.1 Breakdown of primaries
                    2.1.3.2 Key data from primary sources
                    2.1.3.3 Key industry insights
    2.2 MARKET SIZE ESTIMATION 
           FIGURE 3 PROCESS FLOW OF MARKET SIZE ESTIMATION
           2.2.1 BOTTOM-UP APPROACH
                    2.2.1.1 Estimating market size by bottom-up approach (demand side)
                               FIGURE 4 MARKET SIZE ESTIMATION METHODOLOGY: BOTTOM-UP APPROACH
           2.2.2 TOP-DOWN APPROACH
                    2.2.2.1 Estimating market size by top-down approach (supply side)
                               FIGURE 5 MARKET SIZE ESTIMATION METHODOLOGY: TOP-DOWN APPROACH
                               FIGURE 6 MARKET SIZE ESTIMATION METHODOLOGY: TOP-DOWN APPROACH (SUPPLY SIDE)—REVENUE GENERATED FROM ACCESS CONTROL SOLUTIONS AND SERVICES
    2.3 DATA TRIANGULATION 
           FIGURE 7 DATA TRIANGULATION
    2.4 RESEARCH ASSUMPTIONS 
           2.4.1 ASSUMPTION FOR RESEARCH STUDY
           2.4.2 LIMITATIONS
    2.5 RISK ASSESSMENT 
    2.6 PARAMETERS CONSIDERED TO ANALYZE IMPACT OF RECESSION ON ACCESS CONTROL MARKET 
 
3 EXECUTIVE SUMMARY (Page No. - 49)
    3.1 ACCESS CONTROL MARKET: RECESSION IMPACT 
           FIGURE 8 RECESSION IMPACT: GDP GROWTH PROJECTION UNTIL 2023 FOR MAJOR ECONOMIES
           FIGURE 9 RECESSION IMPACT ON ACCESS CONTROL MARKET, 2019–2028 (USD MILLION)
           FIGURE 10 CARD-BASED READERS TO HOLD LARGEST MARKET SHARE AMONG ALL HARDWARE COMPONENTS IN 2028
           FIGURE 11 ACCESS CONTROL AS A SERVICE MARKET, BY TYPE, 2023 VS. 2028
           FIGURE 12 COMMERCIAL VERTICAL TO CONTINUE TO HOLD LARGEST MARKET SHARE IN ACCESS CONTROL MARKET DURING FORECAST PERIOD
           FIGURE 13 ACCESS CONTROL MARKET IN ASIA PACIFIC TO EXHIBIT HIGHEST GROWTH RATE DURING FORECAST PERIOD
 
4 PREMIUM INSIGHTS (Page No. - 54)
    4.1 ATTRACTIVE OPPORTUNITIES FOR PLAYERS IN ACCESS CONTROL MARKET 
           FIGURE 14 INCREASING AWARENESS CONCERNING HOME SECURITY AND GROWING IMPLEMENTATION OF MOBILE-BASED ACCESS CONTROL TO BOOST MARKET GROWTH
    4.2 ACCESS CONTROL MARKET, BY OFFERING 
           FIGURE 15 SOFTWARE TO REGISTER HIGHEST CAGR FROM 2023 TO 2028
    4.3 ACCESS CONTROL MARKET, BY HARDWARE COMPONENT 
           FIGURE 16 CARD-BASED READERS TO HOLD LARGEST SHARE OF ACCESS CONTROL MARKET, BY HARDWARE COMPONENT, IN 2028
    4.4 ACCESS CONTROL AS A SERVICE MARKET 
           FIGURE 17 HOSTED ACCESS CONTROL AS A SERVICE TO HOLD LARGEST SHARE OF ACCESS CONTROL AS A SERVICE MARKET IN 2028
    4.5 ACCESS CONTROL MARKET IN NORTH AMERICA, BY VERTICAL AND COUNTRY 
           FIGURE 18 COMMERCIAL VERTICAL AND US WERE LARGEST SHAREHOLDERS IN NORTH AMERICAN ACCESS CONTROL MARKET IN 2022
    4.6 ACCESS CONTROL MARKET, BY COUNTRY 
           FIGURE 19 ACCESS CONTROL MARKET TO REGISTER HIGHEST CAGR IN CHINA DURING FORECAST PERIOD
 
5 MARKET OVERVIEW (Page No. - 57)
    5.1 INTRODUCTION 
    5.2 MARKET DYNAMICS 
           FIGURE 20 DRIVERS, RESTRAINTS, OPPORTUNITIES, AND CHALLENGES: ACCESS CONTROL MARKET
           5.2.1 DRIVERS
                    FIGURE 21 ANALYSIS OF IMPACT OF DRIVERS ON ACCESS CONTROL MARKET
                    5.2.1.1 Growing awareness concerning home security
                    5.2.1.2 Rising number of smart infrastructure and smart city projects
                    5.2.1.3 Ongoing technological advancements and increasing deployment of wireless security systems
                    5.2.1.4 Increasing adoption of IoT-based security systems with cloud computing platforms
           5.2.2 RESTRAINTS
                    FIGURE 22 ANALYSIS OF IMPACT OF RESTRAINTS ON ACCESS CONTROL MARKET
                    5.2.2.1 High installation, maintenance, and ownership costs of access control systems
                    5.2.2.2 Security and privacy concerns related to unauthorized access and data breaches in access control environment
           5.2.3 OPPORTUNITIES
                    FIGURE 23 ANALYSIS OF IMPACT OF OPPORTUNITIES ON ACCESS CONTROL MARKET
                    5.2.3.1 Rapid urbanization in emerging countries
                    5.2.3.2 Adoption of ACaaS as cost-effective and flexible solution
                    5.2.3.3 Growing implementation of mobile-based access control
           5.2.4 CHALLENGES
                    FIGURE 24 ANALYSIS OF IMPACT OF CHALLENGES ON ACCESS CONTROL MARKET
                    5.2.4.1 Low awareness among users about availability and benefits of advanced security solutions
                    5.2.4.2 Availability of free access control services
    5.3 VALUE CHAIN ANALYSIS 
           FIGURE 25 VALUE CHAIN ANALYSIS: ACCESS CONTROL MARKET
    5.4 ACCESS CONTROL ECOSYSTEM 
           FIGURE 26 ACCESS CONTROL ECOSYSTEM
    5.5 REVENUE SHIFT & NEW REVENUE POCKETS FOR ACCESS CONTROL MARKET 
           FIGURE 27 REVENUE SHIFT IN ACCESS CONTROL MARKET
    5.6 AVERAGE SELLING PRICE ANALYSIS 
           TABLE 1 AVERAGE SELLING PRICE OF CARD-BASED READERS, 2023
           TABLE 2 AVERAGE SELLING PRICE OF BIOMETRIC READERS, 2023
           TABLE 3 AVERAGE SELLING PRICE OF ELECTRONIC LOCKS, 2023
           5.6.1 AVERAGE SELLING PRICE OF ACCESS CONTROL AS A SERVICE PRODUCTS/SOLUTIONS, BY KEY PLAYER
                    FIGURE 28 AVERAGE SELLING PRICE OF ACCESS CONTROL AS A SERVICE PRODUCTS/SOLUTIONS, BY KEY PLAYER
                    TABLE 4 AVERAGE SELLING PRICE OF ACCESS CONTROL AS A SERVICE, BY KEY PLAYER (USD/MONTH)
           5.6.2 AVERAGE SELLING PRICE TREND
                    TABLE 5 AVERAGE SELLING PRICE: ACCESS CONTROL AS A SERVICE MARKET, BY SERVICE TYPE (USD/MONTH)
                    FIGURE 29 AVERAGE SELLING PRICE: ACCESS CONTROL AS A SERVICE MARKET, BY SERVICE TYPE (USD/MONTH)
    5.7 TECHNOLOGY TRENDS 
           5.7.1 THERMAL IMAGING CAMERAS (THERMAL CAMERA-BASED ACCESS CONTROL)
           5.7.2 FACIAL RECOGNITION CAMERA TECHNOLOGY (FACE RECOGNITION CAMERAS)
           5.7.3 VIDEO ANALYTICS CAMERAS
           5.7.4 CLOUD-BASED CAMERAS IN ACCESS CONTROL SYSTEMS
           5.7.5 CAMERAS IN LOGICAL ACCESS CONTROL
           5.7.6 INTEGRATION OF INTERNET OF THINGS
           5.7.7 EMERGENCE OF CONTACTLESS BIOMETRICS
           5.7.8 ADJACENT TECHNOLOGY
                    5.7.8.1 Comprehensive and proactive security systems
    5.8 PORTER’S FIVE FORCES ANALYSIS 
           TABLE 6 IMPACT OF EACH FORCE ON ACCESS CONTROL MARKET
           FIGURE 30 PORTER’S FIVE FORCES ANALYSIS
           5.8.1 THREAT OF NEW ENTRANTS
           5.8.2 THREAT OF SUBSTITUTES
           5.8.3 BARGAINING POWER OF SUPPLIERS
           5.8.4 BARGAINING POWER OF BUYERS
           5.8.5 INTENSITY OF COMPETITIVE RIVALRY
    5.9 KEY STAKEHOLDERS AND BUYING PROCESS AND/OR BUYING CRITERIA 
           5.9.1 KEY STAKEHOLDERS IN BUYING PROCESS
                    FIGURE 31 INFLUENCE OF STAKEHOLDERS ON BUYING PROCESS FOR TOP THREE VERTICALS
                    TABLE 7 INFLUENCE OF STAKEHOLDERS ON BUYING PROCESS FOR TOP THREE VERTICALS (%)
           5.9.2 BUYING CRITERIA
                    FIGURE 32 KEY BUYING CRITERIA FOR TOP THREE VERTICALS
                    TABLE 8 KEY BUYING CRITERIA FOR TOP THREE VERTICALS
    5.10 CASE STUDY ANALYSIS 
           5.10.1 SYMMETRY-ENABLED CITY OF HOBBS TO TAP INTO VIDEO SECURITY SYSTEMS IN SCHOOLS
           5.10.2 MONROE COUNTY USED MAXPRO CLOUD FOR BENEFIT OF ITS COMMUNITY WITHOUT COMPROMISING SAFETY
           5.10.3 BUSINESS OWNER CONTROLS TWO FLOORS, STAFF OF 80, AND MULTIPLE VENDORS VIA CLOUD-BASED SECURITY SOLUTION
    5.11 TRADE ANALYSIS 
           5.11.1 IMPORT SCENARIO OF MAGNETIC OR OPTICAL READERS
                    TABLE 9 IMPORT DATA OF HS CODE 847190, BY COUNTRY, 2017–2021 (USD MILLION)
           5.11.2 EXPORT SCENARIO OF MAGNETIC OR OPTICAL READERS
                    TABLE 10 EXPORT DATA OF HS CODE 847190, BY COUNTRY, 2017–2021 (USD MILLION)
    5.12 PATENT ANALYSIS 
           TABLE 11 PATENTS PERTAINING TO ACCESS CONTROL MARKET, 2022–2020
    5.13 KEY CONFERENCES AND EVENTS, 2023–2024 
           TABLE 12 ACCESS CONTROL MARKET: DETAILED LIST OF CONFERENCES AND EVENTS
    5.14 TARIFF ANALYSIS 
           TABLE 13 MFN TARIFF FOR HS CODE 854370 - COMPLIANT PRODUCTS EXPORTED BY US
           TABLE 14 MFN TARIFF FOR HS CODE 854370 - COMPLIANT PRODUCTS EXPORTED BY CHINA
           TABLE 15 MFN TARIFF FOR HS CODE 854370 - COMPLIANT PRODUCTS EXPORTED BY INDIA
    5.15 STANDARDS AND REGULATORY LANDSCAPE 
           5.15.1 REGULATORY BODIES, GOVERNMENT AGENCIES, AND OTHER ORGANIZATIONS
                    TABLE 16 NORTH AMERICA: REGULATORY BODIES, GOVERNMENT AGENCIES, AND OTHER ORGANIZATIONS
                    TABLE 17 EUROPE: REGULATORY BODIES, GOVERNMENT AGENCIES, AND OTHER ORGANIZATIONS
                    TABLE 18 ASIA PACIFIC: REGULATORY BODIES, GOVERNMENT AGENCIES, AND OTHER ORGANIZATIONS
                    TABLE 19 ROW: REGULATORY BODIES, GOVERNMENT AGENCIES, AND OTHER ORGANIZATIONS
           5.15.2 GOVERNMENT REGULATIONS
           5.15.3 REGULATORY STANDARDS
           5.15.4 GOVERNMENT REGULATIONS
                    5.15.4.1 Canada
                    5.15.4.2 Europe
                    5.15.4.3 India
 
6 TYPES OF ACCESS CONTROL SYSTEMS (Page No. - 90)
    6.1 INTRODUCTION 
    6.2 PHYSICAL ACCESS CONTROL SYSTEMS 
    6.3 LOGICAL ACCESS CONTROL SYSTEMS 
    6.4 MOBILE ACCESS CONTROL SYSTEMS 
 
7 ACCESS CONTROL MODELS (Page No. - 92)
    7.1 INTRODUCTION 
    7.2 DISCRETIONARY ACCESS CONTROL 
    7.3 MANDATORY ACCESS CONTROL 
    7.4 ROLE-BASED ACCESS CONTROL 
    7.5 RULE-BASED ACCESS CONTROL 
    7.6 ATTRIBUTE-BASED ACCESS CONTROL 
    7.7 RISK-ADAPTIVE ACCESS CONTROL 
    7.8 IDENTITY-BASED ACCESS CONTROL 
 
8 ACCESS CONTROL MARKET, BY OFFERING (Page No. - 95)
    8.1 INTRODUCTION 
           FIGURE 33 ACCESS CONTROL SOFTWARE MARKET TO GROW AT HIGHEST CAGR FROM 2023 TO 2028
           TABLE 20 ACCESS CONTROL MARKET, BY OFFERING, 2019–2022 (USD MILLION)
           TABLE 21 ACCESS CONTROL MARKET, BY OFFERING, 2023–2028 (USD MILLION)
    8.2 HARDWARE 
           TABLE 22 HARDWARE: ACCESS CONTROL MARKET, BY TYPE, 2019–2022 (USD MILLION)
           TABLE 23 HARDWARE: ACCESS CONTROL MARKET, BY TYPE, 2023–2028 (USD MILLION)
           TABLE 24 HARDWARE: ACCESS CONTROL MARKET, BY REGION, 2019–2022 (USD MILLION)
           TABLE 25 HARDWARE: ACCESS CONTROL MARKET, BY REGION, 2023–2028 (USD MILLION)
           FIGURE 34 CARD-BASED READERS TO CONTINUE TO LEAD ACCESS CONTROL MARKET FOR HARDWARE DURING FORECAST PERIOD
           8.2.1 CARD-BASED READERS
                    8.2.1.1 Growing need for card-based readers for identification in organizations to fuel market
                               TABLE 26 CARD-BASED READERS: ACCESS CONTROL MARKET, BY TYPE, 2019–2022 (USD MILLION)
                               TABLE 27 CARD-BASED READERS: ACCESS CONTROL MARKET, BY TYPE, 2023–2028 (USD MILLION)
                               TABLE 28 CARD-BASED READERS: ACCESS CONTROL MARKET, BY TYPE, 2019–2022 (THOUSAND UNITS)
                               TABLE 29 CARD-BASED READERS: ACCESS CONTROL MARKET, BY TYPE, 2023–2028 (THOUSAND UNITS)
                               TABLE 30 CARD-BASED READERS: ACCESS CONTROL MARKET, BY REGION, 2019–2022 (USD MILLION)
                               TABLE 31 CARD-BASED READERS: ACCESS CONTROL MARKET, BY REGION, 2023–2028 (USD MILLION)
                    8.2.1.2 Magnetic stripe readers
                    8.2.1.3 Proximity card readers
                    8.2.1.4 Smart card readers
                               TABLE 32 SMART CARD READERS: ACCESS CONTROL MARKET, BY TYPE, 2019–2022 (USD MILLION)
                               TABLE 33 SMART CARD READERS: ACCESS CONTROL MARKET, BY TYPE, 2023–2028 (USD MILLION)
                               8.2.1.4.1 Contact smart cards
                               8.2.1.4.2 Contactless smart cards
           8.2.2 BIOMETRIC READERS
                    8.2.2.1 Increasing adoption of biometrics readers for authentication to drive market
                               FIGURE 35 FINGERPRINT RECOGNITION TO CAPTURE LARGEST MARKET SIZE DURING FORECAST PERIOD
                               TABLE 34 BIOMETRIC READERS: ACCESS CONTROL MARKET, BY TYPE, 2019–2022 (USD MILLION)
                               TABLE 35 BIOMETRIC READERS: ACCESS CONTROL MARKET, BY TYPE, 2023–2028 (USD MILLION)
                               TABLE 36 BIOMETRIC READERS: ACCESS CONTROL MARKET, BY TYPE, 2019–2022 (THOUSAND UNITS)
                               TABLE 37 BIOMETRIC READERS: ACCESS CONTROL MARKET, BY TYPE, 2023–2028 (THOUSAND UNITS)
                               TABLE 38 BIOMETRIC READERS: ACCESS CONTROL MARKET, BY REGION, 2019–2022 (USD MILLION)
                               TABLE 39 BIOMETRIC READERS: ACCESS CONTROL MARKET, BY REGION, 2023–2028 (USD MILLION)
                    8.2.2.2 Fingerprint recognition
                    8.2.2.3 Palm recognition
                    8.2.2.4 Iris recognition
                    8.2.2.5 Facial recognition
                    8.2.2.6 Voice recognition
           8.2.3 MULTI-TECHNOLOGY READERS
                    8.2.3.1 Intensifying demand for multi-factor authentication to boost demand for multi-technology readers
                               TABLE 40 MULTI-TECHNOLOGY READERS: ACCESS CONTROL MARKET, BY REGION, 2019–2022 (USD MILLION)
                               TABLE 41 MULTI-TECHNOLOGY READERS: ACCESS CONTROL MARKET, BY REGION, 2023–2028 (USD MILLION)
           8.2.4 ELECTRONIC LOCKS
                    8.2.4.1 Rising adoption of mobile connectivity with locks for high security to propel smart lock market
                               FIGURE 36 ACCESS CONTROL MARKET FOR SMART LOCKS TO GROW AT HIGHEST CAGR DURING FORECAST PERIOD
                               TABLE 42 ELECTRONIC LOCKS: ACCESS CONTROL MARKET, BY TYPE, 2019–2022 (USD MILLION)
                               TABLE 43 ELECTRONIC LOCKS: ACCESS CONTROL MARKET, BY TYPE, 2023–2028 (USD MILLION)
                               TABLE 44 ELECTRONIC LOCKS: ACCESS CONTROL MARKET, BY TYPE, 2019–2022 (THOUSAND UNITS)
                               TABLE 45 ELECTRONIC LOCKS: ACCESS CONTROL MARKET, BY TYPE, 2023–2028 (THOUSAND UNITS)
                               TABLE 46 ELECTRONIC LOCKS: ACCESS CONTROL MARKET, BY REGION, 2019–2022 (USD MILLION)
                               TABLE 47 ELECTRONIC LOCKS: ACCESS CONTROL MARKET, BY REGION, 2023–2028 (USD MILLION)
                    8.2.4.2 Electromagnetic locks
                    8.2.4.3 Electric strike locks
                    8.2.4.4 Smart locks
           8.2.5 ACCESS CONTROLLERS
                    8.2.5.1 Access controllers form backbone of access control market
                               TABLE 48 CONTROLLERS: ACCESS CONTROL MARKET, BY TYPE, 2019–2022 (USD MILLION)
                               TABLE 49 CONTROLLERS: ACCESS CONTROL MARKET, BY TYPE, 2023–2028 (USD MILLION)
                               TABLE 50 CONTROLLERS: ACCESS CONTROL MARKET, BY REGION, 2019–2022 (USD MILLION)
                               TABLE 51 CONTROLLERS: ACCESS CONTROL MARKET, BY REGION, 2023–2028 (USD MILLION)
                    8.2.5.2 Serial access controllers
                    8.2.5.3 IP access controllers
           8.2.6 OTHERS
                    TABLE 52 OTHERS: ACCESS CONTROL MARKET, BY REGION, 2019–2022 (USD MILLION)
                    TABLE 53 OTHERS: ACCESS CONTROL MARKET, BY REGION, 2023–2028 (USD MILLION)
    8.3 SOFTWARE 
           8.3.1 RISING IMPLEMENTATION OF DATA ANALYTICS FOR IDENTITY MANAGEMENT T0 PROPEL MARKET
                    TABLE 54 SOFTWARE: ACCESS CONTROL MARKET, BY TYPE, 2019–2022 (USD MILLION)
                    TABLE 55 SOFTWARE: ACCESS CONTROL MARKET, BY TYPE, 2023–2028 (USD MILLION)
                    TABLE 56 SOFTWARE: ACCESS CONTROL MARKET, BY REGION, 2019–2022 (USD MILLION)
                    TABLE 57 SOFTWARE: ACCESS CONTROL MARKET, BY REGION, 2023–2028 (USD MILLION)
           8.3.2 VISITOR MANAGEMENT SYSTEMS
           8.3.3 DATABASE & SOFTWARE TOOLS
    8.4 SERVICES 
           8.4.1 INCREASING DEMAND FOR SECURITY SOLUTIONS TO DRIVE MARKET FOR INSTALLATION & INTEGRATION SERVICES
                    FIGURE 37 SUPPORT AND MAINTENANCE SERVICES TO WITNESS HIGHER CAGR DURING FORECAST PERIOD
                    TABLE 58 SERVICES: ACCESS CONTROL MARKET, BY TYPE, 2019–2022 (USD MILLION)
                    TABLE 59 SERVICES: ACCESS CONTROL MARKET, BY TYPE, 2023–2028 (USD MILLION)
                    TABLE 60 SERVICES: ACCESS CONTROL MARKET, BY REGION, 2019–2022 (USD MILLION)
                    TABLE 61 SERVICES: ACCESS CONTROL MARKET, BY REGION, 2023–2028 (USD MILLION)
           8.4.2 INSTALLATION & INTEGRATION
                    TABLE 62 INSTALLATION & INTEGRATION SERVICES: ACCESS CONTROL MARKET, BY REGION, 2019–2022 (USD MILLION)
                    TABLE 63 INSTALLATION & INTEGRATION SERVICES: ACCESS CONTROL, BY REGION, 2023–2028 (USD MILLION)
           8.4.3 SUPPORT & MAINTENANCE SERVICES
                    TABLE 64 SUPPORT & MAINTENANCE SERVICES: ACCESS CONTROL MARKET, BY REGION, 2019–2022 (USD MILLION)
                    TABLE 65 SUPPORT & MAINTENANCE SERVICES: ACCESS CONTROL MARKET, BY REGION, 2023–2028 (USD MILLION)
 
9 ACCESS CONTROL AS A SERVICE MARKET (Page No. - 119)
    9.1 INTRODUCTION 
    9.2 ACCESS CONTROL AS A SERVICE 
           FIGURE 38 ACCESS CONTROL AS A SERVICE MARKET, BY TYPE
           FIGURE 39 MARKET FOR MANAGED ACAAS TO GROW AT HIGHEST CAGR DURING FORECAST PERIOD
           TABLE 66 ACCESS CONTROL AS A SERVICE MARKET, BY TYPE, 2019–2022 (USD MILLION)
           TABLE 67 ACCESS CONTROL AS A SERVICE MARKET, BY TYPE, 2023–2028 (USD MILLION)
           TABLE 68 ACCESS CONTROL AS A SERVICE MARKET, BY VERTICAL, 2019–2022 (USD MILLION)
           TABLE 69 ACCESS CONTROL AS A SERVICE MARKET, BY VERTICAL, 2023–2028 (USD MILLION)
           TABLE 70 ACCESS CONTROL AS A SERVICE MARKET, BY REGION, 2019–2022 (USD MILLION)
           TABLE 71 ACCESS CONTROL AS A SERVICE MARKET, BY REGION, 2023–2028 (USD MILLION)
    9.3 HOSTED ACAAS 
           9.3.1 QUICK, EASY, AND EFFICIENT ACCESS CONTROL OFFERED BY HOSTED ACAAS TO DRIVE MARKET
                    TABLE 72 HOSTED ACCESS CONTROL AS A SERVICE MARKET, BY REGION, 2019–2022 (USD MILLION)
                    TABLE 73 HOSTED ACCESS CONTROL AS A SERVICE MARKET, BY REGION, 2023–2028 (USD MILLION)
    9.4 MANAGED ACAAS 
           9.4.1 INCREASED ACCEPTANCE OF CLOUD-BASED SERVICES TO CREATE LUCRATIVE OPPORTUNITIES FOR MANAGED ACAAS MARKET PLAYERS
                    TABLE 74 MANAGED ACCESS CONTROL AS A SERVICE MARKET, BY REGION, 2019–2022 (USD MILLION)
                    TABLE 75 MANAGED ACCESS CONTROL AS A SERVICE MARKET, BY REGION, 2023–2028 (USD MILLION)
    9.5 HYBRID ACAAS 
           9.5.1 FLEXIBILITY AND SCALABILITY OFFERED BY HYBRID ACAAS TO PROPEL MARKET
                    TABLE 76 HYBRID ACCESS CONTROL AS A SERVICE MARKET, BY REGION, 2019–2022 (USD MILLION)
                    TABLE 77 HYBRID ACCESS CONTROL AS A SERVICE MARKET, BY REGION, 2023–2028 (USD MILLION)
 
10 ACCESS CONTROL MARKET, BY VERTICAL (Page No. - 128)
     10.1 INTRODUCTION 
             FIGURE 40 ACCESS CONTROL MARKET, BY VERTICAL
             FIGURE 41 COMMERCIAL VERTICAL TO HOLD LARGEST MARKET SHARE IN ACCESS CONTROL MARKET DURING FORECAST PERIOD
             TABLE 78 ACCESS CONTROL MARKET, BY VERTICAL, 2019–2022 (USD MILLION)
             TABLE 79 ACCESS CONTROL MARKET, BY VERTICAL, 2023–2028 (USD MILLION)
     10.2 COMMERCIAL 
             FIGURE 42 ENTERPRISES & DATA CENTERS TO HOLD LARGEST SIZE OF ACCESS CONTROL MARKET FOR COMMERCIAL VERTICAL IN 2023
             10.2.1 ENTERPRISES & DATA CENTERS
                        10.2.1.1 Increasing usage of security smart cards and biometrics to boost market
             10.2.2 BANKS & FINANCIAL BUILDINGS
                        10.2.2.1 Growing need for high security and surveillance in banking sector to propel market
             10.2.3 HOTELS, STADIUMS, & AMUSEMENT PARKS
                        10.2.3.1 Rising usage of access control solutions by hospitality sector to drive market
             10.2.4 RETAIL STORES & MALLS
                        10.2.4.1 Increasing need to secure assets and personnel to boost deployment of access control solutions in retail sector
                                     TABLE 80 COMMERCIAL: ACCESS CONTROL MARKET, BY REGION, 2019–2022 (USD MILLION)
                                     TABLE 81 COMMERCIAL: ACCESS CONTROL MARKET, BY REGION, 2023–2028 (USD MILLION)
                                     TABLE 82 COMMERCIAL: ACCESS CONTROL MARKET, BY TYPE, 2019–2022 (USD MILLION)
                                     TABLE 83 COMMERCIAL: ACCESS CONTROL MARKET, BY TYPE, 2023–2028 (USD MILLION)
     10.3 MILITARY & DEFENSE 
             10.3.1 GROWING TREND OF ROLE-BASED ACCESS CONTROL TO FUEL MARKET
                        TABLE 84 MILITARY & DEFENSE: ACCESS CONTROL MARKET, BY REGION, 2019–2022 (USD MILLION)
                        TABLE 85 MILITARY & DEFENSE: ACCESS CONTROL MARKET, BY REGION, 2023–2028 (USD MILLION)
     10.4 GOVERNMENT 
             10.4.1 RISING DEMAND FOR BIOMETRICS IN GOVERNMENT VERTICAL TO ACCELERATE MARKET
                        TABLE 86 GOVERNMENT: ACCESS CONTROL MARKET, BY REGION, 2019–2022 (USD MILLION)
                        TABLE 87 GOVERNMENT: ACCESS CONTROL MARKET, BY REGION, 2023–2028 (USD MILLION)
     10.5 RESIDENTIAL 
             10.5.1 INCREASING DEMAND FOR HOME SECURITY SOLUTIONS TO DRIVE MARKET
                        FIGURE 43 ACCESS CONTROL MARKET IN ASIA PACIFIC FOR RESIDENTIAL VERTICAL TO REGISTER HIGHEST CAGR DURING FORECAST PERIOD
                        TABLE 88 RESIDENTIAL: ACCESS CONTROL MARKET, BY REGION, 2019–2022 (USD MILLION)
                        TABLE 89 RESIDENTIAL: ACCESS CONTROL MARKET, BY REGION, 2023–2028 (USD MILLION)
     10.6 EDUCATION 
             10.6.1 INCREASING NEED TO SECURE SAFETY OF STUDENTS AND ASSETS TO BOOST MARKET
                        TABLE 90 EDUCATION: ACCESS CONTROL MARKET, BY REGION, 2019–2022 (USD MILLION)
                        TABLE 91 EDUCATION: ACCESS CONTROL MARKET, BY REGION, 2023–2028 (USD MILLION)
     10.7 HEALTHCARE 
             10.7.1 RISING ADOPTION OF ACCESS CONTROL SOLUTIONS IN HEALTHCARE FACILITIES TO ENSURE PATIENT PRIVACY
                        TABLE 92 HEALTHCARE: ACCESS CONTROL MARKET, BY REGION, 2019–2022 (USD MILLION)
                        TABLE 93 HEALTHCARE: ACCESS CONTROL MARKET, BY REGION, 2023–2028 (USD MILLION)
     10.8 MANUFACTURING AND INDUSTRIAL 
             10.8.1 GROWING NEED FOR SAFETY IN MANUFACTURING & INDUSTRIAL VERTICAL TO FUEL MARKET
                        TABLE 94 MANUFACTURING & INDUSTRIAL: ACCESS CONTROL MARKET, BY REGION, 2019–2022 (USD MILLION)
                        TABLE 95 MANUFACTURING & INDUSTRIAL: ACCESS CONTROL MARKET, BY REGION, 2023–2028 (USD MILLION)
     10.9 TRANSPORTATION 
             10.9.1 INCREASING DEMAND FOR PASSENGER SAFETY IN TRANSPORTATION VERTICAL TO ENHANCE MARKET GROWTH
                        TABLE 96 TRANSPORTATION: ACCESS CONTROL MARKET, BY REGION, 2019–2022 (USD MILLION)
                        TABLE 97 TRANSPORTATION: ACCESS CONTROL MARKET, BY REGION, 2023–2028 (USD MILLION)
 
11 ACCESS CONTROL MARKET, BY REGION (Page No. - 146)
     11.1 INTRODUCTION 
             FIGURE 44 ASIA PACIFIC TO WITNESS HIGHEST CAGR IN ACCESS CONTROL MARKET DURING FORECAST PERIOD
             TABLE 98 ACCESS CONTROL MARKET, BY REGION, 2019–2022 (USD MILLION)
             TABLE 99 ACCESS CONTROL MARKET, BY REGION, 2023–2028 (USD MILLION)
     11.2 NORTH AMERICA 
             FIGURE 45 SNAPSHOT: ACCESS CONTROL MARKET IN NORTH AMERICA
             TABLE 100 NORTH AMERICA: ACCESS CONTROL MARKET, BY OFFERING, 2019–2022 (USD MILLION)
             TABLE 101 NORTH AMERICA: ACCESS CONTROL MARKET, BY OFFERING, 2023–2028 (USD MILLION)
             TABLE 102 NORTH AMERICA: ACCESS CONTROL MARKET, BY HARDWARE TYPE, 2019–2022 (USD MILLION)
             TABLE 103 NORTH AMERICA: ACCESS CONTROL MARKET, BY HARDWARE TYPE, 2023–2028 (USD MILLION)
             TABLE 104 NORTH AMERICA: ACCESS CONTROL MARKET, BY SERVICE TYPE, 2019–2022 (USD MILLION)
             TABLE 105 NORTH AMERICA: ACCESS CONTROL MARKET, BY SERVICE TYPE, 2023–2028 (USD MILLION)
             TABLE 106 NORTH AMERICA: ACCESS CONTROL MARKET, BY VERTICAL, 2019–2022 (USD MILLION)
             TABLE 107 NORTH AMERICA: ACCESS CONTROL MARKET, BY VERTICAL, 2023–2028 (USD MILLION)
             TABLE 108 NORTH AMERICA: ACCESS CONTROL AS A SERVICE MARKET, BY TYPE, 2019–2022 (USD MILLION)
             TABLE 109 NORTH AMERICA: ACCESS CONTROL AS A SERVICE MARKET, BY TYPE, 2023–2028 (USD MILLION)
             TABLE 110 NORTH AMERICA: ACCESS CONTROL MARKET, BY COUNTRY, 2019–2022 (USD MILLION)
             TABLE 111 NORTH AMERICA: ACCESS CONTROL MARKET, BY COUNTRY, 2023–2028 (USD MILLION)
             11.2.1 US
                        11.2.1.1 Growing need for security and maintenance to drive market
                                     TABLE 112 US: ACCESS CONTROL MARKET, BY VERTICAL, 2019–2022 (USD MILLION)
                                     TABLE 113 US: ACCESS CONTROL MARKET, BY VERTICAL, 2023–2028 (USD MILLION)
                                     TABLE 114 US: ACCESS CONTROL MARKET, BY HARDWARE TYPE, 2019–2022 (USD MILLION)
                                     TABLE 115 US: ACCESS CONTROL MARKET, BY HARDWARE TYPE, 2023–2028 (USD MILLION)
             11.2.2 CANADA
                        11.2.2.1 Presence of several private military and security companies to support market growth
                                     TABLE 116 CANADA: ACCESS CONTROL MARKET, BY VERTICAL, 2019–2022 (USD MILLION)
                                     TABLE 117 CANADA: ACCESS CONTROL MARKET, BY VERTICAL, 2023–2028 (USD MILLION)
                                     TABLE 118 CANADA: ACCESS CONTROL MARKET, BY HARDWARE TYPE, 2019–2022 (USD MILLION)
                                     TABLE 119 CANADA: ACCESS CONTROL MARKET, BY HARDWARE TYPE, 2023–2028 (USD MILLION)
             11.2.3 MEXICO
                        11.2.3.1 Increasing focus of government on tightening security measures through integrated security measures to boost market
                                     TABLE 120 MEXICO: ACCESS CONTROL MARKET, BY VERTICAL, 2019–2022 (USD MILLION)
                                     TABLE 121 MEXICO: ACCESS CONTROL MARKET, BY VERTICAL, 2023–2028 (USD MILLION)
                                     TABLE 122 MEXICO: ACCESS CONTROL MARKET, BY HARDWARE TYPE, 2019–2022 (USD MILLION)
                                     TABLE 123 MEXICO: ACCESS CONTROL MARKET, BY HARDWARE TYPE, 2023–2028 (USD MILLION)
     11.3 EUROPE 
             FIGURE 46 SNAPSHOT: ACCESS CONTROL MARKET IN EUROPE
             TABLE 124 EUROPE: ACCESS CONTROL MARKET, BY OFFERING, 2019–2022 (USD MILLION)
             TABLE 125 EUROPE: ACCESS CONTROL MARKET, BY OFFERING, 2023–2028 (USD MILLION)
             TABLE 126 EUROPE: ACCESS CONTROL MARKE, BY HARDWARE TYPE, 2019–2022 (USD MILLION)
             TABLE 127 EUROPE: ACCESS CONTROL MARKET, BY HARDWARE TYPE, 2023–2028 (USD MILLION)
             TABLE 128 EUROPE: ACCESS CONTROL MARKET, BY SERVICE TYPE, 2019–2022 (USD MILLION)
             TABLE 129 EUROPE: ACCESS CONTROL MARKET, BY SERVICE TYPE, 2023–2028 (USD MILLION)
             TABLE 130 EUROPE: ACCESS CONTROL MARKET, BY VERTICAL, 2019–2022 (USD MILLION)
             TABLE 131 EUROPE: ACCESS CONTROL MARKET, BY VERTICAL, 2023–2028 (USD MILLION)
             TABLE 132 EUROPE: ACCESS CONTROL AS A SERVICE MARKET, BY TYPE, 2019–2022 (USD MILLION)
             TABLE 133 EUROPE: ACCESS CONTROL AS A SERVICE MARKET, BY TYPE, 2023–2028 (USD MILLION)
             TABLE 134 EUROPE: ACCESS CONTROL MARKET, BY COUNTRY, 2019–2022 (USD MILLION)
             TABLE 135 EUROPE: ACCESS CONTROL MARKET, BY COUNTRY, 2023–2028 (USD MILLION)
             11.3.1 UK
                        11.3.1.1 Increasing demand for enhanced security to propel market
             11.3.2 GERMANY
                        11.3.2.1 Growing adoption of ACaaS to drive market
             11.3.3 FRANCE
                        11.3.3.1 Rising deployment of access control solutions in aviation and railways to fuel market
             11.3.4 REST OF EUROPE
     11.4 ASIA PACIFIC 
             FIGURE 47 SNAPSHOT: ACCESS CONTROL MARKET IN ASIA PACIFIC
             TABLE 136 ASIA PACIFIC: ACCESS CONTROL MARKET, BY OFFERING, 2019–2022 (USD MILLION)
             TABLE 137 ASIA PACIFIC: ACCESS CONTROL MARKET, BY OFFERING, 2023–2028 (USD MILLION)
             TABLE 138 ASIA PACIFIC: ACCESS CONTROL MARKET, BY HARDWARE TYPE, 2019–2022 (USD MILLION)
             TABLE 139 ASIA PACIFIC: ACCESS CONTROL MARKET, BY HARDWARE TYPE, 2023–2028 (USD MILLION)
             TABLE 140 ASIA PACIFIC: ACCESS CONTROL MARKET, BY SERVICE TYPE, 2019–2022 (USD MILLION)
             TABLE 141 ASIA PACIFIC: ACCESS CONTROL MARKET, BY SERVICE TYPE, 2023–2028 (USD MILLION)
             TABLE 142 ASIA PACIFIC: ACCESS CONTROL MARKET, BY VERTICAL, 2019–2022 (USD MILLION)
             TABLE 143 ASIA PACIFIC: ACCESS CONTROL MARKET, BY VERTICAL, 2023–2028 (USD MILLION)
             TABLE 144 ASIA PACIFIC: ACCESS CONTROL AS A SERVICE MARKET, BY TYPE, 2019–2022 (USD MILLION)
             TABLE 145 ASIA PACIFIC: ACCESS CONTROL AS A SERVICE MARKET, BY TYPE, 2023–2028 (USD MILLION)
             TABLE 146 ASIA PACIFIC: ACCESS CONTROL MARKET, BY COUNTRY, 2019–2022 (USD MILLION)
             TABLE 147 ASIA PACIFIC: ACCESS CONTROL MARKET, BY COUNTRY, 2023–2028 (USD MILLION)
             11.4.1 CHINA
                        11.4.1.1 Large-scale industrialization to boost need for security systems
             11.4.2 JAPAN
                        11.4.2.1 Increasing adoption of IoT and self-driving cars to drive market
             11.4.3 SOUTH KOREA
                        11.4.3.1 Growing need for security solutions for ensuring border security to accelerate market growth
             11.4.4 INDIA
                        11.4.4.1 Rising data security breaches to propel market
             11.4.5 REST OF ASIA PACIFIC
     11.5 ROW 
             TABLE 148 ROW: ACCESS CONTROL MARKET, BY OFFERING, 2019–2022 (USD MILLION)
             TABLE 149 ROW: ACCESS CONTROL MARKET, BY OFFERING, 2023–2028 (USD MILLION)
             TABLE 150 ROW: ACCESS CONTROL MARKET, BY HARDWARE TYPE, 2019–2022 (USD MILLION)
             TABLE 151 ROW: ACCESS CONTROL MARKET, BY HARDWARE TYPE, 2023–2028 (USD MILLION)
             TABLE 152 ROW: ACCESS CONTROL MARKET, BY SERVICE TYPE, 2019–2022 (USD MILLION)
             TABLE 153 ROW: ACCESS CONTROL MARKET, BY SERVICE TYPE, 2023–2028 (USD MILLION)
             TABLE 154 ROW: ACCESS CONTROL MARKET, BY VERTICAL, 2019–2022 (USD MILLION)
             TABLE 155 ROW: ACCESS CONTROL MARKET, BY VERTICAL, 2023–2028 (USD MILLION)
             TABLE 156 ROW: ACCESS CONTROL AS A SERVICE MARKET, BY TYPE, 2019–2022 (USD MILLION)
             TABLE 157 ROW: ACCESS CONTROL AS A SERVICE MARKET, BY TYPE, 2023–2028 (USD MILLION)
             TABLE 158 ROW: ACCESS CONTROL MARKET, BY REGION, 2019–2022 (USD MILLION)
             TABLE 159 ROW: ACCESS CONTROL MARKET, BY REGION, 2023–2028 (USD MILLION)
             11.5.1 MIDDLE EAST & AFRICA
                        11.5.1.1 Rising government security initiatives to boost market
             11.5.2 SOUTH AMERICA
                        11.5.2.1 Growing crime rate to drive market
 
12 COMPETITIVE LANDSCAPE (Page No. - 178)
     12.1 INTRODUCTION 
     12.2 STRATEGIES OF KEY PLAYERS/RIGHT TO WIN 
             TABLE 160 OVERVIEW OF STRATEGIES DEPLOYED BY KEY PLAYERS IN ACCESS CONTROL MARKET
             12.2.1 PRODUCT PORTFOLIO
             12.2.2 REGIONAL FOCUS
             12.2.3 MANUFACTURING FOOTPRINT
             12.2.4 ORGANIC/INORGANIC GROWTH STRATEGIES
     12.3 MARKET SHARE ANALYSIS, 2022 
             TABLE 161 ACCESS CONTROL MARKET: MARKET SHARE ANALYSIS (2021)
     12.4 REVENUE ANALYSIS OF TOP PLAYERS IN ACCESS CONTROL MARKET 
             FIGURE 48 FIVE-YEAR REVENUE ANALYSIS OF TOP PLAYERS IN ACCESS CONTROL MARKET
     12.5 COMPANY EVALUATION QUADRANT, 2022 
             12.5.1 STARS
             12.5.2 PERVASIVE PLAYERS
             12.5.3 EMERGING LEADERS
             12.5.4 PARTICIPANTS
                        FIGURE 49 ACCESS CONTROL MARKET (GLOBAL): KEY COMPANY EVALUATION QUADRANT, 2022
     12.6 COMPETITIVE BENCHMARKING 
             12.6.1 COMPANY FOOTPRINT, BY OFFERING
             12.6.2 COMPANY FOOTPRINT, BY VERTICAL
             12.6.3 COMPANY FOOTPRINT, BY REGION
             12.6.4 OVERALL COMPANY FOOTPRINT
     12.7 STARTUPS/SMALL AND MEDIUM-SIZED ENTERPRISES (SME) EVALUATION MATRIX, 2022 
             TABLE 162 ACCESS CONTROL MARKET: DETAILED LIST OF KEY STARTUPS/SMES
             TABLE 163 STARTUPS/SMES IN ACCESS CONTROL MARKET
             TABLE 164 ACCESS CONTROL MARKET: COMPETITIVE BENCHMARKING OF KEY STARTUPS/SMES (VERTICAL FOOTPRINT)
             TABLE 165 ACCESS CONTROL MARKET: COMPETITIVE BENCHMARKING OF KEY STARTUPS/SMES (REGION FOOTPRINT)
             12.7.1 PROGRESSIVE COMPANIES
             12.7.2 RESPONSIVE COMPANIES
             12.7.3 DYNAMIC COMPANIES
             12.7.4 STARTING BLOCKS
                        FIGURE 50 ACCESS CONTROL MARKET (GLOBAL): STARTUP/SME EVALUATION MATRIX, 2022
     12.8 COMPETITIVE SITUATION AND TRENDS 
             12.8.1 PRODUCT LAUNCHES & DEVELOPMENTS
                        TABLE 166 ACCESS CONTROL MARKET: PRODUCT LAUNCHES/DEVELOPMENTS, 2021–2023
             12.8.2 DEALS
                        TABLE 167 ACCESS CONTROL MARKET: DEALS, 2021–2023
 
13 COMPANY PROFILES (Page No. - 196)
(Business Overview, Products Offered, Recent Developments, MnM View Right to win, Strategic choices made, Weaknesses and competitive threats) *  
     13.1 INTRODUCTION 
     13.2 KEY PLAYERS 
             13.2.1 ASSA ABLOY
                        TABLE 168 ASSA ABLOY: BUSINESS OVERVIEW
                        FIGURE 51 ASSA ABLOY: COMPANY SNAPSHOT
             13.2.2 DORMAKABA HOLDING
                        TABLE 169 DORMAKABA HOLDING: BUSINESS OVERVIEW
                        FIGURE 52 DORMAKABA HOLDING: COMPANY SNAPSHOT
             13.2.3 JOHNSON CONTROLS
                        TABLE 170 JOHNSON CONTROLS: BUSINESS OVERVIEW
                        FIGURE 53 JOHNSON CONTROLS: COMPANY SNAPSHOT
             13.2.4 ALLEGION PLC
                        TABLE 171 ALLEGION PLC: BUSINESS OVERVIEW
                        FIGURE 54 ALLEGION PLC: COMPANY SNAPSHOT
             13.2.5 HONEYWELL INTERNATIONAL INC.
                        TABLE 172 HONEYWELL INTERNATIONAL: BUSINESS OVERVIEW
                        FIGURE 55 HONEYWELL INTERNATIONAL: COMPANY SNAPSHOT
             13.2.6 IDENTIV
                        TABLE 173 IDENTIV: BUSINESS OVERVIEW
                        FIGURE 56 INDENTIV: COMPANY SNAPSHOT
             13.2.7 NEDAP N.V.
                        TABLE 174 NEDAP N.V.: BUSINESS OVERVIEW
                        FIGURE 57 NEDAP N.V.: COMPANY SNAPSHOT
             13.2.8 SUPREMA INC.
                        TABLE 175 SUPREMA INC.: BUSINESS OVERVIEW
             13.2.9 BOSCH SECURITY AND SAFETY SYSTEMS
                        TABLE 176 BOSCH SECURITY AND SAFETY SYSTEMS: BUSINESS OVERVIEW
             13.2.10 THALES GROUP
                        TABLE 177 THALES GROUP: BUSINESS OVERVIEW
                        FIGURE 58 THALES GROUP: COMPANY SNAPSHOT
     13.3 OTHER PLAYERS 
             13.3.1 AMAG TECHNOLOGY, INC.
             13.3.2 AXIS COMMUNICATIONS AB
             13.3.3 GUNNEBO AB
             13.3.4 NEC CORPORATION
             13.3.5 GALLAGHER GROUP LIMITED
             13.3.6 BRIVO, INC.
             13.3.7 SALTO SYSTEMS, S.L.
             13.3.8 IDEMIA
             13.3.9 VANDERBILT INDUSTRIES
             13.3.10 CANSEC SYSTEMS LTD.
             13.3.11 STANLEY SECURITY (SECURITAS TECHNOLOGY)
             13.3.12 DATAWATCH SYSTEMS
             13.3.13 TELCRED AB
             13.3.14 FORCEFIELD SYSTEMS
             13.3.15 KISI INC.
*Details on Business Overview, Products Offered, Recent Developments, MnM View, Right to win, Strategic choices made, Weaknesses and competitive threats might not be captured in case of unlisted companies.  
 
14 APPENDIX (Page No. - 249)
     14.1 DISCUSSION GUIDE 
     14.2 KNOWLEDGESTORE: MARKETSANDMARKETS’ SUBSCRIPTION PORTAL 
     14.3 CUSTOMIZATION OPTIONS 
     14.4 RELATED REPORTS 
     14.5 AUTHOR DETAILS 
 

The study involved four major activities in estimating the size of the access control market. Exhaustive secondary research has been done to collect information on the market, peer market, and parent market. Validation of these findings, assumptions, and sizing with industry experts across the value chain through primary research has been the next step. Both top-down and bottom-up approaches have been employed to estimate the global market size. After that, market breakdown and data triangulation have been used to estimate the market sizes of segments and subsegments.

Secondary Research

Secondary sources that were referred to for this research study include corporate filings (such as annual reports, investor presentations, and financial statements); trade, business, and professional associations; white papers; certified publications; articles from recognized authors; directories; and databases. Secondary data was collected and analyzed to arrive at the overall market size, further validated by primary research.

Primary Research

Extensive primary research was conducted after understanding and analyzing the access control market scenario through the secondary research process. Several primary interviews were conducted with key opinion leaders from both the demand- and supply-side vendors across four major regions—North America, Asia Pacific, Europe, and RoW (including the Middle East & Africa and South America).

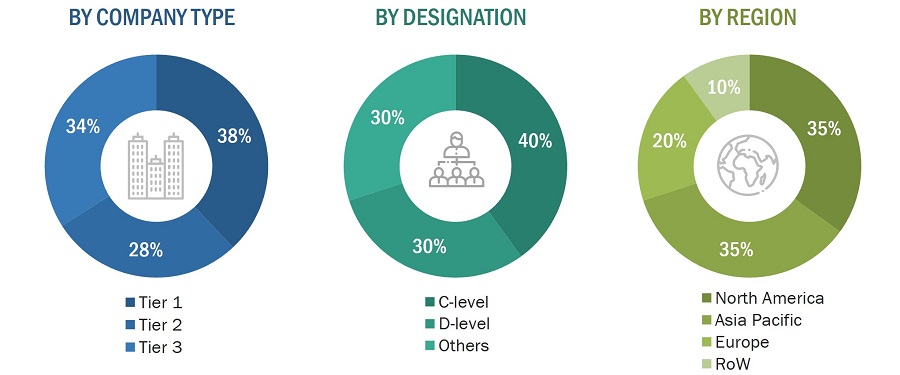
After interacting with industry experts, brief sessions were conducted with highly experienced independent consultants to reinforce the findings from our primaries. This, along with the in-house subject matter experts’ opinions, has led us to the findings as described in the remainder of this report.

Breakdown of Primaries

Particulars

Intended Participants and Key Opinion Leaders

Primary Interview Breakup

  • Access control product/solution provider
  • End-user representatives from commercial, manufacturing & industrial, government, healthcare, residential, transportation, and military & defense verticals

Access Control Market Size, and Share

To know about the assumptions considered for the study, download the pdf brochure

Market Size Estimation

Top-down and bottom-up approaches have been used to estimate and validate the overall access control market size and the various dependent submarkets. The key players involved in the access control market have been identified through secondary research, and their market shares in the respective geographies have been determined through primary and secondary research. The research methodology includes the study of the annual and financial reports of the top market players and extensive interviews for key insights from industry leaders such as CEOs, VPs, directors, and marketing executives.

All the percentage shares, splits, and breakdowns have been determined using secondary sources and verified through primary sources. All possible parameters that affect the markets covered in this research study have been accounted for, viewed in detail, verified through primary research, and analyzed to derive the final quantitative and qualitative data. This data is consolidated and supplemented with detailed inputs and analysis from MarketsandMarkets and presented in this report.

Market Size Estimation Methodology-Bottom-up approach

The bottom-up approach was employed to arrive at the overall size of the access control market from the revenues of the key players and their market share. The key players such as ASSA ABLOY (Sweden), Johnson Controls (Ireland), dormakaba Holding (Switzerland), Allegion plc (Ireland), Honeywell International (US), Identiv (US), Nedap N.V. (Netherlands), Suprema HQ (South Korea), Bosch Security Systems (US), and Thales Group (France) were studied, and market estimations were done considering the shipment and average selling price (ASP) of various verticals.

Access Control Market Size, and Bottom-Up Approach

Market Size Estimation Top-Down approach

In the top-down approach, the overall market size was used to estimate the size of individual markets (mentioned in the market segmentation) through percentage splits from secondary and primary research.

For the calculation of specific market segments, the most appropriate parent market size was used to implement the top-down approach. The bottom-up approach was also implemented for the data extracted from secondary research to validate the market size obtained.
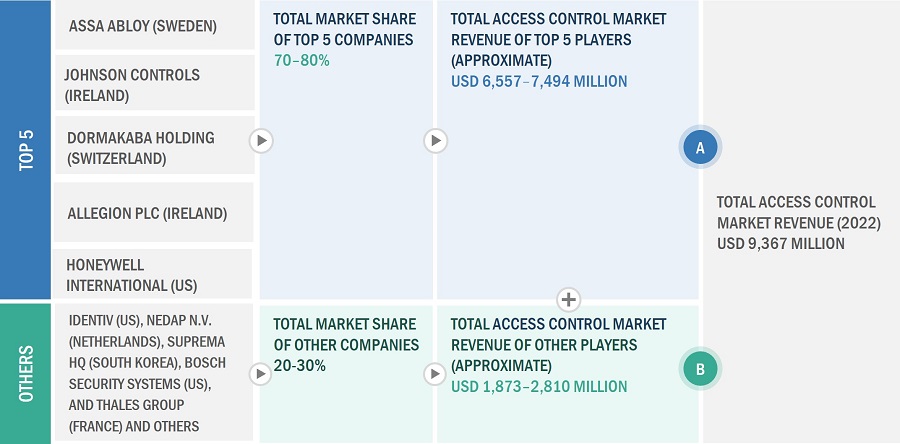
Access Control Market Size, and Top-Down approach

Data Triangulation

After arriving at the overall market size from the market size estimation process explained in the previous section, the total market was split into several segments and subsegments. Data triangulation procedure was employed, wherever applicable, to complete the overall market engineering process and arrive at the exact statistics for all segments and subsegments. The data was triangulated by studying various factors and trends from the demand and supply sides, and the market size was validated using top-down and bottom-up approaches.

Market Definition

Access control is a security technique that regulates communication between users and systems. It restricts the entry of unauthorized individuals into restricted areas to protect people and assets. An access control system provides secure access to physical resources by validating user credentials. Every vertical has specific security requirements—from excluding intruders and limiting access to dangerous or sensitive areas to protecting valuable assets and equipment or ensuring the safety of secluded areas.

Key Stakeholders

  • Suppliers of raw materials and manufacturing equipment
  • Providers and manufacturers of components
  • Providers of software solutions
  • Manufacturers and providers of devices
  • Original equipment manufacturers (OEMs)
  • ODM and OEM technology solution providers
  • Suppliers and distributors of access control devices
  • System integrators
  • Middleware providers
  • Assembly, testing, and packaging vendors
  • Market research and consulting firms
  • Associations, organizations, forums, and alliances related to the access control industry
  • Technology investors
  • Governments, regulatory bodies, and financial institutions
  • Venture capitalists, private equity firms, and startups
  • End-users

The main objectives of this study are as follows:

  • To define, describe, and forecast the access control market, in terms of value, based on access control as a service, offering, and vertical
  • To define, describe, and forecast the market, in terms of volume, based on hardware component
  • To provide information on the different models and types of access control systems
  • To forecast the market size, in terms of value, with regard to four major regions—North America, Europe, Asia Pacific, and the Rest of the World (RoW)
  • To provide detailed information regarding the major factors influencing the growth of the market (drivers, restraints, opportunities, and challenges)
  • To analyze the micromarkets1 with respect to individual growth trends, prospects, and contributions to the total market
  • To provide a detailed overview of the market’s value chain
  • To analyze the opportunities in the market for various stakeholders by identifying the high-growth segments of the market
  • To profile the key players and comprehensively analyze their market position in terms of ranking and core competencies2
  • To provide the competitive landscape of the market
  • To analyze competitive developments such as product launches and developments, partnerships, acquisitions, contracts, expansions, and R&D in the market

Available Customizations:

MarketsandMarkets offers the following customizations for this market report:

  • Further breakdown of the market in different regions to the country-level
  • Detailed analysis and profiling of additional market players (up to 5)
Custom Market Research Services

We will customize the research for you, in case the report listed above does not meet with your exact requirements. Our custom research will comprehensively cover the business information you require to help you arrive at strategic and profitable business decisions.

Request Customization

Instant Answers with GPT - Ask Now!

Ask real questions. Get complete answers !
Report Code
SE 3145
Published ON
Mar, 2023
Choose License Type
BUY NOW
  • SHARE
X
Request Customization
Speak to Analyst
Speak to Analyst
OR FACE-TO-FACE MEETING
PERSONALIZE THIS RESEARCH
  • Triangulate with your Own Data
  • Get Data as per your Format and Definition
  • Gain a Deeper Dive on a Specific Application, Geography, Customer or Competitor
  • Any level of Personalization
REQUEST A FREE CUSTOMIZATION
LET US HELP YOU!
  • What are the Known and Unknown Adjacencies Impacting the Access Control Market
  • What will your New Revenue Sources be?
  • Who will be your Top Customer; what will make them switch?
  • Defend your Market Share or Win Competitors
  • Get a Scorecard for Target Partners
CUSTOMIZED WORKSHOP REQUEST
+1-888-600-6441
  • Call Us
  • +1-888-600-6441 (Corporate office hours)
  • +1-888-600-6441 (US/Can toll free)
  • +44-800-368-9399 (UK office hours)
CONNECT WITH US
ABOUT TRUST ONLINE
©2023 MarketsandMarkets Research Private Ltd. All rights reserved
DMCA.com Protection Status Website Feedback