
Agricultural Surfactants Market by Type (Non-ionic, Anionic, Cationic, Amphoteric), Application (Herbicides, Fungicides), Substrate Type (Synthetic, Bio-based), Crop Type (Cereals & Grains, Fruits & Vegetables), and Region - Global Forecast to 2028
Market Segmentation
| Report Metrics | Details |
|
Market size available for years |
2017 - 2022 |
|
CAGR % |
6.46 |
Top 10 companies in Agricultural Surfactants Market


Speak to Analyst to get the Global Forecasts Data up to 2028
[148 Pages Report] The agricultural surfactants market was valued at USD 1.30 Billion in 2016 and is projected to reach 1.88 Billion by 2022, growing at a CAGR of 6.46% during the forecast period.
See how this study impacted revenues for other players in Agricultural Surfactants Market
Client’s Problem Statement
With the growing regulatory pressure on synthetic surfactants, the client wanted to identify new areas of growth in the European market. On approaching MnM to enquire about the growth prospects in the agricultural surfactants segment, the client was happy to know that we keep track of ongoing developments in agrochemicals and allied industries. 
MnM Approach
According to MnM, the phasing out of NPE-based solutions would create growth opportunities for agricultural surfactant manufacturers that develop bio-based agricultural surfactants that are environmentally safe. According to MarketsandMarkets analysis, the market for bio-based agricultural surfactants is projected to reach USD 824.9 million by 2025.
Revenue Impact (RI)
Recommendations by MnM on the potential of bio-based products helped the client to increase its revenue by USD 80 million in the agricultural surfactants segment. We also helped the client to gain a sizeable lead in the regional market share in agricultural surfactants.
For More details on this research, Request Free Sample Report
Increase in demand for green solutions
The global surfactants market is primarily dominated by chemical surfactants derived from oleochemical or petrochemical sources. However, due to the rising concerns for the safety of the environment as well as human health, the governments and surfactant manufacturers are majorly focusing on shifting to renewable and sustainable products in almost every application. This has led to high demand for biologically derived products that pose a negligible threat to the environment as compared to the conventional petroleum-derived products that are toxic in nature and bio-accumulate in the marine environment. Biosurfactants are microbial surfactants having superior functionality when compared to chemically synthesized agents. These types of surfactants are considered eco-friendly raw materials due to their high level of safety and biodegradability. The rising awareness among consumers for the use of renewable and natural ingredients in their day-to-day products is boosting the demand for biosurfactants and the development of greener solutions for various applications such as cosmetics, pharmaceuticals, industrial cleaning, and biochemicals. The manufacturers are, therefore, keen to adapt to this changing trend of utilizing green solutions in their products.
Use of genetically modified seeds
Bacillus thuringiensis (Bt) is a bacterium that contains an endotoxic insecticidal gene, which is induced by genetic engineering in crops such as corn, tomatoes, rapeseeds, rice, and soybean. These genetically modified crops have the ability to develop their own Bt toxins that act as pesticides. Genetically modified crops have reduced the dependency of farmers on the usage of pesticides for pest management.
According to a research paper published in Agricultural & Applied Economics Association and Western Agricultural Economics Association, 8 million farmers cultivated more than 181 million hectares of GM crops across 28 countries in 2016. The leading developing countries engaged in GM crop production are India, China, Brazil, Argentina, and South Africa. These examples of biotechnological revolution severely affect the global crop protection chemicals market, which in turn will affect the agricultural surfactants market. According to International Service for Acquisition of Agri-biotech Applications (ISAAA), in 2013, GM crops were cultivated in 175.2 million hectares across the world.
The increasing use of GM seeds and crops is directly curbing the use of pesticides as GM seeds and crops have helped farmers to avoid monetary costs, spraying time loss, exposure to harmful chemicals, weeding, and potential health risks, owing to the use and handling of pesticides. In some regions, particularly in North and South America, the increasing use of GM crops might mean the limited use of insecticides, but increased use of herbicides.
Development of cost-effective production techniques
The production of bio-based surfactants on a commercial scale is not yet viable due to many barriers related to costs, productivity, and yield. The increased downstream cost, high foam formation during production, and low productivity have resulted in many R&D activities. Many new developments have been the area of focus for researchers; these include reducing the raw material costs, increasing the production yield, and developing oxygenation strategies to lower the foam formation. In order to improve the bio-based surfactant productivity, several approaches have been undertaken, such as genetic modifications (amplification or gene knockout, mutation, and altered regulation), optimization of growth conditions (temperature, pH, growth medium, fermentation phases, and oxygenation), and computational modeling.
It has been observed that the production of bio-based surfactants in a bioreactor leads to intense foaming formation, during the aeration and agitation of the solution. Sometimes, the high foam formation is caused by the presence of extracellular proteins, thereby resulting in an increase in production cost. Though mechanical foam breakers and antifoam agents are used, they are not very efficient and tend to alter the quality of the product. However, many strategies are being developed to overcome this issue of foam generation.
Also, it has been studied that the use of low-cost substrates such as crude or waste materials—such as glycerin from biodiesel production waste, fatty acids from soybean oil refinery waste, and sunflower oil refinery waste—reduces the production costs of bio-based surfactants largely. The use of such waste substrates substantially reduces the overall costs, maximizes the utilization efficiency, and makes the process eco-friendlier.
The years considered for the study are as follows:
- Base year – 2016
- Forecast period – 2017 to 2022
Objectives of the report
- Determining and projecting the size of the agricultural surfactants market with respect to their types, applications, substrate types, crop types, and regional markets, over a five-year period ranging from 2017 to 2022
- Identifying the attractive opportunities in the market by determining the largest and fastest-growing segments across regions
- Analyzing the demand-side factors on the basis of the following:
- Impact of macro- and micro-economic factors on the market
- Shifts in demand patterns across different subsegments and regions
Research Methodology:
- Major regions were identified, along with countries contributing the maximum share.
- Secondary research was conducted to determine the value of agricultural surfactants market for five regions North America, Europe, Asia Pacific, South America, and RoW.
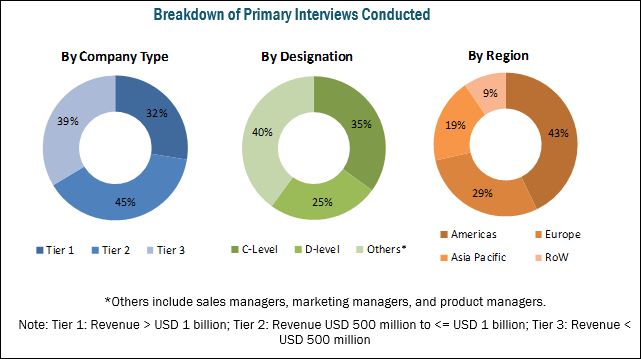
- The key players have been identified through secondary sources such as the Food and Agriculture Organization (FAO), the World Bank, European Crop Protection Association (ECPA), The National Pest Management Association (NPMA), Council of Producers and Distributors of Agrotechnology (CPDA), and Environmental Protection Agency (EPA), while their market share in respective regions has been determined through both, primary and secondary research. The research methodology includes the study of annual and financial reports of top market players as well as interviews with industry experts (such as CEOs, VPs, directors, and marketing executives) for key insights (both quantitative and qualitative) for the agricultural surfactants market.
To know about the assumptions considered for the study, download the pdf brochure
The various contributors involved in the value chain of the agricultural surfactants market include raw material suppliers, R&D institutes, agricultural surfactant manufacturing companies as DowDuPont (US), BASF (Germany), AkzoNobel (Netherlands), Evonik (Germany), and Solvay (Belgium), and government bodies & regulatory associations such as the US Department of Agriculture (USDA) and the US Environmental Protection Agency (EPA).
Target Audience
The stakeholders for the report are as follows:
- Associations and industry bodies
- Government and research organizations
- Key global agricultural surfactants companies
- Global agricultural surfactant traders, distributors, and suppliers
- Technology providers to agricultural surfactant manufacturing companies
Scope of the Report:
This research report categorizes the agricultural surfactants market based on type, application, substrate type, crop type, and region.
Based on Type, the market has been segmented as follows:
- Non-ionic
- Anionic
- Cationic
- Amphoteric
Based on Application, the market has been segmented as follows:
- Herbicides
- Fungicides
- Insecticides
- Others (fertilizers, micronutrients, biostimulants, disinfectants, biocides, plant regulators, and other crop protection chemicals such as nematicides and acaricides)
Based on Substrate type, the market has been segmented as follows:
- Synthetic
- Bio-based
Based on Crop Type, the market has been segmented as follows:
- Cereals & grains
- Fruits & vegetables
- Others (sugarcane, plantation crops, and turf & ornamentals)
Based on Region, the market has been segmented as follows:
- North America
- Europe
- Asia Pacific
- South America
- RoW (Africa and the Middle East)
Available Customizations
With the given market data, MarketsandMarkets offers customizations according to the company’s specific scientific needs.
The following customization options are available for the report:
Product Analysis
- Product matrix, which gives a detailed comparison of the service portfolio of each company
Geographic Analysis
- Further breakdown of the Rest of Asia Pacific market for agricultural surfactants into Australia, Indonesia, and Vietnam
- Further breakdown of the Rest of European market for agricultural surfactants into Poland, the Netherlands, the UK, Ireland, and Belgium
- Further breakdown of the Rest of South American market for agricultural surfactants into Colombia, Puerto Rico, Chile, and Peru
Company Information
- Detailed analyses and profiling of additional market players (up to five)
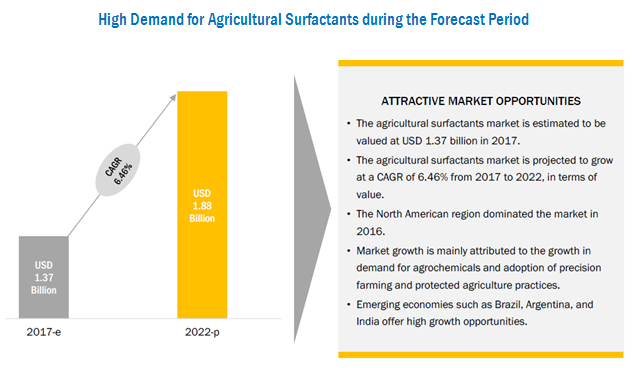
The agricultural surfactants market was valued at USD 1.37 Billion in 2017 and is projected to reach USD 1.88 Billion by 2022, growing at a CAGR of 6.46%. Due to the growing demand for agrochemicals and the adoption of precision farming and protected cultivation, the market for surfactants is expected to grow in the coming years.
The market, based on type, has been segmented into non-ionic, anionic, cationic, and amphoteric. The non-ionic segment occupied the largest share in the market as most agricultural surfactants are non-ionic and are used for general wetting and spreading. Additionally, non-ionic surfactants are usually sold for being added to herbicide spray solutions. These surfactants are good dispersing agents, stable in cold water, and are less toxic to both plants and animals.
The market for agricultural surfactants, by application, has been segmented into herbicides, fungicides, insecticides, and others (fertilizers, micronutrients, biostimulants, disinfectants, biocides, plant regulators, and other crop protection chemicals such as nematicides and acaricides). Agricultural surfactants are almost always present in herbicide treatment solutions with the aim to improve spray droplet retention on and penetration of active ingredients into plant foliage. Hence, this application dominated the market in 2017.
The market for agricultural surfactants, by substrate type, has been segmented into synthetic and bio-based. Synthetic surfactants are mainly derived from the chemical synthesis of petroleum or petroleum-based products. Currently, most surfactants available in the market are synthesized from petroleum-based feedstock such as ethylene, benzene, kerosene, and n-paraffins. This segment dominated the market in 2017 due to the high consumption of herbicides and fungicides that consist of surfactants in the range of 1%–10%.
The market for agricultural surfactants, by crop type, has been segmented into cereals & grains, fruits & vegetables, and others (sugarcane, plantation crops, and turf & ornamentals). Herbicides are largely used during the production of cereals & grains. Surfactants are used in herbicide treatment solutions for cereals & grains to improve spray droplet retention and penetration of active ingredients into the plant foliage. Therefore, the cereals & grains segment dominated the market in 2017.
For More details on this research, Request Free Sample Report
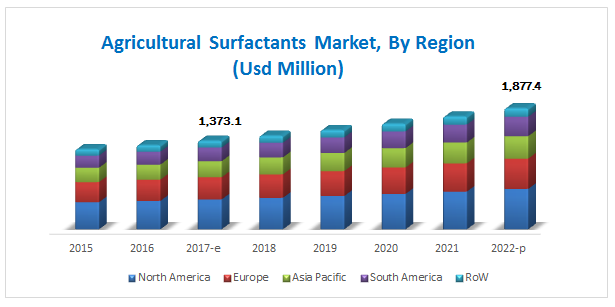
South America is projected to be the fastest-growing market for agricultural surfactants over the next five years. This can be attributed to Brazil and Argentina, which are the leading agricultural producers in the world. North America dominated the market in 2017 due to the presence of players such as DowDuPont (US), Huntsman Corporation (US), Helena Chemical (US), and Stepan Company (US).
Use of genetically modified seeds and the growing restrictions on synthetic surfactants have been the major restraints for the market growth.
The global market for agricultural surfactants is dominated by large-scale players such as DowDuPont (US), BASF (Germany), AkzoNobel (Netherlands), Evonik (Germany), and Solvay (Belgium). Huntsman Corporation (US), Nufarm (Australia), Clariant (Switzerland), Helena Chemical Company (US), Croda International (UK), Stepan Company (US), and Wilbur-Ellis Company (US) are a few other key market players that also hold a significant share of the market.
Frequently Asked Questions (FAQ):
What is the leading application in the agricultural surfactants market?
The herbicides segment was the highest revenue contributor to the market, with USD 705.6 million in 2016, and is estimated to reach USD 1,022.7 million by 2022, with a CAGR of 6.6%. The chemical fungicides segment is estimated to reach USD 394.6 million by 2022, at a significant CAGR of 6.9% during the forecast period.
What is the estimated industry size of agricultural surfactants?
The global agricultural surfactants market was valued at USD 1,303.7 million in 2016, and is projected to reach USD 1,877.4 million by 2022, registering a CAGR of 6.5% from 2017 to 2022.
What is the leading crop type of agricultural surfactants market?
The cereals & grains segment was the highest revenue contributor to the market, with USD 557.6 million in 2016, and is estimated to reach USD 817.0 million by 2022, with a CAGR of 6.8%. .
To speak to our analyst for a discussion on the above findings, click Speak to Analyst
Table of Contents
1 Introduction (Page No. - 13)
1.1 Objectives of the Study
1.2 Market Definition
1.3 Study Scope
1.4 Periodization Considered
1.5 Currency Considered
1.6 Unit Considered
1.7 Stakeholders
2 Research Methodology (Page No. - 18)
2.1 Research Data
2.1.1 Secondary Data
2.1.2 Primary Data
2.1.2.1 Key Industry Insights
2.1.2.2 Breakdown of Primaries
2.2 Market Size Estimation
2.2.1 Bottom-Up Approach
2.2.2 Top-Down Approach
2.3 Market Breakdown and Data Triangulation
2.4 Research Assumptions and Limitations
2.4.1 Assumptions
2.4.2 Limitations
3 Executive Summary (Page No. - 26)
4 Premium Insights (Page No. - 32)
4.1 Attractive Opportunities in the Market
4.2 North America: Market For Agricultural Surfactants
4.3 Market For Agricultural Surfactants, By Type & Region
4.4 Market For Agricultural Surfactants Share: Key Countries
4.5 Market For Agricultural Surfactants, By Region
5 Market Overview (Page No. - 37)
5.1 Introduction
5.2 Macroeconomic Indicators
5.2.1 Population Growth and Decrease in Arable Land
5.2.2 Increase in Farm Expenditure
5.3 Market Dynamics
5.3.1 Drivers
5.3.1.1 Adoption of Precision Farming and Protected Agriculture
5.3.1.2 Increase in Demand for Green Solutions
5.3.2 Restraints
5.3.2.1 Regulations on the Use of Synthetic Surfactants
5.3.2.2 Use of Genetically Modified Seeds
5.3.3 Opportunities
5.3.3.1 Production of Sustainable Bio-Based Surfactant Products
5.3.3.2 Development of Cost-Effective Production Techniques
5.3.4 Challenges
5.3.4.1 Growth in Environmental Concerns Against the Usage of Agrochemicals
6 Agricultural Surfactants Market, By Type (Page No. - 45)
6.1 Introduction
6.2 Non-Ionic
6.3 Anionic
6.4 Amphoteric
6.5 Cationic
7 Agricultural Surfactants Market, By Application (Page No. - 51)
7.1 Introduction
7.2 Herbicides
7.3 Fungicides
7.4 Insecticides
7.5 Others
8 Agricultural Surfactants Market, By Substrate Type (Page No. - 57)
8.1 Introduction
8.2 Synthetic
8.3 Bio-Based
9 Agricultural Surfactants Market, By Crop Type (Page No. - 61)
9.1 Introduction
9.2 Cereals & Grains
9.2.1 Corn
9.2.2 Wheat
9.2.3 Other Cereals & Grains
9.3 Fruits & Vegetables
9.4 Others
10 Agricultural Surfactants Market, By Region (Page No. - 67)
10.1 Introduction
10.2 North America
10.2.1 US
10.2.2 Canada
10.2.3 Mexico
10.3 Europe
10.3.1 Germany
10.3.2 France
10.3.3 Ukraine
10.3.4 Italy
10.3.5 Spain
10.3.6 Rest of Europe
10.4 Asia Pacific
10.4.1 China
10.4.2 India
10.4.3 Japan
10.4.4 Thailand
10.4.5 Malaysia
10.4.6 Rest of Asia Pacific
10.5 South America
10.5.1 Brazil
10.5.2 Argentina
10.5.3 Rest of South America
10.6 Rest of the World (RoW)
10.6.1 Africa
10.6.2 Middle East
11 Competitive Landscape (Page No. - 103)
11.1 Overview
11.2 Company Rankings
11.3 Competitive Scenario
11.3.1 Expansions & Investments
11.3.2 Mergers & Acquisitions
11.3.3 New Product Launches& Developments
11.3.4 Agreements
12 Company Profiles (Page No. - 109)
(Business Overview, Products Offered, Recent Developments, SWOT Analysis, MnM View)*
12.1 Dowdupont
12.2 BASF
12.3 Akzonobel
12.4 Evonik Industries
12.5 Solvay
12.6 Huntsman Corporation
12.7 Clariant
12.8 Helena Chemical Company
12.9 Nufarm
12.10 Croda International
12.11 Stepan Company
12.12 Wilbur-Ellis Company
*Details on Business Overview, Products Offered, Recent Developments, SWOT Analysis, MnM View Might Not Be Captured in Case of Unlisted Companies.
13 Appendix (Page No. - 140)
13.1 Knowledge Store: Marketsandmarkets’ Subscription Portal
13.2 Introducing RT: Real-Time Market Intelligence
13.3 Available Customizations
13.4 Related Reports
13.5 Author Details
List of Tables (77 Tables)
Table 1 USD Exchange Rate, 2014–2016
Table 2 GM Crops & Biopesticides: Substitution Potential of Synthetic Pesticides for Various Crops
Table 3 Agricultural Surfactants Market Size, By Type, 2015–2022 (USD Million)
Table 4 Agricultural Non-Ionic Surfactants Market Size, By Region, 2015–2022 (USD Million)
Table 5 Agricultural Anionic Surfactants Market Size, By Region, 2015–2022 (USD Million)
Table 6 Agricultural Amphoteric Surfactants Market Size, By Region, 2015–2022 (USD Million)
Table 7 Agricultural Cationic Surfactants Market Size, By Region, 2015–2022 (USD Million)
Table 8 AS Market Size, By Application, 2015–2022 (USD Million)
Table 9 AS Market Size in Herbicides, By Region, 2015–2022 (USD Million)
Table 10 AS Market Size in Fungicides, By Region, 2015–2022 (USD Million)
Table 11 AS Market Size in Insecticides, By Region, 2015–2022 (USD Million)
Table 12 AS Market Size in Other Applications, By Region, 2015–2022 (USD Million)
Table 13 Agricultural Surfactants Market Size, By Substrate Type, 2015–2022 (USD Million)
Table 14 Synthetic Agricultural Surfactants Market Size, By Region, 2015–2022 (USD Million)
Table 15 Bio-Based Market for Agricultural Surfactants Size, By Region, 2015–2022 (USD Million)
Table 16 AS Market Size, By Crop Type, 2015–2022 (USD Million)
Table 17 AS Market Size in Cereal & Grain Cultivation, By Region, 2015–2022 (USD Million)
Table 18 AS Market Size in Cereal & Grain Cultivation, By Crop, 2015–2022 (USD Million)
Table 19 AS Market Size in Fruit & Vegetable Cultivation, By Region, 2015–2022 (USD Million)
Table 20 Market for Agricultural Surfactants Size in Other Crop Types, By Region, 2015–2022 (USD Million)
Table 21 AS Market Size, By Region, 2015–2022 (USD Million)
Table 22 AS Market Size, By Region, 2015–2022 (KT)
Table 23 North America: Agricultural Surfactants Market Size, By Country, 2015–2022 (USD Million)
Table 24 North America: Agricultural Surfactants Market Size, By Country, 2015–2022 (KT)
Table 25 North America: Agricultural Surfactants Market Size, By Type, 2015–2022 (USD Million)
Table 26 North America: Agricultural Surfactants Market Size, By Application, 2015–2022 (USD Million)
Table 27 North America: By Market Size, By Substrate Type, 2015–2022 (USD Million)
Table 28 North America: Agricultural Surfactants Market Size, By Crop Type, 2015–2022 (USD Million)
Table 29 US: Agricultural Surfactants Market Size, By Type, 2015–2022 (USD Million)
Table 30 Canada: Agricultural Surfactants Market Size, By Type, 2015–2022 (USD Million)
Table 31 Mexico: By Market Size, By Type, 2015–2022 (USD Million)
Table 32 Europe: Agricultural Surfactants Market Size, By Country, 2015–2022 (USD Million)
Table 33 Europe: By Market Size, By Country, 2015–2022 (KT)
Table 34 Europe: Agricultural Surfactants Market Size, By Type, 2015–2022 (USD Million)
Table 35 Europe: Agricultural Surfactants Market Size, By Application, 2015–2022 (USD Million)
Table 36 Europe: By Market Size, By Substrate Type, 2015–2022 (USD Million)
Table 37 Europe: Agricultural Surfactants Market Size, By Crop Type, 2015–2022 (USD Million)
Table 38 Germany: By Market Size, By Type, 2015–2022 (USD Million)
Table 39 France: Agricultural Surfactants Market Size, By Type, 2015–2022 (USD Million)
Table 40 Ukraine: Agricultural Surfactants Market Size, By Type, 2015–2022 (USD Million)
Table 41 Italy: Agricultural Surfactants Market Size, By Type, 2015–2022 (USD Million)
Table 42 Spain: By Market Size, By Type, 2015–2022 (USD Million)
Table 43 Rest of Europe: Agricultural Surfactants Market Size, By Type, 2015–2022 (USD Million)
Table 44 Key Crops Cultivated, By Country
Table 45 Asia Pacific: Agricultural Surfactants Market Size, By Country, 2015–2022 (USD Million)
Table 46 Asia Pacific: By Market Size, By Country, 2015–2022 (KT)
Table 47 Asia Pacific: Agricultural Surfactants Market Size, By Type, 2015–2022 (USD Million)
Table 48 Asia Pacific: By Market Size, By Application, 2015–2022 (USD Million)
Table 49 Asia Pacific: Agricultural Surfactants Market Size, By Substrate Type, 2015–2022 (USD Million)
Table 50 Asia Pacific: By Market Size, By Crop Type, 2015–2022 (USD Million)
Table 51 China: Agricultural Surfactants Market Size, By Type, 2015–2022 (USD Million)
Table 52 India: By Market Size, By Type, 2015–2022 (USD Million)
Table 53 Japan: Agricultural Surfactants Market Size, By Type, 2015–2022 (USD Million)
Table 54 Thailand: By Market Size, By Type, 2015–2022 (USD Million)
Table 55 Malaysia: Agricultural Surfactants Market Size, By Type, 2015–2022 (USD Million)
Table 56 Rest of Asia Pacific: By Market Size, By Type, 2015–2022 (USD Million)
Table 57 South America: By Market Size, By Country, 2015–2022 (USD Million)
Table 58 South America: Agricultural Surfactants Market Size, By Country, 2015–2022 (KT)
Table 59 South America: By Market Size, By Type, 2015–2022 (USD Million)
Table 60 South America: Agricultural Surfactants Market Size, By Application, 2015–2022 (USD Million)
Table 61 South America: By Market Size, By Substrate Type, 2015–2022 (USD Million)
Table 62 South America: Agricultural Surfactants Market Size, By Crop Type, 2015–2022 (USD Million)
Table 63 Brazil: By Market Size, By Type, 2015–2022 (USD Million)
Table 64 Argentina: By Market Size, By Type, 2015–2022 (USD Million)
Table 65 Rest of South America: By Market Size, By Type, 2015–2022 (USD Million)
Table 66 RoW: Agricultural Surfactants Market Size, By Region, 2015–2022 (USD Million)
Table 67 RoW: By Market Size, By Region, 2015–2022 (KT)
Table 68 RoW: Agricultural Surfactants Market Size, By Type, 2015–2022 (USD Million)
Table 69 RoW: By Market Size, By Application, 2015–2022 (USD Million)
Table 70 RoW: Agricultural Surfactants Market Size, By Substrate Type, 2015–2022 (USD Million)
Table 71 RoW: By Market, By Crop Type, 2015–2022 (USD Million)
Table 72 Africa: By Market Size, By Type, 2015–2022 (USD Million)
Table 73 Middle East: Agricultural Surfactants Market Size, By Type, 2015–2022 (USD Million)
Table 74 Expansions & Investments, 2012–2018
Table 75 Mergers & Acquisitions, 2012–2018
Table 76 New Product Launches, 2013–2016
Table 77 Agreements, 2015–2017
List of Figures (43 Figures)
Figure 1 Agricultural Surfactants Market Segmentation
Figure 2 Regional Segmentation
Figure 3 Agricultural Surfactants: Research Design
Figure 4 Breakdown of Primaries: By Company Type, Designation, and Region
Figure 5 Market Size Estimation Methodology: Bottom-Up Approach
Figure 6 Market Size Estimation Methodology: Top-Down Approach
Figure 7 Data Triangulation Methodology
Figure 8 Market For Agricultural Surfactants Size, By Type, 2017 vs 2022 (USD Million)
Figure 9 By Market Size, By Application, 2017 vs 2022 (USD Million)
Figure 10 Market For Agricultural Surfactants Size, By Substrate Type, 2017 vs 2022 (USD Million)
Figure 11 By Market Size, By Crop Type, 2017 vs 2022 (USD Million)
Figure 12 Market For Agricultural Surfactants, By Region
Figure 13 High Demand for Agricultural Surfactants During the Forecast Period
Figure 14 North America: Agricultural Surfactants Market Share (Value), By Application & Country, 2016
Figure 15 Non-Ionic Segment Recorded the Largest Share in All the Regions in 2016
Figure 16 Brazil & Argentina: Important Markets for Agricultural Surfactants During the Forecast Period
Figure 17 Steady Growth is Projected in All Regions During the Forecast Period
Figure 18 Global Population Projected to Reach ~8.14 Billion By 2025
Figure 19 Decrease in Per Capita Arable Land
Figure 20 US: Farm Production Expenditures, 2007–2016
Figure 21 Market For Agricultural Surfactants: Drivers, Restraints, Opportunities, and Challenges
Figure 22 Non-Ionic Segment is Projected to Dominate the Market Through 2022
Figure 23 Herbicides Segment Projected to Dominate the Market During the Forecast Period
Figure 24 Synthetic Surfactants Projected to Dominate the Market During the Forecast Period
Figure 25 Cereals & Grains Segment to Dominate the Market During the Forecast Period
Figure 26 Geographical Snapshot (2017–2022): Rapidly Growing Markets are Emerging as New Hotspots
Figure 27 North America: Agricultural Surfactants Market Snapshot
Figure 28 South America: Market for Agricultural Surfactants Snapshot
Figure 29 Key Developments By Leading Players in the Market, 2012–2017
Figure 30 Dowdupont: SWOT Analysis
Figure 31 BASF: Company Snapshot
Figure 32 BASF: SWOT Analysis
Figure 33 Akzonobel: Company Snapshot
Figure 34 Akzonobel: SWOT Analysis
Figure 35 Evonik Industries: Company Snapshot
Figure 36 Evonik Industries: SWOT Analysis
Figure 37 Solvay: Company Snapshot
Figure 38 Solvay: SWOT Analysis
Figure 39 Huntsman Corporation: Company Snapshot
Figure 40 Clariant: Company Snapshot
Figure 41 Nufarm: Company Snapshot
Figure 42 Croda International: Company Snapshot
Figure 43 Stepan Company: Company Snapshot


Growth opportunities and latent adjacency in Agricultural Surfactants Market
Does this report provide market numbers for Kenya?
Is market share analysis for Europe available ?