Apheresis Market by Product [Device (Centrifugation, Membrane Separation) Disposable], Procedure (Donor, Therapeutic), Application (Plasmapheresis, Plateletpheresis), Technology, End User (Hospital, Blood Collection Center) & Region - Global Forecasts to 2025


The global apheresis market boasts a total value of $1.7 billion in 2019 and is projected to register a growth rate of 8.1% to reach a value of $2.7 billion by 2025. The market for apheresis is primarily driven by the rising prevalence of chronic diseases and the growing number of and injury cases, the increasing demand for source plasma from biopharmaceutical companies, the rising demand for blood components and growing concerns regarding blood safety, the increase in the number of complex surgical procedures, and the favorable reimbursement for apheresis procedures. However, the high cost of apheresis devices & therapeutic apheresis procedures and installation of apheresis devices through the rental model, fewer blood donations using apheresis due to lack of awareness, and the stringent donor recruitment criteria are factors expected to limit market growth to a certain extent in the coming years.
Helped a medical device leader in identifying revenue potential by tapping into the therapeutic apheresis market across Europe.
Client’s Problem Statement
Our client, one of the key players in the therapeutic apheresis market, was keen on building a substantive therapeutic apheresis business in Europe. The senior management was required to take various crucial decisions – to understand the market share of the company and the market size of equipment and consumables in terms of value and volume. 
MnM Approach
MnM started by identifying key growth opportunities of apheresis systems in different application areas in different countries across Europe and pricing strategies such as outright sales vs reagent and rental models that were changing the revenue mix of our client’s clients in end-use industries such as hospitals and apheresis units across Europe. MnM also interviewed various potential customers in these end-use industries to understand their unmet needs, possible use cases. and benefits from these therapeutic apheresis systems and what they looked for in a product partner.
This helped the global leader assess the market potential and the impact of use cases of enabling technologies such as centrifugation and membrane across these end-use industries. Further, MnM also helped the client build an understanding of the competitive landscape, varying business models, and pricing strategies of different players in the therapeutic apheresis market. The information provided helped them understand their market potential in the therapeutic apheresis market and forge suitable alliances to help them win.
Revenue Impact (RI)
Helped a medical device leader in identifying revenue potential by tapping into the therapeutic apheresis market across Europe.
The centrifugal apheresis devices segment is projected to grow at the highest CAGR during the forecast period
Based on the type of apheresis devices, the market is segmented into centrifugal apheresis devices and membrane separation devices. The centrifugal apheresis devices segment is expected to grow at the highest rate during the forecast period. Factors such as advantages offered by centrifugation over membrane separation and the higher efficiency of centrifugation with the ability to separate all types of blood components are propelling the growth of the centrifugal apheresis devices market.
The therapeutic apheresis segment is projected to grow at the highest CAGR during the forecast period
On the basis of procedure, the apheresis market is segmented into automated blood collection (donor apheresis) and therapeutic apheresis. The therapeutic apheresis segment is expected to grow at the highest rate during the forecast period. Growth in this segment can be attributed to the increasing adoption of apheresis procedures for the treatment of various neurological, blood, and renal diseases, the increasing prevalence of blood disorders, and favorable reimbursement policies for apheresis procedures.
The photopheresis segment is projected to grow at the highest CAGR during the forecast period
On the basis of application, the apheresis market is segmented into plasmapheresis, plateletpheresis, erythrocytapheresis, leukapheresis, photopheresis, and other applications. The photopheresis segment is expected to grow at the highest rate during the forecast period. Growth in this segment can be attributed to the increasing prevalence of blood disorders and the rising demand for photopheresis in organ transplant rejection treatments.
In 2018, the blood collection centers and blood component providers segment accounted for the largest share of the market
Based on end users, the apheresis market is segmented into blood collection centers and blood component providers, hospitals and transfusion centers, and other end users. In 2018, the blood collection centers and blood component providers segment accounted for the largest share of 67.5% of the global market. The large share of this end-user segment is mainly attributed to the rising number of blood component donations, a growing number of blood centers, and increasing awareness of blood collection.
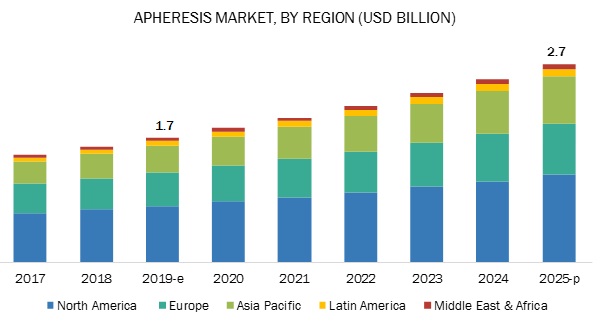
North America accounted for the largest share of the apheresis market in 2018
The global market is segmented into five major regions, namely, North America, Europe, the Asia Pacific (APAC), Latin America, and the Middle East & Africa. In 2018, North America accounted for the largest share of this market. The large share of this region can be attributed to easier access to advanced blood collection technologies, the presence of established healthcare infrastructure, and the increasing presence of leading apheresis companies in the country.
Apheresis Market Key Players
The key players in the global market are Terumo BCT, Inc. (US), Fresenius SE & Co. KGaA (Germany), Haemonetics Corporation (US), Asahi Kasei Medical Co. Ltd. (Japan), B. Braun Melsungen AG (Germany), Baxter International Inc. (US), Cerus Corporation (US), Kaneka Corporation (Japan), Kawasumi Laboratories, Inc. (Japan), and Nikkiso Co., Ltd. (Japan).
Terumo BCT, Inc. (US) is one of the leading players in the global market and accounted for the largest share in 2018. The company is known for its diversified product offerings in the field of apheresis. Terumo’s products include the Spectra Optia, COBE Spectra, and Trima Accel, and these are widely adopted by blood centers, blood component providers, hospitals, and transfusion centers for donor & therapeutic apheresis purposes. The company has a significant global footprint owing to its strong sales and distribution network. Additionally, strong after-sale services such as maintenance and re-installation of instruments gives the firm a competitive advantage over other players in the global market. The company’s extensive R&D activities enable it to increase its depth of capabilities in technologies. Moreover, significant investments also assist the company in launching innovative products in the market space. Terumo BCT continuously focuses on product & technological innovations, further leading to an increase in the company’s overall revenue. The company also focuses on acquiring new consumers through expansions, partnerships, and collaborations in emerging markets such as China, India, and South Korea.
Fresenius SE & Co. KGaA (Germany) Fresenius held the second-largest share of the global apheresis market. The company has maintained its leading position in the market through its strong distribution networks across the Asia Pacific, North America, Europe, Latin America, and the Middle East and Africa. The company offers apheresis systems and related disposables for both donor & therapeutic apheresis through its Fresenius Kabi and Fresenius Medical Care business segments. The company is strengthening its business operations by expanding its presence in emerging markets. For instance, in 2016, Fresenius introduced the AmiCORE apheresis device in Malaysia, Thailand, and Vietnam. The company has a strong product portfolio, and its CE approved products have helped it in further enhancing its presence in the global market.
Apheresis Market Scope
|
Report Metric |
Details |
|
Market size available for years |
2017–2025 |
|
Base year considered |
2018 |
|
Forecast period |
2019–2025 |
|
Forecast units |
Value (USD) |
|
Segments covered |
Product, Technology, Application, Procedure, End User, and Region |
|
Geographies covered |
North America, Europe, Asia Pacific, Latin America, and the Middle East & Africa |
|
Companies covered |
Terumo BCT, Inc. (US), Fresenius SE & Co. KGaA (Germany), Haemonetics Corporation (US), Asahi Kasei Medical Co. Ltd. (Japan), B. Braun Melsungen AG (Germany), Baxter International Inc. (US), Cerus Corporation (US), Kaneka Corporation (Japan), Kawasumi Laboratories, Inc. (Japan), and Nikkiso Co., Ltd. (Japan), among others. |
The research report categorizes the market into the following segments and subsegments:
By Product
-
Products
- Apheresis Disposables
-
Apheresis Devices
- Centrifugal Apheresis Devices
- Membrane Separation Devices
By Procedure
- Automated blood collection (Donor Apheresis)
-
Therapeutic Apheresis
- Therapeutic Apheresis Disposables
-
By Disease Type
- Neurological Disorders
- Blood Disorders
- Renal Disorders
- Autoimmune Disorders
- Metabolic Disorders
- Cardiovascular Disorders
- Other Disorders
- Therapeutic Apheresis Devices
By Technology
-
Centrifugation
- Continuous-flow Centrifugation
- Intermittent-flow Centrifugation
- Membrane Separation
By Application
- Plasmapheresis
- Plateletpheresis
- Erythrocytapheresis
- Leukapheresis
- Photopheresis
- Other Applications
By Region
-
North America
- US
- Canada
-
Europe
- Germany
- UK
- France
- Italy
- Spain
- Rest of Europe (RoE)
-
Asia Pacific
- Japan
- China
- India
- Rest of Asia Pacific (RoAPAC)
-
Latin America
- Brazil
- Mexico
- Rest of Latin America (RoLA)
- Middle East & Africa
Recent Developments
- In July 2019, Baxter International Inc. (US) launched the PrisMax system in the US.
- In June 2019, Toray Medical Co. Ltd. (Japan) launched the TORAMYXIN device in the European region.
- In October 2019, Terumo BCT (US) collaborated with the UniCAR-Therapy Bio-Medicine Technology Co. (China). This collaboration aimed at advancing CAR T-cell therapies by creating a new Shanghai Center of Excellence. This development also helped Terumo widen its applications of apheresis and leukapheresis procedures.
- In August 2017, Fresenius Medical Care (Germany) acquired NxStage Medical, Inc. (US). This acquisition enabled Fresenius Medical Care to further expand its presence in the renal care and critical care area.
Critical questions the report answers:
- Where will these developments take the industry in the mid-to-long term?
- Who are the major end users in the apheresis market, and what are the benefits they avail by implementing apheresis technology?
- What are the recent trends in the apheresis market?
- What are the major market dynamics and their impact on overall market growth?
- What is the global scenario of the apheresis market?
Frequently Asked Questions (FAQs):
What is the size of Apheresis Market?
The global apheresis market boasts a total value of $1.7 billion in 2019 and is projected to register a growth rate of 8.1% to reach a value of $2.7 billion by 2025.
What are the major growth factors of Apheresis Market?
The market for apheresis is primarily driven by the rising prevalence of chronic diseases and the growing number of and injury cases, the increasing demand for source plasma from biopharmaceutical companies, the rising demand for blood components and growing concerns regarding blood safety, the increase in the number of complex surgical procedures, and the favorable reimbursement for apheresis procedures. However, the high cost of apheresis devices & therapeutic apheresis procedures and installation of apheresis devices through the rental model, fewer blood donations using apheresis due to lack of awareness, and the stringent donor recruitment criteria are factors expected to limit market growth to a certain extent in the coming years.
Who all are the prominent players of Apheresis Market?
The key players in the global market are Terumo BCT, Inc. (US), Fresenius SE & Co. KGaA (Germany), Haemonetics Corporation (US), Asahi Kasei Medical Co. Ltd. (Japan), B. Braun Melsungen AG (Germany), Baxter International Inc. (US), Cerus Corporation (US), Kaneka Corporation (Japan), Kawasumi Laboratories, Inc. (Japan), and Nikkiso Co., Ltd. (Japan).
To speak to our analyst for a discussion on the above findings, click Speak to Analyst
Table of Contents
1 Introduction (Page No. - 24)
1.1 Objectives of the Study
1.2 Market Definition and Scope
1.2.1 Markets Covered
1.2.2 Years Considered for the Study
1.3 Currency
1.4 Limitations
1.5 Stakeholders
2 Research Methodology (Page No. - 28)
2.1 Research Approach
2.1.1 Secondary Research
2.1.1.1 Key Data From Secondary Sources
2.1.2 Primary Research
2.1.2.1 Key Data From Primary Sources
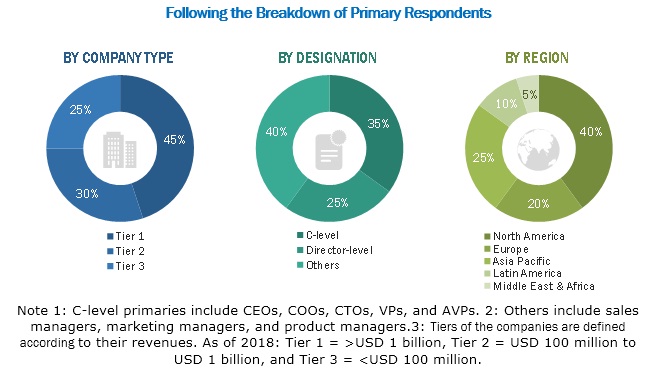
2.1.2.2 Breakdown of Primaries
2.2 Market Size Estimation
2.3 Data Triangulation Approach
2.4 Market Share Estimation
2.4.1 Assumptions for the Study
3 Executive Summary (Page No. - 36)
4 Premium Insights (Page No. - 43)
4.1 Apheresis Market Overview
4.2 Europe: Market, By Application
4.3 Geographic Snapshot of the Global Market (2018)
4.4 Geographic Mix: Global Market, 2019–2025 (USD Million)
4.5 Global Market: Developing vs. Developed Markets, 2019 vs. 2025 (USD Million)
5 Market Overview (Page No. - 47)
5.1 Introduction
5.2 Market Dynamics: Impact Analysis
5.2.1 Drivers
5.2.1.1 Rising Prevalence of Chronic Diseases and Growing Number of Trauma and Injury Cases
5.2.1.2 Increasing Demand for Source Plasma From Biopharmaceutical Companies
5.2.1.3 Rising Demand for Blood Components and Growing Concerns Regarding Blood Safety
5.2.1.4 Increase in the Number of Complex Surgical Procedures
5.2.1.5 Favorable Reimbursement for Apheresis Procedures
5.2.2 Restraints
5.2.2.1 High Cost of Apheresis Devices & Therapeutic Apheresis Procedures and Installation of Apheresis Devices Through Rental Model
5.2.2.2 Fewer Blood Donations Using Apheresis Due to Lack of Awareness
5.2.2.3 Stringent Donor Recruitment Criteria
5.2.3 Opportunities
5.2.3.1 Apheresis for Leukemia and Pediatric Patients
5.2.3.2 Emerging Economies With Increasing Investments From Government Bodies and Leading Players
5.2.4 Challenges
5.2.4.1 Recruitment of Voluntary Non-Remunerated Donors
5.2.4.2 Safety of Blood Transfusion in Developing Countries
6 Industry Insights (Page No. - 56)
6.1 Industry Trends
6.1.1 New Indications for Plasma Products
6.1.2 Increasing Number of Collaborations, Agreements, and Partnerships
6.2 Porter’s Five Force Analysis
6.2.1 Threat From New Entrants
6.2.2 Threat From Substitutes
6.2.3 Bargaining Power of Suppliers
6.2.4 Bargaining Power of Buyers
6.2.5 Intensity of Competitive Rivalry
6.3 Regulatory Analysis
6.3.1 North America
6.3.1.1 US
6.3.1.2 Canada
6.3.2 Europe
6.3.3 Asia Pacific
6.3.3.1 Japan
6.3.3.2 China
6.3.3.3 India
7 Apheresis Market, By Product (Page No. - 64)
7.1 Introduction
7.2 Apheresis Disposables
7.2.1 Recurrent Use of Apheresis Disposables to Drive Growth in This Market Segment
7.3 Apheresis Devices
7.3.1 Centrifugal Apheresis Devices
7.3.1.1 Increasing Installation of Centrifugal Apheresis Devices in Hospitals for Therapeutic Apheresis Drives Market Growth
7.3.2 Membrane Separators
7.3.2.1 Difficulties in Separating Huge Volumes of Plasma From Milliliters of Whole Blood—A Key Factor Limiting the Adoption of These Devices
8 Apheresis Market, By Procedure (Page No. - 73)
8.1 Introduction
8.2 Automated Blood Collection (Donor Apheresis)
8.2.1 Increasing Number of Blood Component Donations Using Apheresis Devices to Support Market Growth
8.3 Therapeutic Apheresis
8.3.1 Therapeutic Apheresis Disposables
8.3.1.1 Neurological Disorders
8.3.1.1.1 Neurological Disorders Hold A Major Share in the Therapeutic Apheresis Disposables Market
8.3.1.2 Blood Disorders
8.3.1.2.1 Increasing Prevalence and Incidence of Hematologic and Genetic Disorders Will Boost the Demand for Therapeutic Apheresis Disposables
8.3.1.3 Renal Disorders
8.3.1.3.1 Therapeutic Plasma Exchange is Regarded as One of the Most Useful Treatment Options for Several Renal Disorders
8.3.1.4 Autoimmune Disorders
8.3.1.4.1 With the Introduction of Novel and Effective Biologic Agents for the Treatment of Various Autoimmune Disorders, Therapeutic Apheresis is Indicated Only in Severe Cases
8.3.1.5 Metabolic Disorders
8.3.1.5.1 Increasing Adoption of Plasmapheresis for the Treatment of Diabetes and Other Metabolic Disorders Drives the Growth of This Segment
8.3.1.6 Cardiovascular Disorders
8.3.1.6.1 Low-Density Lipoprotein (Ldl) Apheresis is Mainly Used in the Treatment of Cardiovascular Disorders
8.3.1.7 Other Disorders
8.3.2 Therapeutic Apheresis Devices
8.3.2.1 Centrifugation-Based Devices are One of the Most Commonly Adopted Therapeutic Apheresis Devices
9 Apheresis Market, By Technology (Page No. - 92)
9.1 Introduction
9.2 Centrifugation
9.2.1 Continuous Flow Centrifugation
9.2.1.1 Continuous Flow is Preferred in Both Blood Collection and Therapeutic Apheresis Procedures
9.2.2 Intermittent Flow Centrifugation
9.2.2.1 The Need for A Single Venipuncture Site is A Major Factor Driving the Demand for Intermittent Flow Centrifugation
9.3 Membrane Separation
9.3.1 Higher Efficacy of This Technology Accounts for Its High Usage in Developed Western European Countries and Japan
10 Apheresis Market, By Application (Page No. - 101)
10.1 Introduction
10.2 Plasmapheresis
10.2.1 Plasmapheresis is the Largest Application Segment in the Global Market
10.3 Plateletpheresis
10.3.1 Increasing Demand for Platelets in Transfusions to Drive Market Growth
10.4 Erythrocytapheresis
10.4.1 Increasing Demand for Red Blood Cells for Transfusion in Surgical Procedures to Drive Market Growth
10.5 Leukapheresis
10.5.1 Increasing Incidence and Prevalence of Leukemia to Drive the Leukapheresis Market
10.6 Photopheresis
10.6.1 Photopheresis is Expected to Grow at the Highest CAGR During the Forecast Period
10.7 Other Applications
11 Apheresis Market, By End User (Page No. - 112)
11.1 Introduction
11.2 Blood Collection Centers & Blood Component Providers
11.2.1 Blood Collection Centers and Blood Component Providers Hold A Major Share of the Global Market
11.3 Hospitals and Transfusion Centers
11.3.1 Hospitals and Transfusion Centers Segment is Expected to Grow at the Highest CAGR During the Forecast Period
11.4 Other End Users
12 Apheresis Market, By Region (Page No. - 118)
12.1 Introduction
12.2 North America
12.2.1 US
12.2.1.1 The US Dominates the North American Market
12.2.2 Canada
12.2.2.1 The Demand for Plasma Protein Products in Canada is on the Rise, Which is A Key Factor Driving Market Growth
12.3 Europe
12.3.1 Germany
12.3.1.1 Germany is the Fastest-Growing Market for Apheresis in Europe
12.3.2 France
12.3.2.1 Increasing Need for Blood Components to Drive the Market for Apheresis in France
12.3.3 Italy
12.3.3.1 Therapeutic Plasma Exchange and Ldl Apheresis are Widely Adopted Therapeutic Apheresis Procedures, Thereby Driving Market Growth in Italy
12.3.4 UK
12.3.4.1 Increasing Demand for Source Plasma to Cater to the Growing Consumption of Plasma-Derived Products (Ivig) Driving Global Market Growth in the UK
12.3.5 Spain
12.3.5.1 Growing Demand for Blood Components and Plasma-Derived Products for the Treatment of Chronic Diseases in the Elderly is A Key Factor Driving Market Growth in Spain
12.3.6 Rest of Europe
12.4 Asia Pacific
12.4.1 China
12.4.1.1 China Accounts for the Largest Share of the APAC Market
12.4.2 Japan
12.4.2.1 Increasing Demand for Technologically Advanced Products Drives the Market Growth in Japan
12.4.3 India
12.4.3.1 In India, the Increasing Demand for Blood Components and Growing Applications of Plasma Derivatives are Major Factors Driving the Growth of the Global Market
12.4.4 Rest of Asia Pacific
12.5 Latin America
12.5.1 Brazil
12.5.1.1 Brazil Offers Lucrative Growth Opportunities in the Global Market Due to an Increasing Number of Blood and Plasma Donations
12.5.2 Mexico
12.5.2.1 Rapidly Growing Geriatric Population is A Key Factor Driving Market Growth in Mexico
12.5.3 Rest of Latin America
12.6 Middle East & Africa
13 Competitive Landscape (Page No. - 199)
13.1 Overview
13.2 Market Share Analysis
13.2.1 Global Apheresis Market Share Analysis
13.2.2 Global Centrifugation Market Share Analysis
13.2.3 Global Membrane Separation Market Share Analysis
13.3 Competitive Leadership Mapping
13.3.1 Visionary Leaders
13.3.2 Innovators
13.3.3 Dynamic Differentiators
13.3.4 Emerging Companies
13.4 Competitive Situation and Trends
13.4.1 Product Launches & Approvals
13.4.2 Expansions
13.4.3 Partnerships, Agreements, and Collaborations
13.4.4 Acquisitions
14 Company Profiles (Page No. - 208)
(Business Overview, Products Offered, Recent Developments, Strategic Overview, Competitive Analysis)*
14.1 Terumo BCT, Inc.
14.2 Fresenius Se & Co. KGaA
14.3 Haemonetics Corporation
14.4 Baxter International Inc.
14.5 Asahi Kasei Medical Co. Ltd. (A Subsidiary of Asahi Kasei Corporation)
14.6 B. Braun Melsungen AG
14.7 Cerus Corporation
14.8 Kaneka Corporation
14.9 Kawasumi Laboratories, Inc.
14.1 Nikkiso Co., Ltd.
14.11 Macopharma SA
14.12 Miltenyi Biotec
14.13 Otsuka Holdings Co., Ltd.
14.14 Medica Spa
14.15 Mallinckrodt Plc
14.16 Medicap Clinic GmbH
14.17 LMB Technologie GmbH
14.18 Bioelettronica Srl
14.19 Infomed
14.20 Cytosorbents Corporation
14.21 Toray Medical Co., Ltd.
*Details on Business Overview, Products Offered, Recent Developments, Strategic Overview, Competitive Analysis Might Not Be Captured in Case of Unlisted Companies.
15 Appendix (Page No. - 250)
15.1 Insights From Industry Experts
15.2 Discussion Guide
15.3 Knowledge Store: Marketsandmarkets’ Subscription Portal
15.4 Available Customizations
15.5 Related Reports
15.6 Author Details
List of Tables (268 Tables)
Table 1 Required Units of Blood and Blood Components, By Type of Surgery
Table 2 US: Payment Rates for Apheresis Procedures, 2016–2018
Table 3 Estimated Blood Donations By Who Region, 2013
Table 4 Frequency of Blood Donations From Healthy Donors
Table 5 Apheresis Market, By Product, 2017–2025 (USD Million)
Table 6 Apheresis Disposables Market, By Country, 2017–2025 (USD Million)
Table 7 Apheresis Devices Market, By Type, 2017–2025 (USD Million)
Table 8 Apheresis Devices Market, By Country, 2017–2025 (USD Million)
Table 9 List of Centrifugal Apheresis Devices Available in the Market
Table 10 Centrifugal Apheresis Devices Market, By Country, 2017–2025 (USD Million)
Table 11 List of Membrane Separators Available in the Market
Table 12 Membrane Separators Market, By Country, 2017–2025 (USD Million)
Table 13 Global Market, By Procedure, 2017–2025 (USD Million)
Table 14 Apheresis Devices Used for Automated Blood Collection Procedures
Table 15 Automated Blood Collection (Donor Apheresis) Market, By Country, 2017–2025 (USD Million)
Table 16 Therapeutic Apheresis Market, By Product, 2017–2025 (USD Million)
Table 17 Therapeutic Apheresis Market By Country, 2017–2025 (USD Million)
Table 18 Therapeutic Apheresis Disposables Market, By Disease Type, 2017–2025 (USD Million)
Table 19 Therapeutic Apheresis Disposables Market, By Country, 2017–2025 (USD Million)
Table 20 Neurological Disorders Treated Using Therapeutic Apheresis
Table 21 Neurological Disorders: Estimated Dalys, By Region, 2015 vs. 2030
Table 22 Therapeutic Apheresis Disposables Market for Neurological Disorders, By Country, 2017–2025 (USD Million)
Table 23 Therapeutic Apheresis Disposables Market for Blood Disorders, By Country, 2017–2025 (USD Million)
Table 24 Therapeutic Apheresis Disposables Market for Renal Disorders, By Country, 2017–2025 (USD Million)
Table 25 Therapeutic Apheresis Disposables Market for Autoimmune Disorders, By Country, 2017–2025 (USD Million)
Table 26 Metabolic Disorders: Estimated Dalys By Region, 2015 vs. 2030 (Thousands)
Table 27 Therapeutic Apheresis Disposables Market for Metabolic Disorders, By Country, 2017–2025 (USD Million)
Table 28 Cardiovascular Disorders: Estimated Dalys By Region, 2015 vs. 2030 (Thousands)
Table 29 Therapeutic Apheresis Disposables Market for Cardiovascular Disorders, By Country, 2017–2025 (USD Million)
Table 30 Therapeutic Apheresis Disposables Market for Other Disorders, By Country, 2017–2025 (USD Million)
Table 31 Key Products Available in the Market for Therapeutic Apheresis
Table 32 Therapeutic Apheresis Devices Market, By Country, 2017–2025 (USD Million)
Table 33 Centrifugation vs. Membrane Separation
Table 34 Global Market, By Technology, 2017–2025 (USD Million)
Table 35 Continuous Flow Centrifugation vs. Intermittent Flow Centrifugation
Table 36 Centrifugation Market: Key Players and Products
Table 37 Centrifugation Market, By Type, 2017–2025 (USD Million)
Table 38 Centrifugation Market, By Country, 2017–2025 (USD Million)
Table 39 Continuous Flow Centrifugation Market, By Country, 2017–2025 (USD Million)
Table 40 Intermittent Flow Centrifugation Market, By Country, 2017–2025 (USD Million)
Table 41 Size of Blood Components
Table 42 Membrane Separation Market: Key Players and Products
Table 43 Membrane Separation Market, By Country, 2017–2025 (USD Million)
Table 44 Global Market, By Application, 2017–2025 (USD Million)
Table 45 Total Source Plasma Collection in the Us & Europe, 2007–2017 (Million Liters)
Table 46 Key Products Available for Plasmapheresis and Therapeutic Plasma Exchange
Table 47 Global Market for Plasmapheresis, By Country, 2017–2025 (USD Million)
Table 48 Key Products Available for Plateletpheresis
Table 49 Global Market for Plateletpheresis, By Country, 2017–2025 (USD Million)
Table 50 Key Products Available for Erythrocytapheresis
Table 51 Global Market for Erythrocytapheresis, By Country, 2017–2025 (USD Million)
Table 52 Key Products Available for Leukapheresis
Table 53 Global Market for Leukapheresis, By Country, 2017–2025 (USD Million)
Table 54 Key Products Available for Photopheresis
Table 55 Global Market for Photopheresis, By Country, 2017–2025 (USD Million)
Table 56 Key Products Available for Other Applications of Apheresis
Table 57 Global Market for Other Applications, By Country, 2017–2025 (USD Million)
Table 58 Global Market, By End User, 2017–2025 (USD Million)
Table 59 Global Market for Blood Collection Centers and Blood Component Providers, By Country, 2017–2025 (USD Million)
Table 60 Number of Hospitals Performing Blood Transfusions, By Region, 2015
Table 61 Global Market for Hospitals and Transfusion Centers, By Country, 2017–2025 (USD Million)
Table 62 Global Market for Other End Users, By Country, 2017–2025 (USD Million)
Table 63 Global Market, By Region, 2017–2025 (USD Million)
Table 64 North America: Hemophilia Patients, 2013 vs. 2017
Table 65 North America: Apheresis Market, By Country, 2017–2025 (USD Million)
Table 66 North America: Market, By Product, 2017–2025 (USD Million)
Table 67 North America: Apheresis Devices Market, By Type, 2017–2025 (USD Million)
Table 68 North America: Market, By Procedure, 2017–2025 (USD Million)
Table 69 North America: Therapeutic Apheresis Market, By Product, 2017–2025 (USD Million)
Table 70 North America: Therapeutic Apheresis Disposables Market, By Disease Type, 2017–2025 (USD Million)
Table 71 North America: Market, By Technology, 2017–2025 (USD Million)
Table 72 North America: Centrifugation Apheresis Market, By Type, 2017–2025 (USD Million)
Table 73 North America: Market, By Application, 2017–2025 (USD Million)
Table 74 North America: Market, By End User, 2017–2025 (USD Million)
Table 75 US: Key Macroindicators for the Apheresis Market
Table 76 US: Market, By Product, 2017–2025 (USD Million)
Table 77 US: Apheresis Devices Market, By Type, 2017–2025 (USD Million)
Table 78 US: Market, By Procedure, 2017–2025 (USD Million)
Table 79 US: Therapeutic Apheresis Market, By Product, 2017–2025 (USD Million)
Table 80 US: Therapeutic Apheresis Disposables Market, By Disease Type, 2017–2025 (USD Million)
Table 81 US: Market, By Technology, 2017–2025 (USD Million)
Table 82 US: Centrifugation Apheresis Market, By Type, 2017–2025 (USD Million)
Table 83 US: Market, By Application, 2017–2025 (USD Million)
Table 84 US: Market, By End User, 2017–2025 (USD Million)
Table 85 Canada: Key Macroindicators for the Apheresis Market
Table 86 Canada: Market, By Product, 2017–2025 (USD Million)
Table 87 Canada: Apheresis Devices Market, By Type, 2017–2025 (USD Million)
Table 88 Canada: Market, By Procedure, 2017–2025 (USD Million)
Table 89 Canada: Therapeutic Apheresis Market, By Product, 2017–2025 (USD Million)
Table 90 Canada: Therapeutic Apheresis Disposables Market, By Disease Type, 2017–2025 (USD Million)
Table 91 Canada: Market, By Technology, 2017–2025 (USD Million)
Table 92 Canada: Centrifugation Apheresis Market, By Type, 2017–2025 (USD Million)
Table 93 Canada: Market, By Application, 2017–2025 (USD Million)
Table 94 Canada: Market, By End User, 2017–2025 (USD Million)
Table 95 Collections of Blood Components Using Apheresis Across European Countries in 2013
Table 96 Europe: Apheresis Market, By Country, 2017–2025 (USD Million)
Table 97 Europe: Market, By Product, 2017–2025 (USD Million)
Table 98 Europe: Apheresis Devices Market, By Type, 2017–2025 (USD Million)
Table 99 Europe: Market, By Procedure, 2017–2025 (USD Million)
Table 100 Europe: Therapeutic Apheresis Market, By Product, 2017–2025 (USD Million)
Table 101 Europe: Therapeutic Apheresis Disposables Market, By Disease Types, 2017–2025 (USD Million)
Table 102 Europe: Market, By Technology, 2017–2025 (USD Million)
Table 103 Europe: Centrifugation Apheresis Market, By Type, 2017–2025 (USD Million)
Table 104 Europe: Market, By Application, 2017–2025 (USD Million)
Table 105 Europe: Market, By End User, 2017–2025 (USD Million)
Table 106 Increasing Healthcare Expenditure in Germany, 2015–2017 (USD Million)
Table 107 Germany: Key Macroindicators for the Apheresis Market
Table 108 Germany: Market, By Product, 2017–2025 (USD Million)
Table 109 Germany: Apheresis Devices Market, By Type, 2017–2025 (USD Million)
Table 110 Germany: Market, By Procedure, 2017–2025 (USD Million)
Table 111 Germany: Therapeutic Apheresis Market, By Product, 2017–2025 (USD Million)
Table 112 Germany: Therapeutic Apheresis Disposables Market, By Disease Type, 2017–2025 (USD Million)
Table 113 Germany: Market, By Technology, 2017–2025 (USD Million)
Table 114 Germany: Centrifugation Apheresis Market, By Type, 2017–2025 (USD Million)
Table 115 Germany: Market, By Application, 2017–2025 (USD Million)
Table 116 Germany: Market, By End User, 2017–2025 (USD Million)
Table 117 France: Key Macroindicators for the Apheresis Market
Table 118 France: Market, By Product, 2017–2025 (USD Million)
Table 119 France: Apheresis Devices Market, By Type, 2017–2025 (USD Million)
Table 120 France: Market, By Procedure, 2017–2025 (USD Million)
Table 121 France: Therapeutic Apheresis Market, By Product 2017–2025 (USD Million)
Table 122 France: Therapeutic Apheresis Disposables Market, By Disease Type, 2017–2025 (USD Million)
Table 123 France: Market, By Technology, 2017–2025 (USD Million)
Table 124 France: Centrifugation Apheresis Market, By Type, 2017–2025 (USD Million)
Table 125 France: Market, By Application, 2017–2025 (USD Million)
Table 126 France: Market, By End User, 2017–2025 (USD Million)
Table 127 Italy: Key Macroindicators for the Apheresis Market
Table 128 Italy: Market, By Product, 2017–2025 (USD Million)
Table 129 Italy: Apheresis Devices Market, By Type, 2017–2025 (USD Million)
Table 130 Italy: Market, By Procedure, 2017–2025 (USD Million)
Table 131 Italy: Therapeutic Apheresis Market, By Product, 2017–2025 (USD Million)
Table 132 Italy: Therapeutic Apheresis Disposables Market, By Disease Type, 2017–2025 (USD Million)
Table 133 Italy: Market, By Technology, 2017–2025 (USD Million)
Table 134 Italy: Centrifugation Apheresis Market, By Type, 2017–2025 (USD Million)
Table 135 Italy: Market, By Application, 2017–2025 (USD Million)
Table 136 Italy: Market, By End User, 2017–2025 (USD Million)
Table 137 UK: Key Macroindicators for the Apheresis Market
Table 138 UK: Market, By Product, 2017–2025 (USD Million)
Table 139 UK: Apheresis Devices Market, By Type, 2017–2025 (USD Million)
Table 140 UK: Market, By Procedure, 2017–2025 (USD Million)
Table 141 UK: Therapeutic Apheresis Market, By Product, 2017–2025 (USD Million)
Table 142 UK: Therapeutic Apheresis Disposables Market, By Disease Type, 2017–2025 (USD Million)
Table 143 UK: Market, By Technology, 2017–2025 (USD Million)
Table 144 UK: Centrifugation Apheresis Market, By Type, 2017–2025 (USD Million)
Table 145 UK: Market, By Application, 2017–2025 (USD Million)
Table 146 UK: Market, By End User, 2017–2025 (USD Million)
Table 147 Spain: Key Macroindicators for the Apheresis Market
Table 148 Spain: Market, By Product, 2017–2025 (USD Million)
Table 149 Spain: Apheresis Devices Market, By Type, 2017–2025 (USD Million)
Table 150 Spain: Market, By Procedure, 2017–2025 (USD Million)
Table 151 Spain: Therapeutic Apheresis Market, By Product, 2017–2025 (USD Million)
Table 152 Spain: Therapeutic Apheresis Disposables Market, By Disease Type, 2017–2025 (USD Million)
Table 153 Spain: Market, By Technology, 2017–2025 (USD Million)
Table 154 Spain: Centrifugation Apheresis Market, By Type, 2017–2025 (USD Million)
Table 155 Spain: Market, By Application, 2017–2025 (USD Million)
Table 156 Spain: Market, By End User, 2017–2025 (USD Million)
Table 157 RoE: Apheresis Market, By Product, 2017–2025 (USD Million)
Table 158 RoE: Apheresis Devices Market, By Type, 2017–2025 (USD Million)
Table 159 RoE: Market, By Procedure, 2017–2025 (USD Million)
Table 160 RoE: Therapeutic Apheresis Market, By Product, 2017–2025 (USD Million)
Table 161 RoE: Therapeutic Apheresis Disposables Market, By Disease Type, 2017–2025 (USD Million)
Table 162 RoE: Market, By Technology, 2017–2025 (USD Million)
Table 163 RoE: Centrifugation Apheresis Market, By Type, 2017–2025 (USD Million)
Table 164 RoE: Market, By Application, 2017–2025 (USD Million)
Table 165 RoE: Market, By End User, 2017–2025 (USD Million)
Table 166 Asia Pacific: Apheresis Market, By Country, 2017–2025 (USD Million)
Table 167 Asia Pacific: Market, By Product, 2017–2025 (USD Million)
Table 168 Asia Pacific: Apheresis Devices Market, By Type, 2017–2025 (USD Million)
Table 169 Asia Pacific: Market, By Procedure, 2017–2025 (USD Million)
Table 170 Asia Pacific: Therapeutic Apheresis Market, By Product, 2017–2025 (USD Million)
Table 171 Asia Pacific: Therapeutic Apheresis Disposables Market, By Disease Type, 2017–2025 (USD Million)
Table 172 Asia Pacific: Market, By Technology, 2017–2025 (USD Million)
Table 173 Asia Pacific: Centrifugation Apheresis Market, By Type, 2017–2025 (USD Million)
Table 174 Asia Pacific: Market, By Application, 2017–2025 (USD Million)
Table 175 Asia Pacific: Market, By End User, 2017–2025 (USD Million)
Table 176 China: Key Macroindicators for the Apheresis Market
Table 177 China: Apheresis Market, By Product, 2017–2025 (USD Million)
Table 178 China: Apheresis Devices Market, By Type, 2017–2025 (USD Million)
Table 179 China: Market, By Procedure, 2017–2025 (USD Million)
Table 180 China: Therapeutic Apheresis Market, By Product, 2017–2025 (USD Million)
Table 181 China: Therapeutic Apheresis Disposables Market, By Disease Type, 2017–2025 (USD Million)
Table 182 China: Market, By Technology, 2017–2025 (USD Million)
Table 183 China: Centrifugation Apheresis Market, By Type, 2017–2025 (USD Million)
Table 184 China: Market, By Application, 2017–2025 (USD Million)
Table 185 China: Market, By End User, 2017–2025 (USD Million)
Table 186 Blood Donations in Japan, By Type of Donation, 2015
Table 187 Japan: Key Macroindicators for the Apheresis Market
Table 188 Japan: Market, By Product, 2017–2025 (USD Million)
Table 189 Japan: Apheresis Devices Market, By Type, 2017–2025 (USD Million)
Table 190 Japan: Market, By Procedure, 2017–2025 (USD Million)
Table 191 Japan: Therapeutic Apheresis Market, By Product, 2017–2025 (USD Million)
Table 192 Japan: Therapeutic Apheresis Disposables Market, By Disease Type, 2017–2025 (USD Million)
Table 193 Japan: Market, By Technology, 2017–2025 (USD Million)
Table 194 Japan: Centrifugation Apheresis Market, By Type, 2017–2025 (USD Million)
Table 195 Japan: Market, By Application, 2017–2025 (USD Million)
Table 196 Japan:Market, By End User, 2017–2025 (USD Million)
Table 197 India: Key Macroindicators for the Apheresis Market
Table 198 India: Market, By Product, 2017–2025 (USD Million)
Table 199 India: Apheresis Devices Market, By Type, 2017–2025 (USD Million)
Table 200 India: Market, By Procedure, 2017–2025 (USD Million)
Table 201 India: Therapeutic Apheresis Market, By Product, 2017–2025 (USD Million)
Table 202 India: Therapeutic Apheresis Disposables Market, By Disease Type, 2017–2025 (USD Million)
Table 203 India: Market, By Technology, 2017–2025 (USD Million)
Table 204 India: Centrifugation Apheresis Market, By Type, 2017–2025 (USD Million)
Table 205 India: Market, By Application, 2017–2025 (USD Million)
Table 206 India: Market, By End User, 2017–2025 (USD Million)
Table 207 RoAPAC: Apheresis Market, By Product, 2017–2025 (USD Million)
Table 208 RoAPAC: Apheresis Devices Market, By Type, 2017–2025 (USD Million)
Table 209 RoAPAC: Market, By Procedure, 2017–2025 (USD Million)
Table 210 RoAPAC: Therapeutic Apheresis Market, By Product, 2017–2025 (USD Million)
Table 211 RoAPAC: Therapeutic Apheresis Disposables Market, By Disease Type, 2017–2025 (USD Million)
Table 212 RoAPAC: Market, By Technology, 2017–2025 (USD Million)
Table 213 RoAPAC: Centrifugation Apheresis Market, By Type, 2017–2025 (USD Million)
Table 214 RoAPAC: Market, By Application, 2017–2025 (USD Million)
Table 215 RoAPAC: Market, By End User, 2017–2025 (USD Million)
Table 216 Latin America: Apheresis Market, By Country, 2017–2025 (USD Million)
Table 217 Latin America: Market, By Product, 2017–2025 (USD Million)
Table 218 Latin America: Apheresis Devices Market, By Type, 2017–2025 (USD Million)
Table 219 Latin America: Market, By Procedure, 2017–2025 (USD Million)
Table 220 Latin America: Therapeutic Apheresis Market, By Product, 2017–2025 (USD Million)
Table 221 Latin America: Therapeutic Apheresis Disposables Market, By Disease Type, 2017–2025 (USD Million)
Table 222 Latin America: Market, By Technology, 2017–2025 (USD Million)
Table 223 Latin America: Centrifugation Apheresis Market, By Type, 2017–2025 (USD Million)
Table 224 Latin America: Market, By Application, 2017–2025 (USD Million)
Table 225 Latin America: Market, By End User, 2017–2025 (USD Million)
Table 226 Brazil: Key Macroindicators for the Apheresis Market
Table 227 Brazil: Market, By Product, 2017–2025 (USD Million)
Table 228 Brazil: Apheresis Devices Market, By Type, 2017–2025 (USD Million)
Table 229 Brazil: Market, By Procedure, 2017–2025 (USD Million)
Table 230 Brazil: Therapeutic Apheresis Market, By Product, 2017–2025 (USD Million)
Table 231 Brazil: Therapeutic Apheresis Disposables Market, By Disease Type, 2017–2025 (USD Million)
Table 232 Brazil: Market, By Technology, 2017–2025 (USD Million)
Table 233 Brazil: Centrifugation Apheresis Market, By Type, 2017–2025 (USD Million)
Table 234 Brazil: Market, By Application, 2017–2025 (USD Million)
Table 235 Brazil: Market, By End User, 2017–2025 (USD Million)
Table 236 Mexico: Key Macroindicators for the Apheresis Market
Table 237 Mexico: Market, By Product, 2017–2025 (USD Million)
Table 238 Mexico: Apheresis Devices Market, By Type, 2017–2025 (USD Million)
Table 239 Mexico: Market, By Procedure, 2017–2025 (USD Million)
Table 240 Mexico: Therapeutic Apheresis Market, By Product, 2017–2025 (USD Million)
Table 241 Mexico: Therapeutic Apheresis Disposables Market, By Disease Type, 2017–2025 (USD Million)
Table 242 Mexico: Market, By Technology, 2017–2025 (USD Million)
Table 243 Mexico: Centrifugation Apheresis Market, By Type, 2017–2025 (USD Million)
Table 244 Mexico: Market, By Application, 2017–2025 (USD Million)
Table 245 Mexico: Market, By End User, 2017–2025 (USD Million)
Table 246 Rola: Apheresis Market, By Product, 2017–2025 (USD Million)
Table 247 Rola: Apheresis Devices Market, By Type, 2017–2025 (USD Million)
Table 248 Rola: Market, By Procedure, 2017–2025 (USD Million)
Table 249 Rola: Therapeutic Apheresis Market, By Product, 2017–2025 (USD Million)
Table 250 Rola: Therapeutic Apheresis Disposables Market, By Disease Type, 2017–2025 (USD Million)
Table 251 Rola: Market, By Technology, 2017–2025 (USD Million)
Table 252 Rola: Centrifugation Apheresis Market, By Type, 2017–2025 (USD Million)
Table 253 Rola: Market, By Application, 2017–2025 (USD Million)
Table 254 Rola: Market, By End User, 2017–2025 (USD Million)
Table 255 MEA: Apheresis Market, By Product, 2017–2025 (USD Million)
Table 256 MEA: Apheresis Devices Market, By Type, 2017–2025 (USD Million)
Table 257 MEA: Market, By Procedure, 2017–2025 (USD Million)
Table 259 MEA: Therapeutic Apheresis Disposables Market, By Disease Type, 2017–2025 (USD Million)
Table 260 MEA: Market, By Technology, 2017–2025 (USD Million)
Table 261 MEA: Centrifugation Apheresis Market, By Type, 2017–2025 (USD Million)
Table 262 MEA: Market, By Application, 2017–2025 (USD Million)
Table 263 MEA: Market, By End User, 2017–2025 (USD Million)
Table 264 Product Launches & Approvals (2017–2019)
Table 265 Expansions (2017–2019)
Table 266 Partnerships, Agreements, and Collaborations (2017–2019)
Table 267 Acquisitions (2017)
Table 268 Other Strategies (2018–2019)
List of Figures (54 Figures)
Figure 1 Apheresis Market
Figure 2 Research Design
Figure 3 Breakdown of Primary Interviews: By Company Type, Designation, and Region
Figure 4 Bottom-Up Approach
Figure 5 Top-Up Approach
Figure 6 Data Triangulation Methodology
Figure 7 Global Market, By Product, 2019 vs. 2025 (USD Million)
Figure 8 Apheresis Devices Market, By Type, 2019 vs. 2025 (USD Million)
Figure 9 Global Market, By Procedure, 2019 vs. 2025 (USD Million)
Figure 10 Therapeutic Apheresis Procedures Market, By Product, 2019 vs. 2025 (USD Million)
Figure 11 Therapeutic Apheresis Disposables Market, By Disease Type, 2019 vs. 2025 (USD Million)
Figure 12 Global Market, By Technology, 2019 vs. 2025 (USD Million)
Figure 13 Centrifugation Apheresis Market, By Type, 2019 vs. 2025 (USD Million)
Figure 14 Global Market, By Application, 2019 vs. 2025 (USD Million)
Figure 15 Global Market, By End User, 2019 vs. 2025 (USD Million)
Figure 16 Geographic Snapshot: Global Market
Figure 17 Rising Prevalence of Diseases and the Growing Number of Trauma and Injury Cases to Drive Market Growth
Figure 18 Plasmapheresis Accounted for the Largest Share of the European Market in 2018
Figure 19 The US Accounted for the Largest Share of the Market in 2018
Figure 20 APAC to Grow at the Highest CAGR During the Forecast Period
Figure 21 Developing Markets to Register Higher Growth During the Forecast Period
Figure 22 Number of People With Chronic Conditions in the US, 1995–2030 (Million Individuals)
Figure 23 Type of Plasma Processed Worldwide, 1990–2014 (Million Liters)
Figure 24 Porter’s Five Forces Analysis (2018): Global Market
Figure 25 Apheresis Disposables to Dominate the Global Market During the Forecast Period
Figure 26 Automated Blood Collection Accounted for the Largest Share of the Global Market During the Forecast Period
Figure 27 Therapeutic Apheresis Disposables to Dominate the Therapeutic Apheresis Market During the Forecast Period
Figure 28 Neurological Disorders to Account for the Largest Share of the Therapeutic Apheresis Disposables Market During the Forecast Period
Figure 29 Centrifugation Segment to Dominate the Global Market During the Forecast Period
Figure 30 Blood Collection Centers and Blood Component Providers Segment to Dominate the Global Market During the Forecast Period
Figure 31 Global Market: Geographic Snapshot (2018)
Figure 32 North America: Market Snapshot
Figure 33 Europe: Market Snapshot
Figure 34 Asia Pacific: Market Snapshot
Figure 35 Key Growth Strategies Adopted By Market Players From 2017 to 2019
Figure 36 Global Market Share, By Key Player, 2018
Figure 37 Global Centrifugation Market Share, By Key Player, 2018
Figure 38 Global Membrane Separation Market Share, By Key Player, 2018
Figure 39 Global Market: Competitive Leadership Mapping (2018)
Figure 40 Terumo BCT, Inc.: Company Snapshot (2018)
Figure 41 Fresenius Medical Care: Company Snapshot (2018)
Figure 42 Fresenius Kabi: Company Snapshot (2018)
Figure 43 Haemonetics Corporation: Company Snapshot (2019)
Figure 44 Baxter International: Company Snapshot (2018)
Figure 45 Asahi Kasei Corporation: Company Snapshot (2018)
Figure 46 B. Braun: Company Snapshot (2018)
Figure 47 Cerus Corporation: Company Snapshot (2018)
Figure 48 Kaneka Corporation: Company Snapshot (2019)
Figure 49 Kawasumi Laboratories: Company Snapshot (2019)
Figure 50 Nikkiso Co., Ltd.: Company Snapshot (2018)
Figure 51 Otsuka Holdings Company Limited: Company Snapshot (2018)
Figure 52 Mallinckrodt Plc : Company Snapshot (2018)
Figure 53 Cytosorbents Corporation: Company Snapshot (2018)
Figure 54 Toray Medical Co. Ltd.: Company Snapshot (2019)
This study involved the extensive use of both primary and secondary sources. The research process involved the study of various factors affecting the industry to identify the segmentation types, industry trends, key players, competitive landscape, key market dynamics, and key player strategies.
Secondary Research
The secondary research process involves the widespread use of secondary sources, directories, databases (such as Bloomberg Businessweek, Factiva, and D&B), white papers, annual reports, companies house documents, investor presentations, and SEC filings of companies. Secondary research was used to identify and collect information useful for the extensive, technical, market-oriented, and commercial study of the apheresis market. It was also used to obtain important information about the key players and market classification & segmentation according to industry trends to the bottom-most level, and key developments related to market and technology perspectives. A database of the key industry leaders was also prepared using secondary research.
Primary Research
In the primary research process, industry experts from both the supply and demand sides were interviewed to obtain qualitative and quantitative information for this report. Industry experts from the supply side include CEOs, vice presidents, marketing and sales directors, product managers, business development managers, technology and innovation directors of companies providing apheresis, key opinion leaders, and suppliers and distributors. The industry experts from the demand side include hospitals, blood collection centers, transfusion clinics, and healthcare payers.
To know about the assumptions considered for the study, download the pdf brochure
Apheresis Market Size Estimation
The market size estimates and forecasts provided in this study are derived through a mix of the bottom-up approach (revenue share analysis of leading players) and top-down approach (assessment of utilization/adoption/penetration trends, by product, technology, application, procedure, end user, and region).
Data Triangulation
After arriving at the market size, the total apheresis market was divided into several segments and subsegments. To complete the overall market engineering process and arrive at the exact statistics for all segments & subsegments, data triangulation and market breakdown procedures were employed, wherever applicable.
Objectives of the Study
- To define, describe, and forecast the global apheresis market by product, technology, application, procedure, end user, and region
- To provide detailed information about the factors influencing the market growth (drivers, restraints, opportunities, and challenges)
- To analyze micro markets with respect to individual growth trends, prospects, and contributions to the overall market
- To analyze market opportunities for stakeholders and provide details of the competitive landscape for key players
- To forecast the size of the apheresis market in five regions (along with major countries)—North America, Europe, the Asia Pacific, Latin America, and the Middle East & Africa.
- To profile key players in the apheresis market and comprehensively analyze their core competencies and market shares
- To track and analyze competitive developments such as acquisitions; new product launches; collaborations, partnerships, and agreements; and R&D activities of the leading players in the global apheresis market
Available Customizations
With the given market data, MarketsandMarkets offers customizations as per the company’s specific needs. The following customization options are available for the report:
Company Information
- Detailed analysis and profiling of additional market players
Geographic Analysis
- Further breakdown of the Rest of Asia Pacific apheresis market into South Korea, Australia, New Zealand, and other countries
- Further breakdown of the Rest of Europe apheresis market into Belgium, Russia, the Netherlands, Switzerland, and other countries
- Further breakdown of the Rest of Latin America apheresis market into Argentina, Peru, Chile, and others

 Generating Response ...


Growth opportunities and latent adjacency in Apheresis Market