Automotive Coatings Market

Automotive Coatings Market by Resin Type (Polyurethane, Epoxy, Acrylic, and Others), Technology (Solvent-based, Water-based, and Powder-based), Coat Type (Clearcoat, Basecoat, Primer, and E-coat), and Region - Global Forecast to 2027

Report Code: CH 4570 Dec, 2022, by marketsandmarkets.com

Automotive Coatings Market

The global automotive coatings market was valued at USD 15.0 billion in 2022 and is projected to reach USD 18.6 billion by 2027, growing at a cagr 4.3% from 2022 to 2027. The automotive coatings sector evolved with the automobile industry. Both businesses are constantly evolving in order to give sophisticated technology and products that are sustainable to their customers. Automobile coatings demand is largely determined by demand patterns in the automotive sector, environmental legislation, health and safety standards, buyer preferences, lifestyle, and the rising economy. These variables have a favourable influence on the automotive coatings business and aid in its growth. Aside from looks, automobile coatings serve a significant function in protecting vehicle metal surfaces against rust and other hazards. Attractive colours, textures, and patterns make automobiles more appealing, which can be a deciding factor for customers.

Attractive Opportunities in Automotive Coatings Market
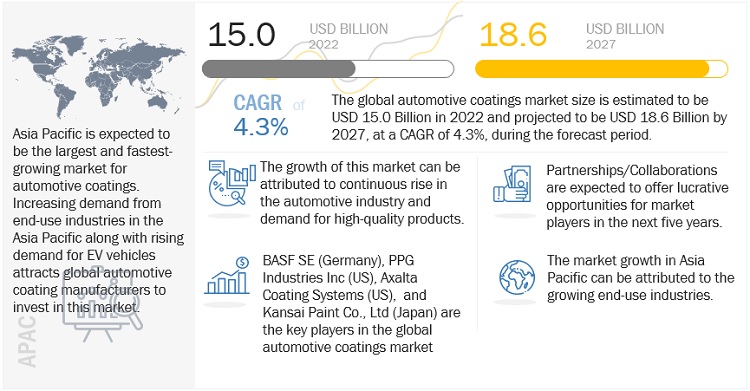
Automotive Coating Market

Source: Interviews with Experts, Secondary Research, and MarketsandMarkets Analysis

To know about the assumptions considered for the study, Request for Free Sample Report

Automotive Coatings Market Dynamics

Driver: Green, environment-friendly, and healthier coating systems

According to International Organization of Motor Vehicle Manufacturers (OICA), global vehicle sales have increased from 78.7 million units in 2020 to 82.6 million units in 2021. Of these, the sales of passenger cars were 53.9 million units in 2020, which increased to 56.3 million units in 2021. This demand is increasing at an annual average growth rate (AAGR) of about 4.4% during the aforementioned years. Similar trends are witnessed with increasing population, purchasing power, improving lifestyles & standard of living, and developing infrastructure across the globe that is expected to boost the automotive industry.

According to OICA, the global vehicle production has increased from 77.6 million units in 2020 to 80.1 million units in 2021. The year 2020 did not see a significant increase in overall new internal combustion engine automobile registrations. The global market for all kinds of automobiles was affected due to the COVID-19 pandemic and the subsequent economic collapse. In the midst of the pandemic, the worldwide EV sales were extremely uncertain at the start of the year. However, as time passed, 2020 proved to be a surprisingly good year, with worldwide EV sales increasing by 43% from 2019 and the global electric car industry share reaching a record 4,6%. In 2021, the number of electric vehicles (EVs) sold in September exceeded those sold in entire 2012. EVs are expected to play a key part in the goal of zero-emission objectives set for 2050, for which the industry is preparing.

Emerging markets in Asia Pacific, such as China, India, South Korea, and Southeast Asian countries, are attracting global players to set up their manufacturing bases in this region. The increased investments in various technological, infrastructural, and R&D sectors have necessitated coating manufacturers to supply qualitative products to these end users to capitalize on the increased demand in the region. These markets are also propelled by economic growth and subsequent increase in consumption from end-use industries. The Asia Pacific region is expecting heavy Foreign Direct Investment (FDI) in China, Indonesia, Vietnam, Philippines, Myanmar, Malaysia, Thailand, India, Sri Lanka, and Bangladesh. Hence, the automotive production is expected to boost during the forecast period. In order to sustain the demands of these automobile manufacturers, the coating manufacturers have also started focusing on expansions in these regions.

Restraint: Volatility of raw material prices

Price and availability of raw materials are key factors for automotive coating manufacturers in deciding their cost structure and future investments. The key raw materials used in automotive coatings are resins, additives, and solvents obtained through petroleum distillates. The prices of these materials have been highly volatile in recent times. An increase in raw material prices and fluctuating oil prices have been the primary causes for an increase in automotive price, globally. The automotive coating manufacturing industry gets affected by higher transport costs driven by inconsistent fuel prices, and higher manufacturing costs resulting from increasing energy costs. In addition, existing environmental regulations are pushing these coating manufacturers to use eco-friendly and more durable coatings. Such instability in raw material costs with regulatory pressure from governmental organizations poses risks to profit margins of automotive coating manufacturers.

Oil prices showed a drastic downtrend for the first time in history about two years ago during the COVID-19 pandemic. Such a drop in oil prices was not foreseen or witnessed. The economy began to revive as demand across sectors improved due to the resilience of governments throughout the world and actions taken by oil firms. However, when geopolitical conditions changed, oil prices rose beyond USD 110 per barrel in March 2022. Concerns regarding inflation and the broader global economic downturn have begun to develop, despite the positive outlook at the start of the year. More than 1.3 million bpd (barrel per day) of refinery capacity has been shut down in the US since 2019 owing to the impact of COVID-19 on demand, hurricane damage, harsher regulations, and greater operational expenses, among other factors. Owing to current sanctions, the concerns regarding scarcity are adding to the volatility of crude oil prices.

In order to maintain profit margins, the production costs are expected to be transferred to automobile manufacturers and, subsequently, customers. The need for better performance coating has been driven by many factors, such as increasing demand for premium cars, preference for cars with trendy colors, and demand for durable coatings. This has led to higher production costs for both coatings and car manufacturers. Automotive coating manufacturers now have to balance fluctuating raw material prices, innovative products with colour variation, and increased durability with decreased emissions.

Opportunity: Increasing use of powder-based coatings in automotive industry

Investments in the automotive industry in China provide high growth opportunities to powder-based coating manufacturers, as it is one of the main applications of these coatings. The country’s ministry of commerce announced in 2018 that there was a huge demand for new energy vehicles (NEVs) and other automobile products in China. This was due to the automotive market entering a new phase that featured diversified demand and quality-oriented purchases.

The automobile industry in China was increasing year-on-year until recently. According to the China Association of Automobile Manufacturers (CAAM), from 2019 to 2020, automobile production in the country declined by 3.1%. This decline in sales was a result of automobile manufacturers reducing the prices of automobiles due to the tax cuts introduced by the government. Customers, in the hope of more favourable policies, postponed purchasing cars, thus impacting the overall sales in the country. However, with the growing awareness regarding EVs and VOC-free paints, automobile production and sales in the country are expected to grow over the next five years. Powder-based coatings are used for coating automotive engines, chassis, wheels, filters, joysticks, mirrors, wipers, horns, and other parts of vehicles. The transparent powder-based coating is developed as a varnish for car bodies and other vehicles. With the development of new technologies and applications, as well as increasingly stringent environmental requirements, the application of powder-based coatings in the automotive industry is expected to increase in the future.

Challenge: Stringent regulatory policies

Owing to the increasing number of regulatory policies adopted by various governments, automotive coatings producers must constantly improve their processes to comply with the new policies. Products that fail to meet the legal requirements are not allowed in countries that have stringent regulations, especially in Western Europe and North America.

Unfortunately, some legislators continue to limit emission values based only on the concentration of VOC in exhaust gases. This can lead to the approval for high mass emissions from processes, which require high airflows as against low mass emissions that only need very low airflows. The concentration approach also ignores the reduced atmospheric emissions when low-VOC coatings are used.

The polyurethane segment is expected to register the highest CAGR during the forecast period.

The polyurethane resin type segment is expected to register the highest CAGR during the forecast period. With its pleasing cohesiveness, abrasion resistance, and high glossiness, polyurethane coating is one of the primary kinds having key positions in the coating business. Polyurethane is synthesized by reacting an isocyanate with two or more isocyanate groups with a polyol with two or more hydroxyl groups in the presence of a catalyst or by activation with UV radiation. This resin's raw components include di- and triisocyanates as well as polyols. Polyurethane resin is simple to clean and has features such as great durability, toughness, and gloss. Polyurethane resin is used in a variety of applications around the world because of its properties.

The water-based segment is expected to be the fastest-growing segment, by technology, in the automotive coatings market during the forecast period.

Water-based coating technology is formulated with water as the baser. Water is the main solvent in this technology, but it also contains other solvents, for instance, glycol ethers. There is about 80% water content in the entire formulation of water-based coating. The major advantage of this technology is low toxicity & flammability due to low VOC levels and HAP emissions, which helps reduce air emissions. A coating with this technology has excellent adhesion and greater heat resistance compared to other technologies. The disadvantage of this technology is corrosion to equipment used in the coating process; for instance, water-based paints can corrode plain steel and aluminium. Water-based coatings have a VOC content of fewer than 3.5 pounds per gallon of water. Almost all types of resins, such as vinyl, two-component acrylics, epoxies, polyesters, alkyd, and urethanes, are available in water-based versions.

The automotive coatings market in Asia Pacific is expected to register the highest CAGR during the forecast period.
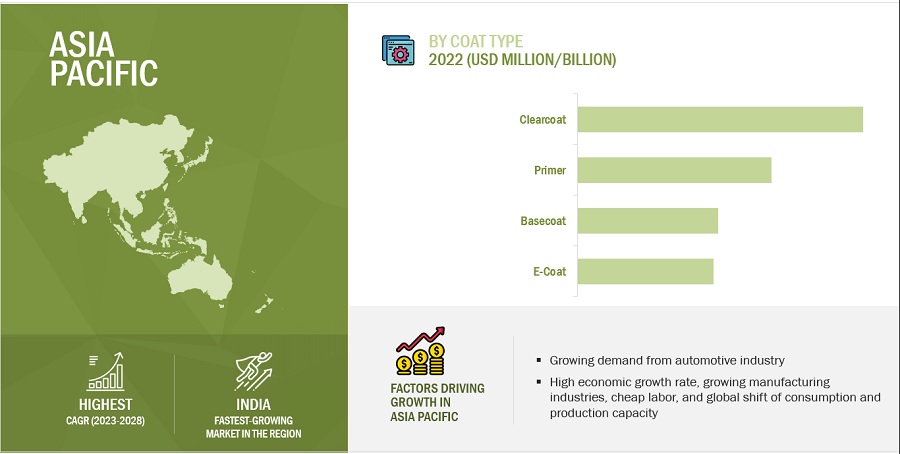
Automotive Coating Market by Region

To know about the assumptions considered for the study, download the pdf brochure

Asia Pacific is the largest market for automotive coatings, and this dominance is expected to continue during the forecast period. High economic growth rate, growing manufacturing industries, cheap labor, and global shift of consumption and production capacities from the developed markets to the emerging markets in the region are factors attributed to the growth of the automotive coatings market in the Asia Pacific.

Prime manufacturers in this region concentrate on accelerated growth and penetration of online sales to open up newer avenues of revenue generation in untapped markets. Companies are constantly investing in disruptive techniques to enable beneficiary and cost-effective supply chain systems, and market leaders are introducing enterprise risk management systems in their manufacturing ecosystems which enables organizations to identify, assess, quantify, and manage risk on one centralized platform. Owing to the above-discussed factors, the Asia Pacific market is expected to provide a worth USD 10,914 million from 2022 to 2027.

Consumers demand high-quality automotive coatings that are used in the commercial sector but at an economical price, and thus manufacturers are focusing on minimizing miscellaneous expenses to lower operating costs while manufacturing the end product. As a result, profit margins and sales of automotive coatings in the commercial division are expected to achieve significant heights during the forecasted period

North America shows tremendous growth during the forecast period.
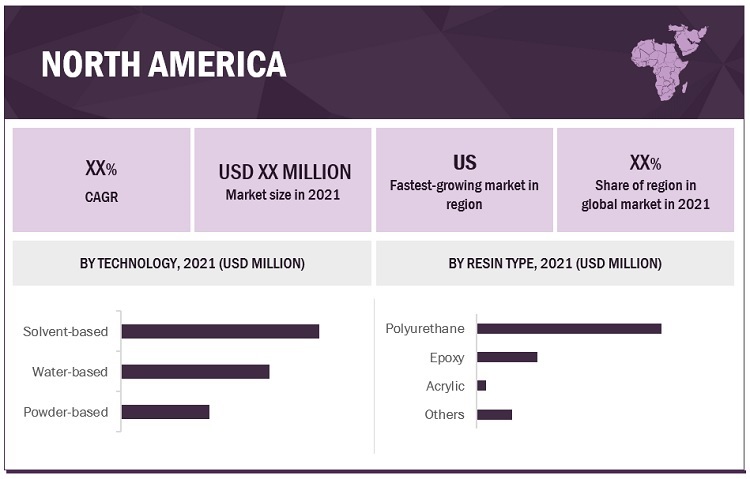
Automotive Coating Market by Region

North America is a diversified market and has many automotive coating manufacturing companies. These companies primarily focus on new product developments to cater to the increasing demand from end-users. The North American automotive coatings market is driven by technological advancements in manufacturing and high-quality end product.

Special effect pigments offer a distinct appearance regardless of the end-use application. This is witnessed in the automotive industry, where they are used in coatings used on both the interior and exterior of vehicles. In North America, the usage of glass flakes, coloured aluminium, and aluminium pigments with considerably smaller particle size is growing due to the appeal of high sparkle finishes, vividly chromatic hues, and mirror-like finishes on interior components. Many automakers have decided to adopt the new, very reliable powder-based coatings that have been developed. Also, as an extra benefit, powder-based coatings offer the ability to aggressively adhere to environmental regulations. Currently, all primer surfacer operations in North America use powder-based coatings.

Automotive Coatings Market Players

BASF SE (Germany), Axalta Coating Systems (US), PPG Industries, Inc (US), Kansai Paint Co., Ltd (Japan), Nippon Paint Holding Co., Ltd (Japan), KCC Corporation (Korea), The Sherwin-Williams Company (US), AkzoNobel N.V. (The Netherlands), Jotun A/S (Norway), Arkema S.A. (France) are the key players operating in the global market.

Automotive Coatings Market Report Scope

Report Metric

Details

Years considered for the study

2017-2027

Base year

2021

Forecast period

2022-2027

Units considered

Value (USD Billion)

Segments

Resin Type, Technology, and Coat Type

Regions

Asia Pacific, North America, Europe, the Middle East & Africa, and South America

Companies

BASF SE (Germany), Axalta Coating Systems (US), PPG Industries, Inc (US), Kansai Paint Co., Ltd (Japan), Nippon Paint Holding Co., Ltd (Japan), KCC Corporation (Korea), The Sherwin-Williams Company (US), AkzoNobel N.V. (The Netherlands), Jotun A/S (Norway), Arkema S.A. (France)
A total of 25 players are covered.

This research report categorizes the automotive coatings market based on resin type, technology, coat type, and region.

Based on resin type, the automotive coatings market has been segmented as follows:
Based on technology, the automotive coatings market has been segmented as follows:
  • Solvent-based
  • Water-based
  • Powder-based
Based on coat type, the automotive coatings market has been segmented as follows:
  • Clearcoat
  • Basecoat
  • Primer
  • E-coat
Based on the region, the automotive coatings market has been segmented as follows:
  • North America
  • Europe
  • Asia Pacific
  • Middle East & Africa
  • South America

Recent Developments

  • In September 2021, Axalta Coating Systems LLC successfully completed the previously announced acquisition of U-POL Holdings Limited (U-POL). The acquisition of U-POL, a leading supplier of paints, protective coatings, and accessories primarily for the automotive aftermarket strengthens Axalta's global refinish leadership position and supports its broader growth strategy.
  • In July 2021, AkzoNobel N.V. and Mercedes-Benz extended their partnership agreement for another four years. This entails the continuation of providing vehicle refinish products including automotive and specialty coatings and services in China and a preferred partner in Indonesia.
  • In June 2021, PPG announced the expansion of its coatings manufacturing capacity in Europe for packaging applications. The investment is expected to meet the rising customer demand in the region for the latest generation coatings for aluminium and steel cans used in packaging for beverage, food, and personal care items.
  • In June 2021, PPG completed the acquisition of Worwag, a global manufacturer of coatings for industrial and automotive applications. The company specializes in developing liquid, powder, and film coatings and operates in Germany, the US, China, South Africa, Mexico, Spain, Switzerland, and Poland. This acquisition is expected to provide further value to the company’s existing or new customers and shareholders.

Frequently Asked Questions (FAQ):

To speak to our analyst for a discussion on the above findings, click Speak to Analyst

TABLE OF CONTENTS
 
1 INTRODUCTION (Page No. - 22)
    1.1 STUDY OBJECTIVES 
    1.2 MARKET DEFINITION 
    1.3 MARKET SCOPE 
          FIGURE 1 AUTOMOTIVE COATINGS: MARKET SEGMENTATION
           1.3.1 REGIONAL SCOPE
           1.3.2 YEARS CONSIDERED
    1.4 CURRENCY CONSIDERED 
    1.5 UNITS CONSIDERED 
    1.6 STAKEHOLDERS 
    1.7 SUMMARY OF CHANGES 
 
2 RESEARCH METHODOLOGY (Page No. - 26)
    2.1 RESEARCH DATA 
          FIGURE 2 AUTOMOTIVE COATINGS MARKET: RESEARCH DESIGN
           2.1.1 SECONDARY DATA
                    2.1.1.1 Key data from secondary sources
           2.1.2 PRIMARY DATA
                    2.1.2.1 Key data from primary sources
                    2.1.2.2 Primary data sources
                    2.1.2.3 Key industry insights
                    2.1.2.4 Breakdown of primary interviews
    2.2 MARKET SIZE ESTIMATION 
           2.2.1 BOTTOM-UP APPROACH
                    FIGURE 3 AUTOMOTIVE COATINGS MARKET SIZE ESTIMATION, BY TECHNOLOGY
           2.2.2 TOP-DOWN APPROACH
                    FIGURE 4 MARKET SIZE ESTIMATION: TOP-DOWN APPROACH
                    FIGURE 5 AUTOMOTIVE COATINGS MARKET SIZE ESTIMATION, BY REGION
                    FIGURE 6 AUTOMOTIVE COATINGS MARKET, BY TECHNOLOGY
           2.2.3 SUPPLY-SIDE FORECAST
                    FIGURE 7 AUTOMOTIVE COATINGS MARKET: SUPPLY-SIDE FORECAST
                    FIGURE 8 METHODOLOGY FOR SUPPLY-SIDE SIZING OF AUTOMOTIVE COATINGS MARKET
           2.2.4 FACTOR ANALYSIS
                    FIGURE 9 FACTOR ANALYSIS OF AUTOMOTIVE COATINGS MARKET
    2.3 DATA TRIANGULATION 
          FIGURE 10 AUTOMOTIVE COATINGS MARKET: DATA TRIANGULATION
    2.4 ASSUMPTIONS 
    2.5 LIMITATIONS 
    2.6 GROWTH RATE FORECAST 
 
3 EXECUTIVE SUMMARY (Page No. - 36)
    TABLE 1 AUTOMOTIVE COATINGS MARKET SNAPSHOT, 2022 VS. 2027
    FIGURE 11 POLYURETHANE RESIN SEGMENT TO DOMINATE AUTOMOTIVE  COATINGS MARKET
    FIGURE 12 SOLVENT-BASED TECHNOLOGY TO LEAD AUTOMOTIVE COATINGS MARKET
    FIGURE 13 CLEARCOAT TO BE LARGEST COAT TYPE OF AUTOMOTIVE COATINGS
    FIGURE 14 ASIA PACIFIC TO BE FASTEST-GROWING AUTOMOTIVE COATINGS MARKET
 
4 PREMIUM INSIGHTS (Page No. - 40)
    4.1 ATTRACTIVE OPPORTUNITIES IN AUTOMOTIVE COATINGS MARKET 
          FIGURE 15 MARKET GROWTH IN ASIA PACIFIC ATTRIBUTED TO GROWING  AUTOMOTIVE INDUSTRY
    4.2 AUTOMOTIVE COATINGS MARKET, BY TECHNOLOGY 
          FIGURE 16 SOLVENT-BASED TO BE LARGEST TECHNOLOGY SEGMENT DURING  FORECAST PERIOD
    4.3 AUTOMOTIVE COATINGS MARKET: DEVELOPED VS.  EMERGING COUNTRIES 
          FIGURE 17 EMERGING COUNTRIES TO WITNESS HIGHER GROWTH DURING  FORECAST PERIOD
    4.4 ASIA PACIFIC AUTOMOTIVE COATINGS MARKET:  BY TECHNOLOGY AND COUNTRY 
          FIGURE 18 CHINA ACCOUNTED FOR LARGEST MARKET SHARE IN ASIA PACIFIC
    4.5 AUTOMOTIVE COATINGS MARKET: MAJOR COUNTRIES 
          FIGURE 19 INDIA TO REGISTER HIGHEST CAGR IN AUTOMOTIVE COATINGS MARKET
 
5 MARKET OVERVIEW (Page No. - 43)
    5.1 INTRODUCTION 
    5.2 MARKET DYNAMICS 
          FIGURE 20 DRIVERS, RESTRAINTS, OPPORTUNITIES, AND CHALLENGES IN AUTOMOTIVE COATINGS MARKET
           5.2.1 DRIVERS
                    5.2.1.1 Growing automotive and EV sales to drive coatings industry
                    5.2.1.2 Green, environment-friendly, and healthier coating systems
                    5.2.1.3 Technological advancements in powder-based coating technology
           5.2.2 RESTRAINTS
                    5.2.2.1 Volatility of raw material prices
                    5.2.2.2 Environmental regulations in developed countries
           5.2.3 OPPORTUNITIES
                    5.2.3.1 Increasing use of powder-based coatings in automotive industry
                    5.2.3.2 Advancements in coating technology
                    5.2.3.3 Process optimization
           5.2.4 CHALLENGES
                    5.2.4.1 Changes in consumer demand
                    5.2.4.2 Stringent regulatory policies
                    5.2.4.3 Environmental challenges with respect to wastewater discharge
    5.3 PORTER'S FIVE FORCES ANALYSIS 
          TABLE 2 AUTOMOTIVE COATINGS MARKET: PORTER'S FIVE FORCES ANALYSIS
          FIGURE 21 PORTER’S FIVE FORCES ANALYSIS: AUTOMOTIVE COATINGS MARKET
           5.3.1 INTENSITY OF COMPETITIVE RIVALRY
           5.3.2 BARGAINING POWER OF BUYERS
           5.3.3 BARGAINING POWER OF SUPPLIERS
           5.3.4 THREAT OF SUBSTITUTES
           5.3.5 THREAT OF NEW ENTRANTS
    5.4 KEY STAKEHOLDERS & BUYING CRITERIA 
           5.4.1 KEY STAKEHOLDERS IN BUYING PROCESS
                    FIGURE 22 INFLUENCE OF STAKEHOLDERS IN BUYING PROCESS
                    TABLE 3 INFLUENCE OF STAKEHOLDERS IN BUYING PROCESS FOR TOP INDUSTRIES (%)
           5.4.2 BUYING CRITERIA
                    FIGURE 23 KEY BUYING CRITERIA FOR AUTOMOTIVE COATINGS
                    TABLE 4 KEY BUYING CRITERIA FOR AUTOMOTIVE COATINGS
    5.5 MACROECONOMIC OVERVIEW AND KEY TRENDS 
           5.5.1 INTRODUCTION
           5.5.2 TRENDS AND FORECAST OF GDP
                    TABLE 5 REAL GDP GROWTH BY COUNTRY (ANNUAL PERCENTAGE CHANGE), 2020–2027
           5.5.3 TRENDS IN AUTOMOTIVE INDUSTRY
                    TABLE 6 AUTOMOTIVE INDUSTRY PRODUCTION (2020–2021)
    5.6 VALUE CHAIN ANALYSIS 
          FIGURE 24 AUTOMOTIVE COATINGS: VALUE CHAIN ANALYSIS
    5.7 PRICING ANALYSIS 
          FIGURE 25 AVERAGE PRICE COMPETITIVENESS IN AUTOMOTIVE COATINGS  MARKET, BY REGION
    5.8 AUTOMOTIVE COATINGS ECOSYSTEM AND  INTERCONNECTED MARKETS 
          TABLE 7 AUTOMOTIVE COATINGS MARKET: SUPPLY CHAIN
          FIGURE 26 AUTOMOTIVE COATINGS MARKET: ECOSYSTEM
    5.9 TRADE ANALYSIS 
          TABLE 8 COUNTRY-WISE EXPORT DATA, 2019–2021 (USD THOUSAND)
          TABLE 9 COUNTRY-WISE IMPORT DATA, 2019–2021 (USD THOUSAND)
    5.10 PATENT ANALYSIS 
           5.10.1 METHODOLOGY
           5.10.2 PUBLICATION TRENDS
    5.11 NUMBER OF PATENTS PUBLISHED, 2017–2022 
           FIGURE 27 AUTOMOTIVE COATINGS: PUBLISHED PATENTS
           5.11.1 TOP JURISDICTION
                     FIGURE 28 PATENTS PUBLISHED, BY JURISDICTION, 2017–2022
           5.11.2 TOP APPLICANTS
                     FIGURE 29 PATENTS PUBLISHED BY MAJOR APPLICANTS, 2017–2022
    5.12 RECENT PATENTS, BY OWNERS 
    5.13 CASE STUDY ANALYSIS 
    5.14 TECHNOLOGY ANALYSIS 
    5.15 KEY CONFERENCES & EVENTS IN 2023 
          TABLE 10 AUTOMOTIVE COATINGS MARKET: DETAILED LIST OF CONFERENCES & EVENTS
    5.16 TARIFF AND REGULATORY LANDSCAPE 
           5.16.1 REGULATORY BODIES, GOVERNMENT AGENCIES, AND  OTHER ORGANIZATIONS
                     TABLE 11 NORTH AMERICA: LIST OF REGULATORY BODIES, GOVERNMENT AGENCIES,  AND OTHER ORGANIZATIONS
                     TABLE 12 EUROPE: LIST OF REGULATORY BODIES, GOVERNMENT AGENCIES, AND OTHER ORGANIZATIONS
 
6 AUTOMOTIVE COATINGS MARKET, BY RESIN TYPE (Page No. - 74)
    6.1 INTRODUCTION 
          FIGURE 30 POLYURETHANE RESIN TO DOMINATE AUTOMOTIVE COATINGS MARKET
          TABLE 13 AUTOMOTIVE COATINGS MARKET SIZE, BY RESIN TYPE, 2018–2021 (USD MILLION)
          TABLE 14 AUTOMOTIVE COATING MARKET SIZE, BY RESIN TYPE, 2022–2027 (USD MILLION)
          TABLE 15 AUTOMOTIVE COATINGS MARKET SIZE, BY RESIN TYPE, 2018–2021 (KILOTON)
          TABLE 16 AUTOMOTIVE COATING MARKET SIZE, BY RESIN TYPE, 2022–2027 (KILOTON)
    6.2 POLYURETHANE 
           6.2.1 ENVIRONMENT-FRIENDLINESS AND EXCELLENT STRENGTH- TO-WEIGHT RATIO TO DRIVE MARKET
                    TABLE 17 POLYURETHANE AUTOMOTIVE COATINGS MARKET SIZE, BY REGION,  2018–2021 (USD MILLION)
                    TABLE 18 POLYURETHANE AUTOMOTIVE COATING MARKET SIZE, BY REGION,  2022–2027 (USD MILLION)
                    TABLE 19 POLYURETHANE AUTOMOTIVE COATINGS MARKET SIZE, BY REGION,  2018–2021 (KILOTON)
                    TABLE 20 POLYURETHANE AUTOMOTIVE COATING MARKET SIZE, BY REGION,  2022–2027 (KILOTON)
    6.3 EPOXY 
           6.3.1 HIGH ADHESION AND RESISTANCE TO RUST TO DRIVE MARKET
                    TABLE 21 EPOXY AUTOMOTIVE COATINGS MARKET SIZE, BY REGION, 2018–2021 (USD MILLION)
                    TABLE 22 EPOXY AUTOMOTIVE COATING MARKET SIZE, BY REGION, 2022–2027 (USD MILLION)
                    TABLE 23 EPOXY AUTOMOTIVE COATINGS MARKET SIZE, BY REGION, 2018–2021 (KILOTON)
                    TABLE 24 EPOXY AUTOMOTIVE COATING MARKET SIZE, BY REGION, 2022–2027 (KILOTON)
    6.4 ACRYLIC 
           6.4.1 RESISTANCE TO ABRASION AND CHEMICAL ATTACK  TO DRIVE MARKET
                    TABLE 25 ACRYLIC AUTOMOTIVE COATINGS MARKET SIZE, BY REGION, 2018–2021 (USD MILLION)
                    TABLE 26 ACRYLIC AUTOMOTIVE COATING MARKET SIZE, BY REGION, 2022–2027 (USD MILLION)
                    TABLE 27 ACRYLIC AUTOMOTIVE COATINGS MARKET SIZE, BY REGION, 2018–2021 (KILOTON)
                    TABLE 28 ACRYLIC AUTOMOTIVE COATING MARKET SIZE, BY REGION, 2022–2027 (KILOTON)
    6.5 OTHERS 
          TABLE 29 OTHER AUTOMOTIVE COATINGS MARKET SIZE, BY REGION, 2018–2021 (USD MILLION)
          TABLE 30 OTHER AUTOMOTIVE COATING MARKET SIZE, BY REGION, 2022–2027 (USD MILLION)
          TABLE 31 OTHER AUTOMOTIVE COATINGS MARKET SIZE, BY REGION, 2018–2021 (KILOTON)
          TABLE 32 OTHER AUTOMOTIVE COATING MARKET SIZE, BY REGION, 2022–2027 (KILOTON)
 
7 AUTOMOTIVE COATINGS MARKET, BY TECHNOLOGY (Page No. - 85)
    7.1 INTRODUCTION 
          FIGURE 31 SOLVENT-BASED TECHNOLOGY TO BE LEADING SEGMENT IN AUTOMOTIVE COATINGS MARKET
          TABLE 33 AUTOMOTIVE COATINGS MARKET SIZE, BY TECHNOLOGY, 2018–2021 (USD MILLION)
          TABLE 34 AUTOMOTIVE COATING MARKET SIZE, BY TECHNOLOGY, 2022–2027 (USD MILLION)
          TABLE 35 AUTOMOTIVE COATINGS MARKET SIZE, BY TECHNOLOGY, 2018–2021 (KILOTON)
          TABLE 36 AUTOMOTIVE COATING MARKET SIZE, BY TECHNOLOGY, 2022–2027 (KILOTON)
    7.2 SOLVENT-BASED 
           7.2.1 HIGHER DURABILITY AND LOW SENSITIVITY TO BASE UNDERNEATH TO DRIVE MARKET
                    TABLE 37 SOLVENT-BASED AUTOMOTIVE COATINGS MARKET SIZE, BY REGION,  2018–2021 (USD MILLION)
                    TABLE 38 SOLVENT-BASED AUTOMOTIVE COATING MARKET SIZE, BY REGION,  2022–2027 (USD MILLION)
                    TABLE 39 SOLVENT-BASED AUTOMOTIVE COATINGS MARKET SIZE, BY REGION,  2018–2021 (KILOTON)
                    TABLE 40 SOLVENT-BASED AUTOMOTIVE COATING MARKET SIZE, BY REGION,  2022–2027 (KILOTON)
    7.3 WATER-BASED 
           7.3.1 ENVIRONMENTALLY FRIENDLY AND LOW CLEARCOAT REQUIREMENT TO DRIVE MARKET
                    TABLE 41 WATER-BASED AUTOMOTIVE COATINGS MARKET SIZE, BY REGION,  2018–2021 (USD MILLION)
                    TABLE 42 WATER-BASED AUTOMOTIVE COATING MARKET SIZE, BY REGION,  2022–2027 (USD MILLION)
                    TABLE 43 WATER -BASED AUTOMOTIVE COATINGS MARKET SIZE, BY REGION,  2018–2021 (KILOTON)
                    TABLE 44 WATER -BASED AUTOMOTIVE COATING MARKET SIZE, BY REGION,  2022–2027 (KILOTON)
    7.4 POWDER-BASED 
           7.4.1 ENDURING ABRASION AND CORROSION RESISTANCE PROPERTIES TO DRIVE MARKET
                    TABLE 45 POWDER-BASED AUTOMOTIVE COATINGS MARKET SIZE, BY REGION,  2018–2021 (USD MILLION)
                    TABLE 46 POWDER-BASED AUTOMOTIVE COATING MARKET SIZE, BY REGION,  2022–2027 (USD MILLION)
                    TABLE 47 POWDER-BASED AUTOMOTIVE COATINGS MARKET SIZE, BY REGION,  2018–2021 (KILOTON)
                    TABLE 48 POWDER-BASED AUTOMOTIVE COATING MARKET SIZE, BY REGION,  2022–2027 (KILOTON)
 
8 AUTOMOTIVE COATINGS MARKET, BY COAT TYPE (Page No. - 95)
    8.1 INTRODUCTION 
          FIGURE 32 CLEARCOAT SEGMENT TO LEAD AUTOMOTIVE COATINGS MARKET
          TABLE 49 AUTOMOTIVE COATINGS MARKET SIZE, BY COAT TYPE, 2018–2021 (USD MILLION)
          TABLE 50 AUTOMOTIVE COATING MARKET SIZE, BY COAT TYPE, 2022–2027 (USD MILLION)
          TABLE 51 AUTOMOTIVE COATINGS MARKET SIZE, BY COAT TYPE, 2018–2021 (KILOTON)
          TABLE 52 AUTOMOTIVE COATING MARKET SIZE, BY COAT TYPE, 2022–2027 (KILOTON)
    8.2 E-COAT 
           8.2.1 ECONOMICAL AND HIGH PROTECTION OFFERING TO DRIVE MARKET
                    TABLE 53 E-COAT AUTOMOTIVE COATINGS MARKET SIZE, BY REGION, 2018–2021 (USD MILLION)
                    TABLE 54 E-COAT AUTOMOTIVE COATING MARKET SIZE, BY REGION, 2022–2027 (USD MILLION)
                    TABLE 55 E-COAT AUTOMOTIVE COATINGS MARKET SIZE, BY REGION, 2018–2021 (KILOTON)
                    TABLE 56 E-COAT AUTOMOTIVE COATING MARKET SIZE, BY REGION, 2022–2027 (KILOTON)
    8.3 PRIMER 
           8.3.1 SUPERIOR ADHESION TO TOPCOATS TO DRIVE MARKET
                    TABLE 57 PRIMER AUTOMOTIVE COATINGS MARKET SIZE, BY REGION, 2018–2021 (USD MILLION)
                    TABLE 58 PRIMER AUTOMOTIVE COATING MARKET SIZE, BY REGION, 2022–2027 (USD MILLION)
                    TABLE 59 PRIMER AUTOMOTIVE COATINGS MARKET SIZE, BY REGION, 2018–2021 (KILOTON)
                    TABLE 60 PRIMER AUTOMOTIVE COATING MARKET SIZE, BY REGION, 2022–2027 (KILOTON)
    8.4 BASECOAT 
           8.4.1 REDUCED DOWNTIME AND MAINTENANCE TO DRIVE MARKET
                    TABLE 61 BASECOAT AUTOMOTIVE COATINGS MARKET SIZE, BY REGION,  2018–2021 (USD MILLION)
                    TABLE 62 BASECOAT AUTOMOTIVE COATING MARKET SIZE, BY REGION,  2022–2027 (USD MILLION)
                    TABLE 63 BASECOAT AUTOMOTIVE COATINGS MARKET SIZE, BY REGION, 2018–2021 (KILOTON)
                    TABLE 64 BASECOAT AUTOMOTIVE COATING MARKET SIZE, BY REGION, 2022–2027 (KILOTON)
    8.5 CLEARCOAT 
           8.5.1 VALUABLE BODY PROTECTION TO DRIVE MARKET
                    TABLE 65 CLEARCOAT AUTOMOTIVE COATINGS MARKET SIZE, BY REGION,  2018–2021 (USD MILLION)
                    TABLE 66 CLEARCOAT AUTOMOTIVE COATING MARKET SIZE, BY REGION,  2022–2027 (USD MILLION)
                    TABLE 67 CLEARCOAT AUTOMOTIVE COATINGS MARKET SIZE, BY REGION, 2018–2021 (KILOTON)
                    TABLE 68 CLEARCOAT AUTOMOTIVE COATING MARKET SIZE, BY REGION, 2022–2027 (KILOTON)
 
9 AUTOMOTIVE COATINGS MARKET, BY REGION (Page No. - 106)
    9.1 INTRODUCTION 
          FIGURE 33 ASIA PACIFIC EMERGING AS STRATEGIC LOCATION FOR AUTOMOTIVE  COATINGS MARKET
          TABLE 69 AUTOMOTIVE COATINGS MARKET SIZE, BY REGION, 2018–2021 (USD MILLION)
          TABLE 70 AUTOMOTIVE COATING MARKET SIZE, BY REGION, 2022–2027 (USD MILLION)
          TABLE 71 AUTOMOTIVE COATINGS MARKET SIZE, BY REGION, 2018–2021 (KILOTON)
          TABLE 72 AUTOMOTIVE COATING MARKET SIZE, BY REGION, 2022–2027 (KILOTON)
    9.2 NORTH AMERICA 
          FIGURE 34 NORTH AMERICA: AUTOMOTIVE COATINGS MARKET SNAPSHOT
          TABLE 73 NORTH AMERICA: AUTOMOTIVE COATING MARKET SIZE, BY COUNTRY,  2018–2021 (USD MILLION)
          TABLE 74 NORTH AMERICA: MARKET SIZE, BY COUNTRY,  2022–2027 (USD MILLION)
          TABLE 75 NORTH AMERICA: MARKET SIZE, BY COUNTRY,  2018–2021 (KILOTON)
          TABLE 76 NORTH AMERICA: MARKET SIZE, BY COUNTRY,  2022–2027 (KILOTON)
          TABLE 77 NORTH AMERICA: MARKET SIZE, BY RESIN TYPE,  2018–2021 (USD MILLION)
          TABLE 78 NORTH AMERICA: MARKET SIZE, BY RESIN TYPE,  2022–2027 (USD MILLION)
          TABLE 79 NORTH AMERICA: MARKET SIZE, BY RESIN TYPE,  2018–2021 (KILOTON)
          TABLE 80 NORTH AMERICA: MARKET SIZE, BY RESIN TYPE,  2022–2027 (KILOTON)
          TABLE 81 NORTH AMERICA: MARKET SIZE, BY TECHNOLOGY,  2018–2021 (USD MILLION)
          TABLE 82 NORTH AMERICA: MARKET SIZE, BY TECHNOLOGY,  2022–2027 (USD MILLION)
          TABLE 83 NORTH AMERICA: MARKET SIZE, BY TECHNOLOGY,  2018–2021 (KILOTON)
          TABLE 84 NORTH AMERICA: MARKET SIZE, BY TECHNOLOGY,  2022–2027 (KILOTON)
          TABLE 85 NORTH AMERICA: MARKET SIZE, BY COAT TYPE,  2018–2021 (USD MILLION)
          TABLE 86 NORTH AMERICA: MARKET SIZE, BY COAT TYPE,  2022–2027 (USD MILLION)
          TABLE 87 NORTH AMERICA: MARKET SIZE, BY COAT TYPE,  2018–2021 (KILOTON)
          TABLE 88 NORTH AMERICA: MARKET SIZE, BY COAT TYPE,  2022–2027 (KILOTON)
           9.2.1 US
                    9.2.1.1 Growing automotive industry to propel market
           9.2.2 CANADA
                    9.2.2.1 Regulations promoting lower-VOC led to increased demand for water-based coatings for automotive refinish
           9.2.3 MEXICO
                    9.2.3.1 Favorable trade agreements likely to drive growth of automotive market
    9.3 EUROPE 
          FIGURE 35 EUROPE: AUTOMOTIVE COATINGS MARKET SNAPSHOT
          TABLE 89 EUROPE: AUTOMOTIVE COATING MARKET SIZE, BY COUNTRY,  2018–2021 (USD MILLION)
          TABLE 90 EUROPE: MARKET SIZE, BY COUNTRY,  2022–2027 (USD MILLION)
          TABLE 91 EUROPE: MARKET SIZE, BY COUNTRY, 2018–2021 (KILOTON)
          TABLE 92 EUROPE: MARKET SIZE, BY COUNTRY, 2022–2027 (KILOTON)
          TABLE 93 EUROPE: MARKET SIZE, BY RESIN TYPE,  2018–2021 (USD MILLION)
          TABLE 94 EUROPE: MARKET SIZE, BY RESIN TYPE,  2022–2027 (USD MILLION)
          TABLE 95 EUROPE: MARKET SIZE, BY RESIN TYPE, 2018–2021 (KILOTON)
          TABLE 96 EUROPE: MARKET SIZE, BY RESIN TYPE, 2022–2027 (KILOTON)
          TABLE 97 EUROPE: MARKET SIZE, BY TECHNOLOGY,  2018–2021 (USD MILLION)
          TABLE 98 EUROPE: MARKET SIZE, BY TECHNOLOGY,  2022–2027 (USD MILLION)
          TABLE 99 EUROPE: MARKET SIZE, BY TECHNOLOGY,  2018–2021 (KILOTON)
          TABLE 100 EUROPE: MARKET SIZE, BY TECHNOLOGY,  2022–2027 (KILOTON)
          TABLE 101 EUROPE: MARKET SIZE, BY COAT TYPE,  2018–2021 (USD MILLION)
          TABLE 102 EUROPE: MARKET SIZE, BY COAT TYPE,  2022–2027 (USD MILLION)
          TABLE 103 EUROPE: MARKET SIZE, BY COAT TYPE, 2018–2021 (KILOTON)
          TABLE 104 EUROPE: MARKET SIZE, BY COAT TYPE, 2022–2027 (KILOTON)
           9.3.1 GERMANY
                    9.3.1.1 Presence of major distribution channels to increase demand
           9.3.2 UK
                    9.3.2.1 BREXIT to hamper automotive industry growth in short term
           9.3.3 FRANCE
                    9.3.3.1 Government initiatives and enhanced technology in automotive industry to drive market
           9.3.4 RUSSIA
                    9.3.4.1 Investments by government in automotive industry to stabilize prices and boost demand
           9.3.5 SPAIN
                    9.3.5.1 New investment and government approach toward sustainability to drive market
           9.3.6 ITALY
                    9.3.6.1 High disposable income and rising FII investments
           9.3.7 TURKEY
                    9.3.7.1 New manufacturing facilities to boost demand for automotive coatings
           9.3.8 REST OF EUROPE
    9.4 ASIA PACIFIC 
          FIGURE 36 ASIA PACIFIC: AUTOMOTIVE COATINGS MARKET SNAPSHOT
          TABLE 105 ASIA PACIFIC: AUTOMOTIVE COATING MARKET SIZE, BY COUNTRY,  2018–2021 (USD MILLION)
          TABLE 106 ASIA PACIFIC: MARKET SIZE, BY COUNTRY,  2022–2027 (USD MILLION)
          TABLE 107 ASIA PACIFIC: MARKET SIZE, BY COUNTRY,  2018–2021 (KILOTON)
          TABLE 108 ASIA PACIFIC: MARKET SIZE, BY COUNTRY,  2022–2027 (KILOTON)
          TABLE 109 ASIA PACIFIC: MARKET SIZE, BY RESIN TYPE,  2018–2021 (USD MILLION)
          TABLE 110 ASIA PACIFIC: MARKET SIZE, BY RESIN TYPE,  2022–2027 (USD MILLION)
          TABLE 111 ASIA PACIFIC: MARKET SIZE, BY RESIN TYPE,  2018–2021 (KILOTON)
          TABLE 112 ASIA PACIFIC: MARKET SIZE, BY RESIN TYPE,  2022–2027 (KILOTON)
          TABLE 113 ASIA PACIFIC: MARKET SIZE, BY TECHNOLOGY,  2018–2021 (USD MILLION)
          TABLE 114 ASIA PACIFIC: MARKET SIZE, BY TECHNOLOGY,  2022–2027 (USD MILLION)
          TABLE 115 ASIA PACIFIC: MARKET SIZE, BY TECHNOLOGY,  2018–2021 (KILOTON)
          TABLE 116 ASIA PACIFIC: MARKET SIZE, BY TECHNOLOGY,  2022–2027 (KILOTON)
          TABLE 117 ASIA PACIFIC: MARKET SIZE, BY COAT TYPE,  2018–2021 (USD MILLION)
          TABLE 118 ASIA PACIFIC: MARKET SIZE, BY COAT TYPE,  2022–2027 (USD MILLION)
          TABLE 119 ASIA PACIFIC: MARKET SIZE, BY COAT TYPE,  2018–2021 (KILOTON)
          TABLE 120 ASIA PACIFIC: MARKET SIZE, BY COAT TYPE,  2022–2027 (KILOTON)
           9.4.1 CHINA
                    9.4.1.1 Large investments by global manufacturers to boost demand for automotive coatings
           9.4.2 JAPAN
                    9.4.2.1 Mature automotive coatings market to grow at moderate rate
           9.4.3 SOUTH KOREA
                    9.4.3.1 Technology-driven economy approach to boost demand for automotive coatings
           9.4.4 INDIA
                    9.4.4.1 Availability of resources, rapid economic growth, increasing disposable income, and urbanization to drive market
           9.4.5 THAILAND
                    9.4.5.1 High capacity automotive production and collaboration among players in automotive space to drive market
           9.4.6 INDONESIA
                    9.4.6.1 Effective government policies and presence of global players  to drive market
           9.4.7 MALAYSIA
                    9.4.7.1 Manufacturer of high-durability and superior-quality products
           9.4.8 REST OF ASIA PACIFIC
    9.5 SOUTH AMERICA 
          FIGURE 37 BRAZIL TO WITNESS SIGNIFICANT GROWTH DURING FORECAST PERIOD
          TABLE 121 SOUTH AMERICA: AUTOMOTIVE COATINGS MARKET SIZE, BY COUNTRY,  2018–2021 (USD MILLION)
          TABLE 122 SOUTH AMERICA: AUTOMOTIVE COATING MARKET SIZE, BY COUNTRY,  2022–2027 (USD MILLION)
          TABLE 123 SOUTH AMERICA: MARKET SIZE, BY COUNTRY,  2018–2021 (KILOTON)
          TABLE 124 SOUTH AMERICA: MARKET SIZE, BY COUNTRY,  2022–2027 (KILOTON )
          TABLE 125 SOUTH AMERICA: MARKET SIZE, BY RESIN TYPE,  2018–2021 (USD MILLION)
          TABLE 126 SOUTH AMERICA: MARKET SIZE, BY RESIN TYPE,  2022–2027 (USD MILLION)
          TABLE 127 SOUTH AMERICA: MARKET SIZE, BY RESIN TYPE,  2018–2021 (KILOTON)
          TABLE 128 SOUTH AMERICA: MARKET SIZE, BY RESIN TYPE,  2022–2027 (KILOTON)
          TABLE 129 SOUTH AMERICA: MARKET SIZE, BY TECHNOLOGY,  2018–2021 (USD MILLION)
          TABLE 130 SOUTH AMERICA: MARKET SIZE, BY TECHNOLOGY,  2022–2027 (USD MILLION)
          TABLE 131 SOUTH AMERICA: MARKET SIZE, BY TECHNOLOGY,  2018–2021 (KILOTON)
          TABLE 132 SOUTH AMERICA: MARKET SIZE, BY TECHNOLOGY,  2022–2027 (KILOTON)
          TABLE 133 SOUTH AMERICA: MARKET SIZE, BY COAT TYPE,  2018–2021 (USD MILLION)
          TABLE 134 SOUTH AMERICA: MARKET SIZE, BY COAT TYPE,  2022–2027 (USD MILLION)
          TABLE 135 SOUTH AMERICA: MARKET SIZE, BY COAT TYPE,  2018–2021 (KILOTON)
          TABLE 136 SOUTH AMERICA: MARKET SIZE, BY COAT TYPE,  2022–2027 (KILOTON)
           9.5.1 BRAZIL
                    9.5.1.1 Expansion of production capacity and established distribution channels to propel market
           9.5.2 ARGENTINA
                    9.5.2.1 Government initiatives to boost demand for automotive coatings
           9.5.3 REST OF SOUTH AMERICA
    9.6 MIDDLE EAST & AFRICA 
          FIGURE 38 SOUTH AFRICA IS FASTEST-GROWING COUNTRY IN REGION
          TABLE 137 MIDDLE EAST & AFRICA: AUTOMOTIVE COATINGS MARKET SIZE, BY COUNTRY,  2018–2021 (USD MILLION)
          TABLE 138 MIDDLE EAST & AFRICA: AUTOMOTIVE COATING MARKET SIZE, BY COUNTRY,  2022–2027 (USD MILLION)
          TABLE 139 MIDDLE EAST & AFRICA: MARKET SIZE, BY COUNTRY,  2018–2021 (KILOTON)
          TABLE 140 MIDDLE EAST & AFRICA: MARKET SIZE, BY COUNTRY,  2022–2027 (KILOTON)
          TABLE 141 MIDDLE EAST & AFRICA: MARKET SIZE, BY RESIN TYPE,  2018–2021 (USD MILLION)
          TABLE 142 MIDDLE EAST & AFRICA: MARKET SIZE, BY RESIN TYPE,  2022–2027 (USD MILLION)
          TABLE 143 MIDDLE EAST & AFRICA: MARKET SIZE, BY RESIN TYPE,  2018–2021 (KILOTON)
          TABLE 144 MIDDLE EAST & AFRICA: MARKET SIZE, BY RESIN TYPE,  2022–2027 (KILOTON)
          TABLE 145 MIDDLE EAST & AFRICA: MARKET SIZE, BY TECHNOLOGY,  2018–2021 (USD MILLION)
          TABLE 146 MIDDLE EAST & AFRICA: MARKET SIZE, BY TECHNOLOGY,  2022–2027 (USD MILLION)
          TABLE 147 MIDDLE EAST & AFRICA: MARKET SIZE, BY TECHNOLOGY,  2018–2021 (KILOTON)
          TABLE 148 MIDDLE EAST & AFRICA: MARKET SIZE, BY TECHNOLOGY,  2022–2027 (KILOTON)
          TABLE 149 MIDDLE EAST & AFRICA: MARKET SIZE, BY COAT TYPE,  2018–2021 (USD MILLION)
          TABLE 150 MIDDLE EAST & AFRICA: MARKET SIZE, BY COAT TYPE,  2022–2027 (USD MILLION)
          TABLE 151 MIDDLE EAST & AFRICA: MARKET SIZE, BY COAT TYPE,  2018–2021 (KILOTON)
          TABLE 152 MIDDLE EAST & AFRICA: MARKET SIZE, BY COAT TYPE,  2022–2027 (KILOTON)
           9.6.1 SOUTH AFRICA
                    9.6.1.1 Growth of various manufacturing industries to result in market growth
           9.6.2 MOROCCO
                    9.6.2.1 Experienced workforce and enhanced FII investments to  drive market
           9.6.3 REST OF MIDDLE EAST & AFRICA
 
10 COMPETITIVE LANDSCAPE (Page No. - 153)
     10.1 OVERVIEW 
             TABLE 153 OVERVIEW OF STRATEGIES ADOPTED BY KEY AUTOMOTIVE COATING  PLAYERS (2016–2022)
     10.2 COMPETITIVE LEADERSHIP MAPPING, 2021 
             10.2.1 STARS
             10.2.2 EMERGING LEADERS
             10.2.3 PARTICIPANTS
             10.2.4 PERVASIVE PLAYERS
                        FIGURE 39 AUTOMOTIVE COATINGS MARKET: COMPETITIVE LEADERSHIP MAPPING, 2021
     10.3 SMALL AND MEDIUM-SIZED ENTERPRISES (SMES) MATRIX, 2021 
             10.3.1 RESPONSIVE COMPANIES
             10.3.2 PROGRESSIVE COMPANIES
             10.3.3 STARTING BLOCKS
             10.3.4 DYNAMIC COMPANIES
                        FIGURE 40 AUTOMOTIVE COATINGS MARKET: EMERGING COMPANIES’ COMPETITIVE LEADERSHIP MAPPING, 2021
     10.4 STRENGTH OF PRODUCT PORTFOLIO 
             FIGURE 41 PRODUCT PORTFOLIO ANALYSIS OF TOP PLAYERS IN AUTOMOTIVE  COATINGS MARKET
     10.5 BUSINESS STRATEGY EXCELLENCE 
             FIGURE 42 BUSINESS STRATEGY EXCELLENCE OF TOP PLAYERS IN AUTOMOTIVE  COATINGS MARKET
     10.6 COMPETITIVE BENCHMARKING 
              TABLE 154 AUTOMOTIVE COATINGS MARKET: DETAILED LIST OF KEY STARTUPS/SMES
              TABLE 155 AUTOMOTIVE COATINGS MARKET: COMPETITIVE BENCHMARKING OF KEY PLAYERS [STARTUPS/SMES]
              TABLE 156 COMPANY EVALUATION MATRIX: AUTOMOTIVE COATINGS
     10.7 MARKET SHARE ANALYSIS 
             FIGURE 43 MARKET SHARE, BY KEY PLAYER (2021)
              TABLE 157 AUTOMOTIVE COATINGS MARKET: DEGREE OF COMPETITION, 2021
     10.8 MARKET RANKING ANALYSIS 
             FIGURE 44 MARKET RANKING ANALYSIS, 2021
     10.9 REVENUE ANALYSIS 
             FIGURE 45 REVENUE ANALYSIS OF TOP FIVE PLAYERS, 2017–2021
     10.10 COMPETITIVE SCENARIO 
             10.10.1 MARKET EVALUATION FRAMEWORK
                        TABLE 158 STRATEGIC DEVELOPMENTS, BY COMPANY
                        TABLE 159 HIGHEST ADOPTED STRATEGIES
                        TABLE 160 NUMBER OF GROWTH STRATEGIES ADOPTED BY KEY COMPANIES
             10.10.2 MARKET EVALUATION MATRIX
                        TABLE 161 COMPANY INDUSTRY FOOTPRINT
                        TABLE 162 COMPANY REGION FOOTPRINT
                        TABLE 163 COMPANY FOOTPRINT
     10.11 STRATEGIC DEVELOPMENTS 
              TABLE 164 AUTOMOTIVE COATINGS MARKET: NEW PRODUCT LAUNCHES, 2016–2022
              TABLE 165 AUTOMOTIVE COATING MARKET: DEALS, 2016–2022
              TABLE 166 AUTOMOTIVE COATINGS MARKET: OTHERS, 2018–2022
 
11 COMPANY PROFILES (Page No. - 176)
     11.1 KEY PLAYERS 
(Business Overview, Products & Services, Recent Developments, MnM View)*
             11.1.1 BASF SE
                        TABLE 167 BASF SE.: BUSINESS OVERVIEW
                        FIGURE 46 BASF SE: COMPANY SNAPSHOT
                        TABLE 168 BASF SE: OTHERS
             11.1.2 AXALTA COATING SYSTEMS
                        TABLE 169 AXALTA COATING SYSTEM.: BUSINESS OVERVIEW
                        FIGURE 47 AXALTA COATING SYSTEMS: COMPANY SNAPSHOT
             11.1.3 PPG INDUSTRIES, INC.
                        TABLE 170 PPG INDUSTRIES, INC.: BUSINESS OVERVIEW
                        FIGURE 48 PPG INDUSTRIES, INC.: COMPANY SNAPSHOT
             11.1.4 KANSAI PAINT CO., LTD
                        TABLE 171 KANSAI PAINT CO., LTD: BUSINESS OVERVIEW
                        FIGURE 49 KANSAI PAINT CO., LTD: COMPANY SNAPSHOT
             11.1.5 NIPPON PAINT HOLDINGS CO., LTD.
                        TABLE 172 NIPPON PAINT HOLDINGS CO., LTD: BUSINESS OVERVIEW
                        FIGURE 50 NIPPON PAINT HOLDINGS CO., LTD.: COMPANY SNAPSHOT
             11.1.6 KCC CORPORATION
                        TABLE 173 KCC CORPORATION: BUSINESS OVERVIEW
                        FIGURE 51 KCC CORPORATION: COMPANY SNAPSHOT
             11.1.7 THE SHERWIN-WILLIAMS COMPANY
                        TABLE 174 THE SHERWIN-WILLIAMS COMPANY: BUSINESS OVERVIEW
                        FIGURE 52 THE SHERWIN-WILLIAMS COMPANY: COMPANY SNAPSHOT
             11.1.8 AKZONOBEL N.V.
                        TABLE 175 AKZONOBEL N.V.: BUSINESS OVERVIEW
                        FIGURE 53 AKZONOBEL N.V.: COMPANY SNAPSHOT
             11.1.9 JOTUN A/S
                        TABLE 176 JOTUN A/S: BUSINESS OVERVIEW
                        FIGURE 54 JOTUN A/S: COMPANY SNAPSHOT
             11.1.10 ARKEMA SA
                        TABLE 177 ARKEMA SA: BUSINESS OVERVIEW
                        FIGURE 55 ARKEMA SA: COMPANY SNAPSHOT
     11.2 OTHER COMPANIES 
             11.2.1 US PAINTS
                        TABLE 178 US PAINTS: BUSINESS OVERVIEW
             11.2.2 ASIAN PAINTS LTD
                        TABLE 179 ASIAN PAINTS LTD: BUSINESS OVERVIEW
             11.2.3 BERGER PAINTS INDIA LTD
                        TABLE 180 BERGER PAINTS INDIA LTD: BUSINESS OVERVIEW
             11.2.4 BECKERS GROUP
                        TABLE 181 BECKERS GROUP: BUSINESS OVERVIEW
             11.2.5 HMG PAINTS LTD
                        TABLE 182 HMG PAINTS LTD: BUSINESS OVERVIEW
             11.2.6 SHANGHAI KINLITA CHEMICAL CO., LTD
                        TABLE 183 SHANGHAI KINLITA CHEMICAL CO., LTD: BUSINESS OVERVIEW
             11.2.7 KAPCI COATINGS
                        TABLE 184 KAPCI COATINGS: BUSINESS OVERVIEW
             11.2.8 NATIONAL PAINTS FACTORIES CO. LTD
                        TABLE 185 NATIONAL PAINTS FACTORIES CO. LTD: BUSINESS OVERVIEW
             11.2.9 MAEDER GROUP
                        TABLE 186 MAEDER GROUP: BUSINESS OVERVIEW
             11.2.10 RED SPOT PAINT AND VARNISH CO., INC
                        TABLE 187 RED SPOT PAINT AND VARNISH CO., INC: BUSINESS OVERVIEW
             11.2.11 CONCEPT PAINTS
                        TABLE 188 CONCEPT PAINTS: BUSINESS OVERVIEW
             11.2.12 GUANGZHOU ZHENROUMEI CHEMICAL COATINGS LIMITED
                        TABLE 189 GUANGZHOU ZHENROUMEI CHEMICAL COATINGS LIMITED: BUSINESS OVERVIEW
             11.2.13 QINGYUAN BAOHONG PAINT CO., LTD
                        TABLE 190 QINGYUAN BAOHONG PAINT CO., LTD: BUSINESS OVERVIEW
             11.2.14 WEG S.A.
                        TABLE 191 WEG S.A.: BUSINESS OVERVIEW
             11.2.15 TITAN COATINGS INTERNATIONAL
                        TABLE 192 TITAN COATINGS INTERNATIONAL: BUSINESS OVERVIEW
 
*Details on Business Overview, Products & Services, Recent Developments, MnM View might not be captured in case of unlisted companies.
 
12 ADJACENT AND RELATED MARKETS (Page No. - 231)
     12.1 INTRODUCTION 
     12.2 PAINTS AND COATINGS MARKET LIMITATIONS 
     12.3 PAINTS & COATINGS MARKET DEFINITION 
     12.4 PAINTS & COATINGS MARKET OVERVIEW 
     12.5 PAINTS & COATINGS MARKET ANALYSIS, BY TECHNOLOGY 
             TABLE 193 ARCHITECTURAL PAINTS & COATINGS MARKET SIZE, BY TECHNOLOGY,  2017–2020 (USD MILLION)
             TABLE 194 ARCHITECTURAL PAINTS & COATINGS MARKET SIZE, BY TECHNOLOGY,  2021–2026 (USD MILLION)
             TABLE 195 ARCHITECTURAL PAINTS & COATINGS MARKET SIZE, BY TECHNOLOGY,  2017–2020 (KILOTON)
             TABLE 196 ARCHITECTURAL PAINTS & COATINGS MARKET SIZE, BY TECHNOLOGY,  2021–2026 (KILOTON)
             TABLE 197 INDUSTRIAL PAINTS & COATINGS MARKET SIZE, BY TECHNOLOGY,  2017–2020 (USD MILLION)
             TABLE 198 INDUSTRIAL PAINTS & COATINGS MARKET SIZE, BY TECHNOLOGY,  2021–2026 (USD MILLION)
             TABLE 199 INDUSTRIAL PAINTS & COATINGS MARKET SIZE, BY TECHNOLOGY, 2017–2020 (KILOTON)
             TABLE 200 INDUSTRIAL PAINTS & COATINGS MARKET SIZE, BY TECHNOLOGY, 2021–2026 (KILOTON)
     12.6 PAINTS & COATINGS MARKET ANALYSIS, BY RESIN TYPE 
             TABLE 201 ARCHITECTURAL PAINTS & COATINGS MARKET SIZE, BY RESIN TYPE,  2017–2020 (USD MILLION)
             TABLE 202 ARCHITECTURAL PAINTS & COATINGS MARKET SIZE, BY RESIN TYPE,  2021–2026 (USD MILLION)
             TABLE 203 ARCHITECTURAL PAINTS & COATINGS MARKET SIZE, BY RESIN TYPE,  2017–2020 (KILOTON)
             TABLE 204 ARCHITECTURAL PAINTS & COATINGS MARKET SIZE, BY RESIN TYPE,  2021–2026 (KILOTON)
             TABLE 205 INDUSTRIAL PAINTS & COATINGS MARKET SIZE, BY RESIN TYPE,  2017–2020 (USD MILLION)
             TABLE 206 INDUSTRIAL PAINTS & COATINGS MARKET SIZE, BY RESIN TYPE,  2021–2026 (USD MILLION)
             TABLE 207 INDUSTRIAL PAINTS & COATINGS MARKET SIZE, BY RESIN TYPE, 2017–2020 (KILOTON)
             TABLE 208 INDUSTRIAL PAINTS & COATINGS MARKET SIZE, BY RESIN TYPE, 2021–2026 (KILOTON)
     12.7 PAINTS & COATINGS MARKET ANALYSIS, BY END-USE INDUSTRY 
             TABLE 209 PAINTS & COATINGS MARKET SIZE, BY END-USE INDUSTRY, 2017–2020 (USD MILLION)
             TABLE 210 PAINTS & COATINGS MARKET SIZE, BY END-USE INDUSTRY, 2021–2026 (USD MILLION)
             TABLE 211 PAINTS & COATINGS MARKET SIZE, BY END-USE INDUSTRY, 2017–2020 (KILOTON)
             TABLE 212 PAINTS & COATINGS MARKET SIZE, BY END-USE INDUSTRY, 2021–2026 (KILOTON)
     12.8 PAINTS & COATINGS MARKET ANALYSIS, BY REGION 
             TABLE 213 PAINTS & COATINGS MARKET SIZE, BY REGION, 2017–2020 (USD MILLION)
             TABLE 214 PAINTS & COATINGS MARKET SIZE, BY REGION, 2021–2026 (USD MILLION)
             TABLE 215 PAINTS & COATINGS MARKET SIZE, BY REGION, 2017–2020 (KILOTON)
             TABLE 216 PAINTS & COATINGS MARKET SIZE, BY REGION, 2021–2026 (KILOTON)
 
13 APPENDIX (Page No. - 241)
     13.1 DISCUSSION GUIDE 
     13.2 KNOWLEDGESTORE: MARKETSANDMARKETS’  SUBSCRIPTION PORTAL 
     13.3 CUSTOMIZATION OPTIONS 
     13.4 RELATED REPORTS 
     13.5 AUTHOR DETAILS 

The study involved four major activities in estimating the current market size of automotive coatings. Exhaustive secondary research was done to collect information on the market, the peer market, and the parent market. The next step was to validate these findings, assumptions, and sizing with industry experts across the value chain through primary research. Both supply-side and demand-side approaches were employed to estimate the complete market size. After that, the market breakdown and data triangulation methods were used to estimate the size of the segments and subsegments of the overall market.

Automotive Coating Market Secondary Research

This research report involves the use of extensive secondary sources, directories, and databases, such as Bloomberg, BusinessWeek, Factiva, ICIS, and OneSource to identify and collect information useful for the technical, market-oriented, and commercial study of the automotive coatings market. The secondary sources included annual reports, press releases & investor presentations of companies, white papers, certified publications, and articles from recognized authors, authenticated directories, and databases.

Automotive Coating Market Primary Research

The automotive coatings market comprises several stakeholders, such as raw material suppliers, processors, end-product manufacturers, and regulatory organizations. The demand side of this market is characterized by the development of the construction industry and its end uses such as Furniture, industrial, and packaging. The supply side included industry experts, such as CEOs, vice presidents, marketing directors, technology and innovation directors, and related key executives from various companies and organizations operating in the market. Various primary sources from both the supply and demand sides of the market were interviewed to obtain qualitative and quantitative information.

Following is the breakdown of primary respondents:
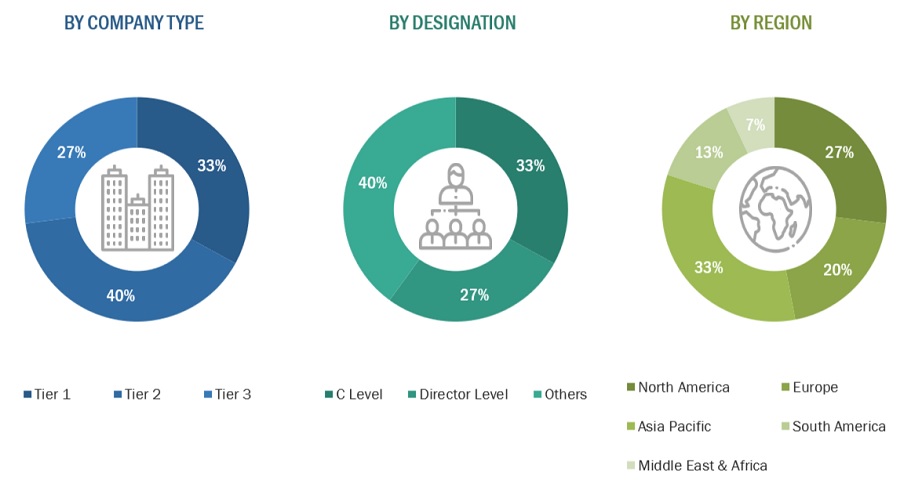
Automotive Coating Market Size, and Share

Notes: Companies are classified based on their revenue–Tier 1 = >USD 7 billion, Tier 2 = USD 500 million to USD 7 billion, and Tier 3 = <USD 500 million.

Others include sales, marketing, and product managers.

To know about the assumptions considered for the study, download the pdf brochure

Automotive Coating Market Size Estimation

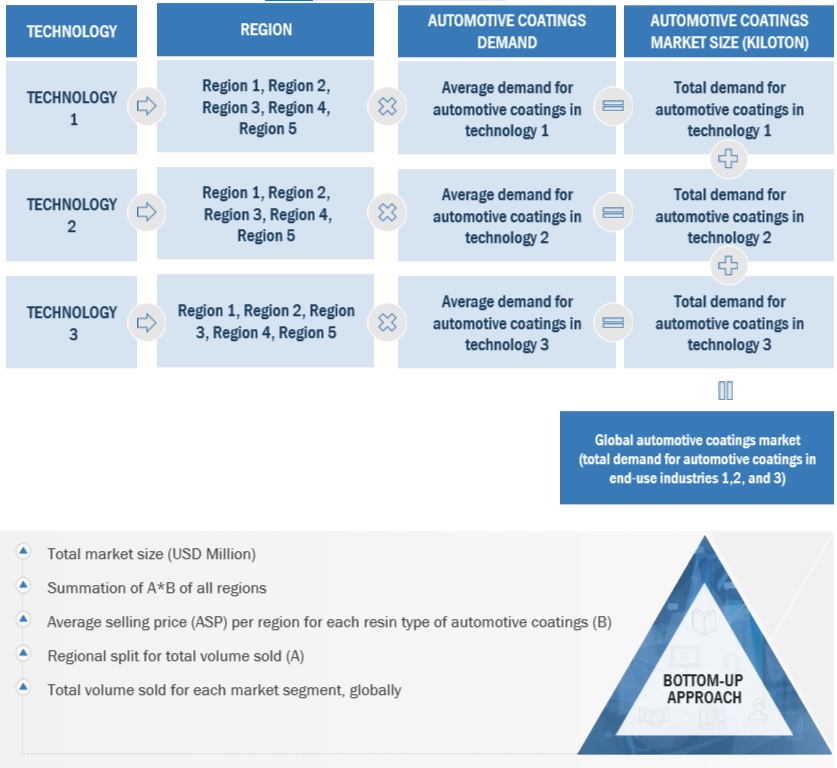
In the market engineering process (which includes calculations for market statistics, market breakdown, market size estimations, market forecast, and data triangulation), the top-down and bottom-up approaches were extensively used, along with several data triangulation methods to gather, verify, and validate the market figures arrived at. Extensive qualitative and quantitative analyses were performed on the complete market engineering process to provide key information/insights throughout the report. The research methodology used to estimate the market size included the following steps:

  • The key players in the market were identified in the respective regions through primary and secondary research.
  • All percentage shares, splits, and breakdowns were determined through secondary sources and verified through primary sources.
  • All possible parameters that affect the market and submarkets covered in this research study were accounted for, viewed in extensive detail, verified through primary research, and analyzed to get the final quantitative and qualitative data. The data was consolidated and added with detailed inputs and analysis from the MarketsandMarkets data repository and presented in this report .

Global Automotive Coatings Market: Top-Down Approach
Automotive Coating Market Size, and Share

Source: Secondary Research, and Interviews with Experts

To know about the assumptions considered for the study, Request for Free Sample Report

Automotive Coating Market Data Triangulation

After arriving at the overall market size from the estimation process explained above, the total market has been split into several segments and sub-segments. Data triangulation and market breakdown procedures have been used wherever applicable to complete the overall market engineering process and to arrive at the exact statistics for all the segments and sub-segments. The data has been triangulated by studying various factors and trends from both the demand and supply sides. In addition, the market has been validated using both the top-down and bottom-up approaches. Then, it was verified through primary interviews. Hence, for every data segment, there are three sources — the top-down approach, the bottom-up approach, and expert interviews. Only when the values arrived at from the three points matched, the data has been assumed to be correct.

Automotive Coating Market Report Objectives

  • To analyze and forecast the size of the automotive coatings market in terms of value
  • To provide detailed information regarding the key factors (drivers, restraints, opportunities, and challenges) influencing the growth of the market and its submarkets
  • To define, describe, and forecast the size of the market by resin type, technology, coat type, and region
  • To forecast the size of the market and its submarkets with respect to five regions (along with their major countries), namely, Asia Pacific, Europe, North America, Middle East & Africa, and South America
  • To strategically analyze each micro markets with respect to individual growth trends, prospects, and their contribution to the overall market
  • To analyze opportunities in the market for stakeholders by identifying high-growth segments and provide a competitive landscape of market leaders
  • To track and analyze competitive developments such as new product launches, mergers & acquisitions, investment & expansions, and joint ventures in the market
  • To strategically profile the key market players and comprehensively analyze their core competencies

Automotive Coating Market Report Available Customizations

MarketsandMarkets offers customizations according to the specific needs of the companies with the given market data.

The following customization options are available for the report:

Automotive Coating Market Regional Analysis

  • Further breakdown of a region with respect to a particular country

Automotive Coating Market Company Information

  • Detailed analysis and profiling of additional market players
Custom Market Research Services

We will customize the research for you, in case the report listed above does not meet with your exact requirements. Our custom research will comprehensively cover the business information you require to help you arrive at strategic and profitable business decisions.

Request Customization

Instant Answers with GPT - Ask Now!

Ask real questions. Get complete answers !
Report Code
CH 4570
Published ON
Dec, 2022
Choose License Type
BUY NOW
  • SHARE
X
Request Customization
Speak to Analyst
Speak to Analyst
OR FACE-TO-FACE MEETING
PERSONALIZE THIS RESEARCH
  • Triangulate with your Own Data
  • Get Data as per your Format and Definition
  • Gain a Deeper Dive on a Specific Application, Geography, Customer or Competitor
  • Any level of Personalization
REQUEST A FREE CUSTOMIZATION
LET US HELP YOU!
  • What are the Known and Unknown Adjacencies Impacting the Automotive Coatings Market
  • What will your New Revenue Sources be?
  • Who will be your Top Customer; what will make them switch?
  • Defend your Market Share or Win Competitors
  • Get a Scorecard for Target Partners
CUSTOMIZED WORKSHOP REQUEST
+1-888-600-6441
  • Call Us
  • +1-888-600-6441 (Corporate office hours)
  • +1-888-600-6441 (US/Can toll free)
  • +44-800-368-9399 (UK office hours)
CONNECT WITH US
ABOUT TRUST ONLINE
©2023 MarketsandMarkets Research Private Ltd. All rights reserved
DMCA.com Protection Status Website Feedback