Automotive Tires Market for OE & Replacement by Rim Size (13-15, 16-18, 19-21,>21 inches), Replacement Market, by Aspect Ratio (<60, 60-70, >70), Section Width (<200, 200-230,>230 mm), Season, Vehicle Type, Retreading Market, and Region - Global Forecast to 2025


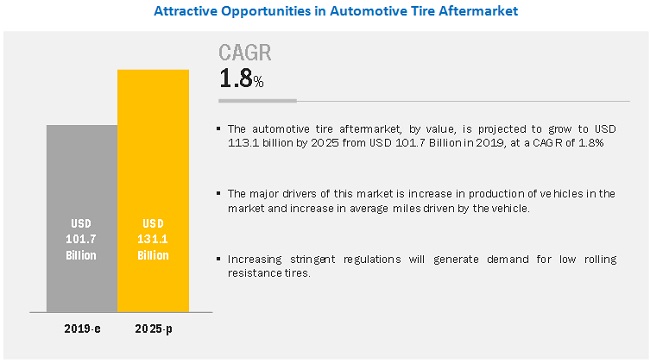
[219 Pages Report] The automotive tires market is projected to grow at a CAGR of 1.8% to reach a market size of USD 113.1 billion by 2025 from 101.7 billion in 2019. The key factors driving the automotive tires market are increased average life of vehicles, growing miles being driven per year, increasing concern towards maintenance and safety, technological advancements leading to longer life of tires, and other factors.
Asia-Pacific is estimated to be the largest market in the automotive tires market for original equipment (OE)
Asia-Pacific has emerged as a hub for automotive production as manufacturers such as BMW AG (Germany) and Volkswagen Group (Germany), which have already set up manufacturing units in this region. The factors such as low production costs, availability of economic labor, lenient emission and safety norms, and government initiatives for FDIs have led the significant investment in the Asia Pacific, which in turn are driving the automotive tires market in this region. Additionally, Asia-Oceania is a hub of considerable tire manufacturers such as Bridgestone Corporation (Japan), Kumho Tire Co. (South Korea), Toyo Tire & Rubber Co., Ltd. (Japan), The Yokohama Rubber Co., Ltd. (Japan), Sumitomo Rubber Industries Ltd. (Japan), Hankook Tires (South Korea), and other Tier-1 suppliers.
Tire with >70 aspect ratio is estimated to be the largest market in the replacement automotive tires market
This aspect ratio has maximum penetration in the heavy trucks and buses segment. In heavy trucks, tires with a higher aspect ratio give better protection to the cargo and in buses, these tires offer a more comfortable ride and protection from road potholes. Around the globe, around 80%-90% of heavy commercial vehicles are equipped with >70 aspect ratio tires and the replacement cost of these tires is also high as compared to other aspect ratio tires. Hence, with the growing demand for trucks & buses in the next few years, the demand for tires with an aspect ratio >70 is projected to hold lions share, thereby driving the global automotive tires market towards good growth ahead.
13-15 rim size segment be the largest segment, by vehicle type
This rim size is usually used in passenger cars with GVWR <3.0 tons. Passenger cars which fall in hatchbacks, & compact sedan segment are equipped with these rim sized tires. For instance, models such as Hyundai Avante, Volkswagen Polo, VW Rapid, Hyundai Accent, and others are equipped with 13-15 rim size tires. These passenger car types are leading in terms of sales in Asian countries as well as other parts of the globe. Hence, the demand for 13-15 rim size tires is the highest. For instance, top-selling passenger cars in China are Hyundai Avante, Nissan Bluebird, Toyota Corolla, Ford Escort VW Santana among others and they are equipped with 13-15 rim size tires. Hence, an increasing number of hatchbacks and compact sedans on the road is driving the aftermarket for 13-15 rim size tires
Retreading of Light Commercial Vehicle (LCV) segment is the fastest-growing market
Retreaded tires give the same mileage compared to new replacement tires, with 30%-50% less cost, and are supplied with the same warranties as that of new tires. For light commercial vehicle manufacturing of single tire consumes on an average 26 liters of oil, however, retreading of the same tire consumes only 9 liters of oil which is almost 34% of the new manufacturing process. On the other hand, according to Retread Tire Association, for pickup trucks, a new set of four tires cost almost double to that of retreaded tires. Few of the leading tire manufacturers have entered the tire retreading business; for instance, the Goodyear Tire and Rubber Company (U.S.) have more than 1,700 tire retreading and service centers globally for commercial trucks. Hence, to cut down the cost, the trend of tire retreading in LCV is increasing gradually.
Key Market Players
Some of the key players in the automotive tire market is dominated by global players and comprises several regional players. The key players in the automotive tires market are Bridgestone Corporation (Japan), Goodyear Tire & Rubber Company (United States), Continental AG (Germany), Michelin (France), and Sumitomo Rubber Industries (Japan). Bridgestone Corporation adopted the strategies of expansion and partnership to retain its leading position in the automotive tire market, whereas The Goodyear Tire & Rubber Company adopted a joint venture as a key strategy to sustain its market position.
Get online access to the report on the World's First Market Intelligence Cloud
- Easy to Download Historical Data & Forecast Numbers
- Company Analysis Dashboard for high growth potential opportunities
- Research Analyst Access for customization & queries
- Competitor Analysis with Interactive dashboard
- Latest News, Updates & Trend analysis
Request Sample Scope of the Report
Get online access to the report on the World's First Market Intelligence Cloud
- Easy to Download Historical Data & Forecast Numbers
- Company Analysis Dashboard for high growth potential opportunities
- Research Analyst Access for customization & queries
- Competitor Analysis with Interactive dashboard
- Latest News, Updates & Trend analysis

|
Report Metric |
Details |
|
Market Size Available for Years |
20172025 |
|
Base Year Considered |
2019 |
|
Forecast Period |
20192025 |
|
Forecast Units |
Value (USD) and Volume (Million Units) |
|
Segments Covered |
Aftermarket (by Rim Size, Section Width, Season, Aspect Ratio and vehicle type), OE Market (Rim Size, by type, and Vehicle type), Retreading Market by Vehicle type |
|
Geographies Covered |
Asia Pacific, Europe, North America, Latin America and the Middle East and Africa (RoW in case of aftermarket) |
|
Companies Covered |
Key players in the automotive tires market are Bridgestone Corporation (Japan), Goodyear Tire & Rubber Company (United States), Continental AG (Germany), Michelin (France) and Sumitomo Rubber Industries (Japan) |
This research report categorizes the automotive tire market based on the following segments
Automotive Tires Aftermarket, By Section Width
- <200MM
- 200-230MM
- >230MM
Automotive Tires Retreading Market, By Vehicle Type
- Passenger Car
- Light Commercial Vehicle
- Heavy Commercial Vehicle
Automotive Tires Aftermarket, By Vehicle Type
- Passenger Car
- Light Commercial Vehicle
- Heavy Commercial Vehicle
Automotive Tires Aftermarket, By Aspect Ratio
- <60
- 60-70
- >70
Automotive Tires OE Market, By Vehicle Type and Rim Size
- Passenger Car
- Light Commercial Vehicle
- Bus
- Truck
Automotive Tires OE Market, By Type
- Radial
- Tube
- Tubeless
- Bias
Automotive Tires Aftermarket, By Rim Size
- 13"-15
- 16"-18
- 19"-21
- >21"
Automotive Tires Aftermarket, By Season
- Summer
- Winter
- Studded
- Non-studded
- All Seasons
Automotive Tires OE Market, By Region
- Asia Pacific
- Europe
- North America
- South America
- Middle East and Africa
Automotive Tires Retreading and Aftermarket, By Region
- >Asia Pacific
- Europe
- North America
- RoW
Key questions addressed by the report
- How the OE and Aftermarket demand varies by region and vehicle type?
- What would be the demand of tire rim size by vehicle type and region?
- How will tires retreading market shape up in the future?
- What are the current and future tire material trends in the market?
- How the penetration of season tires varies by region (summer, winter, and all-season)?
- Which are the key players in the global automotive tire market?
The report also features an exclusive competitive leadership mapping of key players represented in a four-quadrant box, representing the visionary leaders as well as dynamic differentiators
To speak to our analyst for a discussion on the above findings, click Speak to Analyst
TABLE OF CONTENTS
1 INTRODUCTION (Page No. - 22)
1.1 OBJECTIVES OF THE STUDY
1.2 PRODUCT DEFINITION
1.3 MARKET SCOPE
1.4 LIMITATIONS
1.5 STAKEHOLDERS
2 RESEARCH METHODOLOGY (Page No. - 26)
2.1 RESEARCH DATA
2.2 SECONDARY DATA
2.2.1 KEY SECONDARY SOURCES FOR VEHICLE PRODUCTION
2.2.2 KEY SECONDARY SOURCES FOR MARKET SIZING
2.2.3 KEY DATA FROM SECONDARY SOURCES
2.3 PRIMARY DATA
2.3.1 SAMPLING TECHNIQUES & DATA COLLECTION METHODS
2.3.2 PRIMARY PARTICIPANTS
2.4 MARKET SIZE ESTIMATION
2.4.1 BOTTOM-UP APPROACH: AUTOMOTIVE TIRE OE MARKET (RIM SIZE AND REGIONAL/ COUNTRY LEVEL)
2.4.2 TOP-DOWN APPROACH: AUTOMOTIVE TIRE OE MARKET (TIRE TYPE)
2.4.3 BOTTOM-UP APPROACH: AUTOMOTIVE TIRE AFTERMARKET (BY VEHICLE TYPE AND REGION)
2.4.4 TOP-DOWN APPROACH: AUTOMOTIVE TIRE AFTERMARKET (BY SECTION WIDTH, ASPECT RATIO, RIM SIZE, AND SEASON)
2.4.5 BOTTOM-UP APPROACH: AUTOMOTIVE TIRE RETREADING MARKET (BY REGION AND VEHICLE TYPE)
2.5 MARKET BREAKDOWN AND DATA TRIANGULATION
2.6 ASSUMPTIONS & ASSOCIATED RISKS
2.6.1 AVERAGE NUMBER OF TIRES EMPLOYED, BY VEHICLE TYPE
2.6.2 AVERAGE NUMBER OF TIRES REPLACED IN A SINGLE SERVICE CYCLE, BY VEHICLE TYPE
3 EXECUTIVE SUMMARY (Page No. - 36 )
4 PREMIUM INSIGHTS (Page No. - 40)
4.1 AUTOMOTIVE TIRE MARKET: TREND, FORECAST, OPPORTUNITY
4.2 AUTOMOTIVE TIRE OE MARKET, BY REGION
4.3 AUTOMOTIVE TIRE AFTERMARKET, BY REGION
4.4 AUTOMOTIVE TIRE OE MARKET, BY VEHICLE TYPE
4.5 AUTOMOTIVE TIRE OE MARKET, BY TYPE
4.6 AUTOMOTIVE TIRE AFTERMARKET, BY SEASON
4.7 AUTOMOTIVE TIRE AFTERMARKET, BY SECTION WIDTH
4.8 AUTOMOTIVE TIRE AFTERMARKET, BY ASPECT RATIO
4.9 AUTOMOTIVE TIRE AFTERMARKET, BY RIM SIZE
4.10 AUTOMOTIVE TIRE AFTERMARKET, BY VEHICLE TYPE
4.11 AUTOMOTIVE TIRE RETREADING MARKET, BY VEHICLE TYPE
5 RECOMMENDATIONS BY MARKETSANDMARKETS (Page No. - 47)
5.1 ASIA PACIFIC IS THE PRIORITY MARKET TO FOCUS FOR AUTOMOTIVE TIRE MANUFACTURERS
5.2 COMPANIES SHOULD ENHANCE FOCUS ON HIGH PERFORMANCE AND GREEN TIRES
5.3 LARGE-SCALE RETREADING OF HEAVY COMMERCIAL VEHICLE TIRES
5.4 CONCLUSION
6 AUTOMOTIVE TIRE AFTERMARKET, BY SECTION WIDTH & VEHICLE TYPE (Page No. - 49)
6.1 INTRODUCTION
6.2 RESEARCH METHODOLOGY
6.2.1 ASSUMPTIONS
6.2.2 INDUSTRY INSIGHTS
6.3 <200 MM
6.4 200-230 MM
6.5 >230 MM
7 AUTOMOTIVE TIRE AFTERMARKET, BY ASPECT RATIO & VEHICLE TYPE (Page No. - 59)
7.1 INTRODUCTION
7.2 RESEARCH METHODOLOGY
7.2.1 ASSUMPTIONS
7.2.2 INDUSTRY INSIGHTS
7.3 <60
7.4 60-70
7.5 >70
8 AUTOMOTIVE TIRE AFTERMARKET, BY RIM SIZE & VEHICLE TYPE (Page No. - 69)
8.1 INTRODUCTION
8.2 RESEARCH METHODOLOGY
8.2.1 ASSUMPTIONS
8.2.2 INDUSTRY INSIGHTS
8.3 13"-15"
8.4 16"-18"
8.5 19"-21"
8.6 21"-26"
9 AUTOMOTIVE TIRE AFTERMARKET, BY SEASON (Page No. - 80)
9.1 INTRODUCTION
9.2 RESEARCH METHODOLOGY
9.2.1 ASSUMPTIONS
9.2.2 INDUSTRY INSIGHTS
9.3 SUMMER TIRES
9.4 WINTER TIRES
9.4.1 STUDDED TIRES
9.4.2 NON-STUDDED TIRES
9.5 ALL-SEASON TIRES
10 AUTOMOTIVE TIRE AFTERMARKET, BY VEHICLE TYPE (Page No. - 88)
10.1 INTRODUCTION
10.2 RESEARCH METHODOLOGY
10.2.1 ASSUMPTIONS
10.2.2 INDUSTRY INSIGHTS
10.3 PASSENGER CAR
10.4 LIGHT COMMERCIAL VEHICLE
10.5 HEAVY COMMERCIAL VEHICLE
11 AUTOMOTIVE TIRE RETREADING MARKET, BY VEHICLE TYPE (Page No. - 95)
11.1 INTRODUCTION
11.2 RESEARCH METHODOLOGY
11.2.1 ASSUMPTIONS
11.2.2 INDUSTRY INSIGHTS
11.3 PASSENGER CAR
11.4 LIGHT COMMERCIAL VEHICLE
11.5 HEAVY COMMERCIAL VEHICLE
12 AUTOMOTIVE TIRE OE MARKET, BY VEHICLE TYPE AND RIM SIZE (Page No. - 102)
12.1 INTRODUCTION
12.2 RESEARCH METHODOLOGY
12.2.1 ASSUMPTIONS
12.2.2 INDUSTRY INSIGHTS
12.3 PASSENGER CAR
12.3.1 13"-15"
12.3.2 16"-18"
12.3.3 19"-21"
12.3.4 >21
12.4 LIGHT COMMERCIAL VEHICLES
12.4.1 13"-15"
12.4.2 16"-18"
12.4.3 19"-21"
12.4.4 >21
12.5 BUS
12.5.1 16"-18"
12.5.2 19"-21"
12.5.3 >21
12.6 TRUCK
12.6.1 16"-18"
12.6.2 19"-21"
12.6.3 >21
13 AUTOMOTIVE TIRE OE MARKET, BY TYPE (Page No. - 123)
13.1 INTRODUCTION
13.2 RESEARCH METHODOLOGY
13.2.1 ASSUMPTIONS
13.2.2 INDUSTRY INSIGHTS
13.3 RADIAL TIRES
13.3.1 TUBE TIRES
13.3.2 TUBELESS TIRES
13.4 BIAS TIRES
14 AUTOMOTIVE TIRE OE MARKET, BY REGION (Page No. - 131)
14.1 INTRODUCTION
14.1.1 RESEARCH METHODOLOGY
14.1.2 ASSUMPTIONS
14.2 ASIA PACIFIC
14.2.1 CHINA
14.2.1.1 Increasing production of passenger cars is driving the growth of tires market
14.2.2 INDIA
14.2.2.1 Relatively less penetration of premium vehicles can impact the demand for high-performance tires in India
14.2.3 JAPAN
14.2.3.1 High demand for premium vehicles is likely to boost the demand for large rim size tires in Japan
14.2.4 SOUTH KOREA
14.2.4.1 Automotive tire OE market in Korea is largely driven by passenger cars
14.2.5 THAILAND
14.2.5.1 High production of pickup trucks in Thailand is estimated to drive the market for tires
14.2.6 REST OF ASIA PACIFIC
14.3 NORTH AMERICA
14.3.1 CANADA
14.3.1.1 Decreased production of passenger cars can impact tire market
14.3.2 MEXICO
14.3.2.1 Increase in demand for large pickup trucks and small cars is likely to boost the tire market in Mexico
14.3.3 US
14.3.3.1 Increasing number of CUVs is likely to drive the tire market
14.4 EUROPE
14.4.1 GERMANY
14.4.1.1 Tire demand in Germany for bus is anticipated to grow at a fast rate
14.4.2 FRANCE
14.4.2.1 Increasing demand for subcompact cars is likely to boost the tire market
14.4.3 UK
14.4.3.1 Passenger car segment accounts for 83% of tire market share
14.4.4 SPAIN
14.4.4.1 Passenger car and truck are the fastest growing segments of tire market in Spain
14.4.5 RUSSIA
14.4.5.1 Buses and trucks are growing at a fast rate despite less market share
14.4.6 ITALY
14.4.6.1 Passenger car tire market is likely to decrease with slight decrease in production
14.4.7 TURKEY
14.4.7.1 Trucks are likely to drive the automotive tire market in Turkey
14.4.8 REST OF EUROPE
14.5 LATIN AMERICA
14.5.1 BRAZIL
14.5.1.1 Bus segment with less market share is likely to grow at significant rate
14.5.2 ARGENTINA
14.5.2.1 Less production of vehicles leads to limited demand for tires
14.5.3 REST OF LATIN AMERICA
14.6 MIDDLE EAST AND AFRICA
14.6.1 SOUTH AFRICA
14.6.1.1 Bus segment with less market share is likely to grow at significant rate
14.6.2 IRAN
14.6.2.1 Light commercial vehicles are likely to drive the automotive tire market in Iran
14.6.3 REST OF MIDDLE EAST AND AFRICA
15 COMPETITIVE LANDSCAPE (Page No. - 164)
15.1 OVERVIEW
15.2 MARKET RANKING ANALYSIS KEY TIRE MANUFACTURERS, 2018
15.3 MARKET COMPETITIVE LEADERSHIP MAPPING
15.3.1 TERMINOLOGY
15.3.2 VISIONARY LEADERS
15.3.3 INNOVATORS
15.3.4 DYNAMIC DIFFERENTIATORS
15.3.5 EMERGING COMPANIES
15.4 COMPANY-WISE PRODUCT OFFERING ANALYSIS
15.5 COMPANY-WISE BUSINESS STRATEGY ANALYSIS
15.6 WINNERS VS. LOSERS
15.6.1 WINNERS
15.6.2 TAIL-ENDERS/LOSERS
15.7 COMPETITIVE SCENARIO
15.7.1 NEW PRODUCT DEVELOPMENTS/LAUNCHES
15.7.2 EXPANSION, 2018-2019
15.7.3 ACQUISITION/JOINT VENTURE
15.7.4 PARTNERSHIPS/CONTRACTS, 2017-2018
15.8 RIGHT TO WIN
16 COMPANY PROFILES (Page No. - 179)
16.1 BRIDGESTONE CORPORATION
(Business Overview, Products Offered, Recent Developments, SWOT Analysis, and MNM View)*
16.2 CONTINENTAL AG
16.3 GOODYEAR TIRE & RUBBER COMPANY
16.4 MICHELIN
16.5 PIRELLI & C. S.P.A
16.6 SUMITOMO RUBBER INDUSTRIES LTD.
16.7 HANKOOK TIRE
16.8 YOKOHAMA RUBBER CO. LTD.
16.9 COOPER TIRE & RUBBER COMPANY
16.1 TOYO TIRE CORPORATION
16.11 ADDITIONAL COMPANIES
16.11.1 NORTH AMERICA
16.11.1.1 TITAN INTERNATIONAL INC.
16.11.2 EUROPE
16.11.2.1 CODA DEVELOPMENT
16.11.2.2 DUNLOP
16.11.3 ASIA OCEANIA
16.11.3.1 KUMHO TIRE
16.11.3.2 NOKIAN TYRES PLC
16.11.3.3 APOLLO TYRES LTD.
16.11.3.4 MRF LTD.
16.11.3.5 JK TYRE & INDUSTRIES LTD.
16.11.3.6 CEAT LTD.
16.11.3.7 NEXEN TIRE CORPORATION
*Details on Business Overview, Products Offered, Recent Developments, SWOT Analysis, and MNM View might not be captured in case of unlisted companies.
17 APPENDIX (Page No. - 212)
17.1 INSIGHTS OF INDUSTRY EXPERTS
17.2 DISCUSSION GUIDE
17.3 KNOWLEDGE STORE: MARKETSANDMARKETS SUBSCRIPTION PORTAL
17.4 AVAILABLE CUSTOMIZATIONS
17.4.1 ADDITIONAL COMPANY PROFILES (BUSINESS OVERVIEW, SWOT ANALYSIS, RECENT DEVELOPMENTS, AND MNM VIEW)
17.4.2 AUTOMOTIVE TIRE AFTERMARKET, BY VEHICLE TYPE (COUNTRY LEVEL)
17.4.2.1 Passenger Car
17.4.2.2 Light Commercial vehicle
17.4.2.3 Heavy Commercial vehicle
17.4.3 AUTOMOTIVE TIRE OE MARKET, BY SEASON
17.4.3.1 Summer
17.4.3.2 Winter
17.4.3.2.1 Studded
17.4.3.2.2 Non-studded
17.4.3.3 All-season
17.4.4 AUTOMOTIVE TIRE OE MARKET, BY SECTION WIDTH
17.4.4.1 <200MM
17.4.4.2 200-230MM
17.4.4.3 >230MM
17.4.5 AUTOMOTIVE TIRE OE MARKET, BY ASPECT RATIO
17.4.5.1 <60
17.4.5.2 60-70
17.4.5.3 >70
17.4.6 AUTOMOTIVE TIRE OE MARKET, BY MATERIAL AND REGION
17.4.6.1 Polymers
17.4.6.2 Fillers
17.4.6.3 Softeners
17.4.6.4 Curatives
17.4.6.5 Others
17.4.7 AUTOMOTIVE TIRE RETREADING MARKET, BY RETREAD PROCESS (COMMERCIAL VEHICLE)
17.4.7.1 Mold Cure
17.4.7.2 Pre-Cure
17.5 RELATED REPORTS
17.6 AUTHOR DETAILS
LIST OF TABLES (177 Tables)
TABLE 1 INCLUSIONS & EXCLUSIONS
TABLE 2 AUTOMOTIVE TIRE AFTERMARKET, BY SECTION WIDTH, 20172025 (MILLION UNITS)
TABLE 3 AUTOMOTIVE TIRE AFTERMARKET, BY SECTION WIDTH, 20172025 (USD MILLION)
TABLE 4 <200 MM SECTION WIDTH: AUTOMOTIVE TIRE AFTERMARKET, BY REGION & VEHICLE TYPE, 20172025 (MILLION UNITS)
TABLE 5 <200 MM SECTION WIDTH: AUTOMOTIVE TIRE AFTERMARKET, BY REGION & VEHICLE TYPE, 20172025 (USD MILLION)
TABLE 6 200-230 MM SECTION WIDTH: AUTOMOTIVE TIRE AFTERMARKET, BY REGION & VEHICLE TYPE, 20172025 (MILLION UNITS)
TABLE 7 200-230 MM SECTION WIDTH: AUTOMOTIVE TIRE AFTERMARKET, BY REGION & VEHICLE TYPE, 20172025 (USD MILLION)
TABLE 8 >230 MM SECTION WIDTH: AUTOMOTIVE TIRE AFTERMARKET, BY REGION & VEHICLE TYPE, 20172025 (MILLION UNITS)
TABLE 9 >230 MM SECTION WIDTH: AUTOMOTIVE TIRE AFTERMARKET, BY REGION & VEHICLE TYPE, 20172025 (USD MILLION)
TABLE 10 AUTOMOTIVE TIRE AFTERMARKET, BY ASPECT RATIO, 20172025 (MILLION UNITS)
TABLE 11 AUTOMOTIVE TIRE AFTERMARKET, BY ASPECT RATIO, 20172025 (USD MILLION)
TABLE 12 <60 ASPECT RATIO: AUTOMOTIVE TIRE AFTERMARKET, BY REGION & VEHICLE TYPE, 20172025 (MILLION UNITS)
TABLE 13 <60 ASPECT RATIO: AUTOMOTIVE TIRE AFTERMARKET, BY REGION & VEHICLE TYPE, 20172025 (USD MILLION)
TABLE 14 60-70 ASPECT RATIO: AUTOMOTIVE TIRE AFTERMARKET, BY REGION & VEHICLE TYPE, 20172025 (MILLION UNITS)
TABLE 15 60-70 ASPECT RATIO: AUTOMOTIVE TIRE AFTERMARKET, BY REGION & VEHICLE TYPE, 20172025 (USD MILLION)
TABLE 16 >70 ASPECT RATIO: AUTOMOTIVE TIRE AFTERMARKET, BY REGION & VEHICLE TYPE, 20172025 (MILLION UNITS)
TABLE 17 >70 ASPECT RATIO: AUTOMOTIVE TIRE AFTERMARKET, BY REGION & VEHICLE TYPE, 20172025 (USD MILLION)
TABLE 18 AUTOMOTIVE TIRE AFTERMARKET, BY RIM SIZE, 20172025 (MILLION UNITS)
TABLE 19 AUTOMOTIVE TIRE AFTERMARKET, BY RIM SIZE, 20172025 (USD MILLION)
TABLE 20 13-15 RIM SIZE: AUTOMOTIVE TIRE AFTERMARKET, BY REGION & VEHICLE TYPE, 20172025 (MILLION UNITS)
TABLE 21 13-15 RIM SIZE: AUTOMOTIVE TIRE AFTERMARKET, BY REGION & VEHICLE TYPE, 20172025 (USD MILLION)
TABLE 22 16-18 RIM SIZE: AUTOMOTIVE TIRE AFTERMARKET, BY REGION & VEHICLE TYPE, 20172025 (MILLION UNITS)
TABLE 23 16-18 RIM SIZE: AUTOMOTIVE TIRE AFTERMARKET, BY REGION & VEHICLE TYPE, 20172025 (USD MILLION)
TABLE 24 19-21 RIM SIZE: AUTOMOTIVE TIRE AFTERMARKET, BY REGION & VEHICLE TYPE, 20172025 (MILLION UNITS)
TABLE 25 19-21 RIM SIZE: AUTOMOTIVE TIRE AFTERMARKET, BY REGION & VEHICLE TYPE, 20172025 (USD MILLION)
TABLE 26 21-26 RIM SIZE: AUTOMOTIVE TIRE AFTERMARKET, BY REGION & VEHICLE TYPE, 20172025 (MILLION UNITS)
TABLE 27 21-26 RIM SIZE: AUTOMOTIVE TIRE AFTERMARKET, BY REGION & VEHICLE TYPE, 20172025 (USD MILLION)
TABLE 28 AUTOMOTIVE TIRE AFTERMARKET, BY SEASON, 20172025 (MILLION UNITS)
TABLE 29 AUTOMOTIVE TIRE AFTERMARKET, BY SEASON, 20172025 (USD MILLION)
TABLE 30 SUMMER TIRE: AUTOMOTIVE TIRE AFTERMARKET, BY REGION, 20172025 (MILLION UNITS)
TABLE 31 SUMMER TIRE: AUTOMOTIVE TIRE AFTERMARKET, BY REGION, 20172025 (USD MILLION)
TABLE 32 WINTER TIRE: AUTOMOTIVE TIRE AFTERMARKET, BY REGION, 20172025 (MILLION UNITS)
TABLE 33 WINTER TIRE: AUTOMOTIVE TIRE AFTERMARKET, BY REGION, 20172025 (USD MILLION)
TABLE 34 STUDDED WINTER TIRE AFTERMARKET, BY REGION, 20172025 (MILLION UNITS)
TABLE 35 STUDDED WINTER TIRE AFTERMARKET, BY REGION, 20172025 (USD MILLION)
TABLE 36 NON-STUDDED WINTER TIRE AFTERMARKET, BY REGION, 20172025 (MILLION UNITS)
TABLE 37 NON-STUDDED WINTER TIRE AFTERMARKET, BY REGION, 20172025 (USD MILLION)
TABLE 38 ALL-SEASON TIRE: AUTOMOTIVE TIRE AFTERMARKET, BY REGION, 20172025 (MILLION UNITS)
TABLE 39 ALL-SEASON TIRE: AUTOMOTIVE TIRE AFTERMARKET, BY REGION, 20172025 (USD MILLION)
TABLE 40 AUTOMOTIVE TIRE AFTERMARKET, BY VEHICLE TYPE, 20172025 (MILLION UNITS)
TABLE 41 AUTOMOTIVE TIRE AFTERMARKET, BY VEHICLE TYPE, 20172025 (USD MILLION)
TABLE 42 PASSENGER CAR: AUTOMOTIVE TIRE AFTERMARKET, BY REGION, 20172025 (MILLION UNITS)
TABLE 43 PASSENGER CAR: AUTOMOTIVE TIRE AFTERMARKET, BY REGION, 20172025 (USD MILLION)
TABLE 44 LIGHT COMMERCIAL VEHICLE: AUTOMOTIVE TIRE AFTERMARKET, BY REGION, 20172025 (MILLION UNITS)
TABLE 45 LIGHT COMMERCIAL VEHICLE: AUTOMOTIVE TIRE AFTERMARKET, BY REGION, 20172025 (USD MILLION)
TABLE 46 HEAVY COMMERCIAL VEHICLE: AUTOMOTIVE TIRE AFTERMARKET, BY REGION, 20172025 (MILLION UNITS)
TABLE 47 HEAVY COMMERCIAL VEHICLE: AUTOMOTIVE TIRE AFTERMARKET, BY REGION, 20172025 (USD MILLION)
TABLE 48 AUTOMOTIVE TIRE RETREADING MARKET, BY VEHICLE TYPE, 20172025 (MILLION UNITS)
TABLE 49 AUTOMOTIVE TIRE RETREADING MARKET, BY VEHICLE TYPE, 20172025 (USD MILLION)
TABLE 50 PASSENGER CAR: AUTOMOTIVE TIRE RETREADING MARKET, BY REGION, 20172025 (MILLION UNITS)
TABLE 51 PASSENGER CAR: AUTOMOTIVE TIRE RETREADING MARKET, BY REGION, 20172025 (USD MILLION)
TABLE 52 LIGHT COMMERCIAL VEHICLE: AUTOMOTIVE TIRE RETREADING MARKET, BY REGION, 20172025 (MILLION UNITS)
TABLE 53 LIGHT COMMERCIAL VEHICLE: AUTOMOTIVE TIRE RETREADING MARKET, BY REGION, 20172025 (USD MILLION)
TABLE 54 HEAVY COMMERCIAL VEHICLE: AUTOMOTIVE TIRE RETREADING MARKET, BY REGION, 20172025 (MILLION UNITS)
TABLE 55 HEAVY COMMERCIAL VEHICLE: AUTOMOTIVE TIRE RETREADING MARKET, BY REGION, 20172025 (USD MILLION)
TABLE 56 AUTOMOTIVE TIRE OE MARKET, BY VEHICLE TYPE, 20172025 (MILLION UNITS)
TABLE 57 AUTOMOTIVE TIRE OE MARKET, BY VEHICLE TYPE, 20172025 (USD MILLION)
TABLE 58 PASSENGER CAR: AUTOMOTIVE TIRE MARKET, BY RIM SIZE, 20172025 (MILLION UNITS)
TABLE 59 PASSENGER CAR: AUTOMOTIVE TIRE MARKET, BY RIM SIZE, 20172025 (USD MILLION)
TABLE 60 RIM SIZE 13"-15": PASSENGER CAR TIRE MARKET, BY REGION, 20172025 (MILLION UNITS)
TABLE 61 RIM SIZE 13"-15": PASSENGER CAR TIRE MARKET, BY REGION, 20172025 (USD MILLION)
TABLE 62 RIM SIZE 16"-18": PASSENGER CAR TIRE MARKET, BY REGION, 20172025 (MILLION UNITS)
TABLE 63 RIM SIZE 16"-18": PASSENGER CAR TIRE MARKET, BY REGION, 20172025 (USD MILLION)
TABLE 64 RIM SIZE 19"-21": PASSENGER CAR TIRE MARKET, BY REGION, 20172025 (MILLION UNITS)
TABLE 65 RIM SIZE 19"-21": PASSENGER CAR TIRE MARKET, BY REGION, 20172025 (USD MILLION)
TABLE 66 RIM SIZE >21: PASSENGER CAR TIRE MARKET, BY REGION, 20172025 (MILLION UNITS)
TABLE 67 RIM SIZE >21: PASSENGER CAR TIRE MARKET, BY REGION, 20172025 (USD MILLION)
TABLE 68 LIGHT COMMERCIAL VEHICLE: AUTOMOTIVE TIRE MARKET, BY RIM SIZE, 20172025 (MILLION UNITS)
TABLE 69 LIGHT COMMERCIAL VEHICLE: AUTOMOTIVE TIRE MARKET, BY RIM SIZE, 20172025 (USD MILLION)
TABLE 70 RIM SIZE 13"-15": LIGHT COMMERCIAL VEHICLE TIRE MARKET, BY REGION, 20172025 (MILLION UNITS)
TABLE 71 RIM SIZE 13"-15": LIGHT COMMERCIAL VEHICLE TIRE MARKET, BY REGION, 20172025 (USD MILLION)
TABLE 72 RIM SIZE 16"-18": LIGHT COMMERCIAL VEHICLE TIRE MARKET, BY REGION, 20172025 (MILLION UNITS)
TABLE 73 RIM SIZE 16"-18": LIGHT COMMERCIAL VEHICLE TIRE MARKET, BY REGION, 20172025 (USD MILLION)
TABLE 74 RIM SIZE 19"-21": LIGHT COMMERCIAL VEHICLE TIRE MARKET, BY REGION, 20172025 (MILLION UNITS)
TABLE 75 RIM SIZE 19"-21": LIGHT COMMERCIAL VEHICLE TIRE MARKET, BY REGION, 20172025 (USD MILLION)
TABLE 76 RIM SIZE >21: LIGHT COMMERCIAL VEHICLE TIRE MARKET, BY REGION, 20172025 (MILLION UNITS)
TABLE 77 RIM SIZE >21: LIGHT COMMERCIAL VEHICLE TIRE MARKET, BY REGION, 20172025 (USD MILLION)
TABLE 78 BUS: AUTOMOTIVE TIRE MARKET, BY RIM SIZE, 20172025 (MILLION UNITS)
TABLE 79 BUS: AUTOMOTIVE TIRE MARKET, BY RIM SIZE, 20172025 (USD MILLION)
TABLE 80 RIM SIZE 16"-18": BUS TIRE MARKET, BY REGION, 20172025 (MILLION UNITS)
TABLE 81 RIM SIZE 16"-18": BUS TIRE MARKET, BY REGION, 20172025 (USD MILLION)
TABLE 82 RIM SIZE 19"-21": BUS TIRE MARKET, BY REGION, 20172025 (MILLION UNITS)
TABLE 83 RIM SIZE 19"-21": BUS TIRE MARKET, BY REGION, 20172025 (USD MILLION)
TABLE 84 RIM SIZE >21: BUS TIRE MARKET, BY REGION, 20172025 (MILLION UNITS)
TABLE 85 RIM SIZE >21: BUS TIRE MARKET, BY REGION, 20172025 (USD MILLION)
TABLE 86 TRUCK: AUTOMOTIVE TIRE MARKET, BY RIM SIZE, 20172025 (MILLION UNITS)
TABLE 87 TRUCK: AUTOMOTIVE TIRE MARKET, BY RIM SIZE, 20172025 (USD MILLION)
TABLE 88 RIM SIZE 16"-18": TRUCK TIRE MARKET, BY REGION, 20172025 (MILLION UNITS)
TABLE 89 RIM SIZE 16"-18": TRUCK TIRE MARKET, BY REGION, 20172025 (USD MILLION)
TABLE 90 RIM SIZE 19"-21": TRUCK TIRE MARKET, BY REGION, 20172025 (MILLION UNITS)
TABLE 91 RIM SIZE 19"-21": TRUCK TIRE MARKET, BY REGION, 20172025 (USD MILLION)
TABLE 92 RIM SIZE >21: TRUCK TIRE MARKET, BY REGION, 20172025 (MILLION UNITS)
TABLE 93 RIM SIZE >21: TRUCK TIRE MARKET, BY REGION, 20172025 (USD MILLION)
TABLE 94 AUTOMOTIVE TIRE OE MARKET, BY TYPE, 20172025 (MILLION UNITS)
TABLE 95 AUTOMOTIVE TIRE OE MARKET, BY TYPE, 20172025 (USD MILLION)
TABLE 96 RADIAL TIRE: AUTOMOTIVE TIRE MARKET, BY REGION, 20172025 (MILLION UNITS)
TABLE 97 RADIAL TIRE: AUTOMOTIVE TIRE MARKET, BY REGION, 20172025 (USD MILLION)
TABLE 98 TUBE RADIAL TIRE MARKET, BY REGION, 20172025 (MILLION UNITS)
TABLE 99 TUBE RADIAL TIRE MARKET, BY REGION, 20172025 (USD MILLION)
TABLE 100 TUBELESS RADIAL TIRE MARKET, BY REGION, 20172025 (MILLION UNITS)
TABLE 101 TUBELESS RADIAL TIRE MARKET, BY REGION, 20172025 (USD MILLION)
TABLE 102 BIAS TIRE: AUTOMOTIVE TIRE MARKET, BY REGION, 20172025 (MILLION UNITS)
TABLE 103 BIAS TIRE: AUTOMOTIVE TIRE MARKET, BY REGION, 20172025 (USD MILLION)
TABLE 104 AUTOMOTIVE TIRE MARKET, BY REGION, 20172025 (MILLION UNITS)
TABLE 105 AUTOMOTIVE TIRE MARKET, BY REGION, 20172025 (USD MILLION)
TABLE 106 ASIA PACIFIC PASSENGER CAR PRODUCTION, BY COUNTRY, 20172025 (UNITS)
TABLE 107 ASIA PACIFIC LIGHT COMMERCIAL VEHICLE PRODUCTION, BY COUNTRY, 20172025 (UNITS)
TABLE 108 ASIA PACIFIC TRUCK PRODUCTION, BY COUNTRY, 20172025 (UNITS)
TABLE 109 ASIA PACIFIC BUS PRODUCTION, BY COUNTRY, 20172025 (UNITS)
TABLE 110 ASIA PACIFIC: AUTOMOTIVE TIRE MARKET, BY COUNTRY, 20172025 (MILLION UNITS)
TABLE 111 ASIA PACIFIC: AUTOMOTIVE TIRE MARKET, BY COUNTRY, 20172025 (USD MILLION)
TABLE 112 CHINA: AUTOMOTIVE TIRE MARKET, BY VEHICLE TYPE, 20172025 (MILLION UNITS)
TABLE 113 CHINA: AUTOMOTIVE TIRE MARKET, BY VEHICLE TYPE, 20172025 (USD MILLION)
TABLE 114 INDIA: AUTOMOTIVE TIRE MARKET, BY VEHICLE TYPE, 20172025 (MILLION UNITS)
TABLE 115 INDIA: AUTOMOTIVE TIRE MARKET, BY VEHICLE TYPE, 20172025 (USD MILLION)
TABLE 116 JAPAN: AUTOMOTIVE TIRE MARKET, BY VEHICLE TYPE, 20172025 (MILLION UNITS)
TABLE 117 JAPAN: AUTOMOTIVE TIRE MARKET, BY VEHICLE TYPE, 20172025 (USD MILLION)
TABLE 118 SOUTH KOREA: AUTOMOTIVE TIRE MARKET, BY VEHICLE TYPE, 20172025 (MILLION UNITS)
TABLE 119 SOUTH KOREA: AUTOMOTIVE TIRE MARKET, BY VEHICLE TYPE, 20172025 (USD MILLION)
TABLE 120 THAILAND: AUTOMOTIVE TIRE MARKET, BY VEHICLE TYPE, 20172025 (MILLION UNITS)
TABLE 121 THAILAND: AUTOMOTIVE TIRE MARKET, BY VEHICLE TYPE, 20172025 (USD MILLION)
TABLE 122 NORTH AMERICA PASSENGER CAR PRODUCTION, BY COUNTRY, 20172025 (UNITS)
TABLE 123 NORTH AMERICA LIGHT COMMERCIAL VEHICLE PRODUCTION, BY COUNTRY, 20172025 (UNITS)
TABLE 124 NORTH AMERICA TRUCK PRODUCTION, BY COUNTRY, 20172025 (UNITS)
TABLE 125 NORTH AMERICA BUS PRODUCTION, BY COUNTRY, 20172025 (UNITS)
TABLE 126 NORTH AMERICA: AUTOMOTIVE TIRE MARKET, BY COUNTRY, 20172025 (MILLION UNITS)
TABLE 127 NORTH AMERICA: AUTOMOTIVE TIRE MARKET, BY COUNTRY, 20172025 (USD MILLION)
TABLE 128 CANADA: AUTOMOTIVE TIRE MARKET, BY VEHICLE TYPE, 20172025 (MILLION UNITS)
TABLE 129 CANADA: AUTOMOTIVE TIRE MARKET, BY VEHICLE TYPE, 20172025 (USD MILLION)
TABLE 130 MEXICO: AUTOMOTIVE TIRE MARKET, BY VEHICLE TYPE, 20172025 (MILLION UNITS)
TABLE 131 MEXICO: AUTOMOTIVE TIRE MARKET, BY VEHICLE TYPE, 20172025 (USD MILLION)
TABLE 132 US: AUTOMOTIVE TIRE MARKET, BY VEHICLE TYPE, 20172025 (MILLION UNITS)
TABLE 133 US: AUTOMOTIVE TIRE MARKET, BY VEHICLE TYPE, 20172025 (USD MILLION)
TABLE 134 EUROPE PASSENGER CAR PRODUCTION, BY COUNTRY, 20172025 (UNITS)
TABLE 135 EUROPE LIGHT COMMERCIAL VEHICLE PRODUCTION, BY COUNTRY, 20172025 (UNITS)
TABLE 136 EUROPE TRUCK PRODUCTION, BY COUNTRY, 20172025 (UNITS)
TABLE 137 EUROPE BUS PRODUCTION, BY COUNTRY, 20172025 (UNITS)
TABLE 138 EUROPE: AUTOMOTIVE TIRE MARKET, BY COUNTRY, 20172025 (MILLION UNITS)
TABLE 139 EUROPE: AUTOMOTIVE TIRE MARKET, BY COUNTRY, 20172025 (USD MILLION)
TABLE 140 GERMANY: AUTOMOTIVE TIRE MARKET, BY VEHICLE TYPE, 20172025 (MILLION UNITS)
TABLE 141 GERMANY: AUTOMOTIVE TIRE MARKET, BY VEHICLE TYPE, 20172025 (USD MILLION)
TABLE 142 FRANCE: AUTOMOTIVE TIRE MARKET, BY VEHICLE TYPE, 20172025 (MILLION UNITS)
TABLE 143 FRANCE: AUTOMOTIVE TIRE MARKET, BY VEHICLE TYPE, 20172025 (USD MILLION)
TABLE 144 UK: AUTOMOTIVE TIRE MARKET, BY VEHICLE TYPE, 20172025 (MILLION UNITS)
TABLE 145 UK: AUTOMOTIVE TIRE MARKET, BY VEHICLE TYPE, 20172025 (USD MILLION)
TABLE 146 SPAIN: AUTOMOTIVE TIRE MARKET, BY VEHICLE TYPE, 20172025 (MILLION UNITS)
TABLE 147 SPAIN: AUTOMOTIVE TIRE MARKET, BY VEHICLE TYPE, 20172025 (USD MILLION)
TABLE 148 RUSSIA: AUTOMOTIVE TIRE MARKET, BY VEHICLE TYPE, 20172025 (MILLION UNITS)
TABLE 149 RUSSIA: AUTOMOTIVE TIRE MARKET, BY VEHICLE TYPE, 20172025 (USD MILLION)
TABLE 150 ITALY: AUTOMOTIVE TIRE MARKET, BY VEHICLE TYPE, 20172025 (MILLION UNITS)
TABLE 151 ITALY: AUTOMOTIVE TIRE MARKET, BY VEHICLE TYPE, 20172025 (USD MILLION)
TABLE 152 TURKEY: AUTOMOTIVE TIRE MARKET, BY VEHICLE TYPE, 20172025 (MILLION UNITS)
TABLE 153 TURKEY: AUTOMOTIVE TIRE MARKET, BY VEHICLE TYPE, 20172025 (USD MILLION)
TABLE 154 LATIN AMERICA PASSENGER CAR PRODUCTION, BY COUNTRY, 20172025 (UNITS)
TABLE 155 LATIN AMERICA LIGHT COMMERCIAL VEHICLE PRODUCTION, BY COUNTRY, 20172025 (UNITS)
TABLE 156 LATIN AMERICA TRUCK PRODUCTION, BY COUNTRY, 20172025 (UNITS)
TABLE 157 LATIN AMERICA BUS PRODUCTION, BY COUNTRY, 20172025 (UNITS)
TABLE 158 LATIN AMERICA: AUTOMOTIVE TIRE MARKET, BY COUNTRY, 20172025 (MILLION UNITS)
TABLE 159 LATIN AMERICA: AUTOMOTIVE TIRE MARKET, BY COUNTRY, 20172025 (USD MILLION)
TABLE 160 BRAZIL: AUTOMOTIVE TIRE MARKET, BY VEHICLE TYPE, 20172025 (MILLION UNITS)
TABLE 161 BRAZIL: AUTOMOTIVE TIRE MARKET, BY VEHICLE TYPE, 20172025 (USD MILLION)
TABLE 162 ARGENTINA: AUTOMOTIVE TIRE MARKET, BY VEHICLE TYPE, 20172025 (MILLION UNITS)
TABLE 163 ARGENTINA: AUTOMOTIVE TIRE MARKET, BY VEHICLE TYPE, 20172025 (USD MILLION)
TABLE 164 MIDDLE EAST AND AFRICA PASSENGER CAR PRODUCTION, BY COUNTRY, 20172025 (UNITS)
TABLE 165 MIDDLE EAST AND AFRICA LIGHT COMMERCIAL VEHICLE PRODUCTION, BY COUNTRY, 20172025 (UNITS)
TABLE 166 MIDDLE EAST AND AFRICA TRUCK PRODUCTION, BY COUNTRY, 20172025 (UNITS)
TABLE 167 MIDDLE EAST AND AFRICA BUS PRODUCTION, BY COUNTRY, 20172025 (UNITS)
TABLE 168 MIDDLE EAST AND AFRICA: AUTOMOTIVE TIRE MARKET, BY COUNTRY, 20172025 (MILLION UNITS)
TABLE 169 MIDDLE EAST AND AFRICA: AUTOMOTIVE TIRE MARKET, BY COUNTRY, 20172025 (USD MILLION)
TABLE 170 SOUTH AFRICA: AUTOMOTIVE TIRE MARKET, BY VEHICLE TYPE, 20172025 (MILLION UNITS)
TABLE 171 SOUTH AFRICA: AUTOMOTIVE TIRE MARKET, BY VEHICLE TYPE, 20172025 (USD MILLION)
TABLE 172 IRAN: AUTOMOTIVE TIRE MARKET, BY VEHICLE TYPE, 20172025 (MILLION UNITS)
TABLE 173 IRAN: AUTOMOTIVE TIRE MARKET, BY VEHICLE TYPE, 20172025 (USD MILLION)
TABLE 174 NEW PRODUCT DEVELOPMENTS/LAUNCHES, 20182019
TABLE 175 EXPANSION, 2018-2019
TABLE 176 ACQUISITION, JOINT VENTURE 2018
TABLE 177 PARTNERSHIPS/COLLBORATIONS, 2017-2018
LIST OF FIGURES (49 Figures)
FIGURE 1 AUTOMOTIVE TIRE MARKET SEGMENTATION
FIGURE 2 AUTOMOTIVE TIRE MARKET: RESEARCH DESIGN
FIGURE 3 RESEARCH DESIGN MODEL
FIGURE 4 BREAKDOWN OF PRIMARY INTERVIEWS
FIGURE 5 DATA TRIANGULATION
FIGURE 6 AUTOMOTIVE TIRE MARKET: MARKET OUTLOOK
FIGURE 7 AUTOMOTIVE TIRE OE MARKET, BY VEHICLE TYPE, 2019 VS. 2025 (USD MILLION)
FIGURE 8 AUTOMOTIVE TIRE AFTERMARKET, BY VEHICLE TYPE, 2019 VS. 2025 (USD MILLION)
FIGURE 9 INCREASE IN DEMAND FOR HIGH-PERFORMANCE TIRES IS EXPECTED TO OFFER ATTRACTIVE OPPORTUNITIES IN AUTOMOTIVE TIRE OE MARKET
FIGURE 10 ASIA PACIFIC IS EXPECTED TO DOMINATE THE AUTOMOTIVE TIRE OE MARKET
FIGURE 11 NORTH AMERICA IS EXPECTED TO DOMINATE THE AUTOMOTIVE TIRE AFTERMARKET
FIGURE 12 PASSENGER CAR SEGMENT IS PROJECTED TO DOMINATE THE MARKET
FIGURE 13 INCREASING TREND OF LUXURY SEGMENT VEHICLES IS DRIVING THE MARKET FOR TIRES WITH LARGE RIM DIAMETER
FIGURE 14 RADIAL TIRES HOLD A LIONS SHARE IN AUTOMOTIVE TIRE OE MARKET
FIGURE 15 TUBELESS TIRES ARE PROJECTED TO DOMINATE THE AUTOMOTIVE TIRE OE MARKET
FIGURE 16 THE MARKET OF WINTER TIRES IS PROJECTED TO GROW AT A FASTER RATE IN EUROPE AND NORTH AMERICA
FIGURE 17 NON-STUDDED TIRES ARE PROJECTED TO DOMINATE THE AUTOMOTIVE TIRE AFTERMARKET DURING THE FORECAST PERIOD
FIGURE 18 INCREASING TREND OF LARGE SIZE TIRES HAS FUELED THE DEMAND FOR TIRES WITH SECTION WIDTH >230MM
FIGURE 19 INCREASING DEMAND FOR LUXURY SEGMENT CARS IS DRIVING THE MARKET OF TIRES WITH ASPECT RATIO <60
FIGURE 20 RIM SIZE 19-21 SEGMENT IS GROWING AT A FASTER RATE OWING TO INCREASING DEMAND IN LIGHT COMMERCIAL VEHICLES
FIGURE 21 LIGHT COMMERCIAL VEHICLE SEGMENT IS PROJECTED TO GROW AT A FAST RATE
FIGURE 22 HEAVY COMMERCIAL VEHICLE SEGMENT IS PROJECTED TO DOMINATE THE TIRE RETREADING MARKET
FIGURE 23 AUTOMOTIVE TIRE AFTERMARKET, BY SECTION WIDTH, 2019 VS. 2025 (USD MILLION)
FIGURE 24 AUTOMOTIVE TIRE AFTERMARKET, BY ASPECT RATIO, 2019 VS. 2025 (USD MILLION)
FIGURE 25 AUTOMOTIVE TIRE AFTERMARKET, BY RIM SIZE, 2019 VS. 2025 (USD MILLION)
FIGURE 26 AUTOMOTIVE TIRE AFTERMARKET, BY SEASON, 2019 VS. 2025 (USD MILLION)
FIGURE 27 AUTOMOTIVE TIRE AFTERMARKET, BY VEHICLE TYPE, 2019 VS. 2025 (USD MILLION)
FIGURE 28 AUTOMOTIVE TIRE RETREADING MARKET, BY VEHICLE TYPE, 2019 VS. 2025 (USD MILLION)
FIGURE 29 AUTOMOTIVE TIRE OE MARKET, BY VEHICLE TYPE, 2019 VS. 2025 (USD MILLION)
FIGURE 30 AUTOMOTIVE TIRE OE MARKET, BY TYPE, 2019 VS. 2025 (USD MILLION)
FIGURE 31 AUTOMOTIVE TIRE MARKET: MIDDLE EAST AND AFRICA IS ESTIMATED TO GROW AT THE HIGHEST CAGR (20192025)
FIGURE 32 INDUSTRY INSIGHTS
FIGURE 33 ASIA PACIFIC: AUTOMOTIVE TIRE OE MARKET SNAPSHOT
FIGURE 34 NORTH AMERICA: AUTOMOTIVE TIRE OE MARKET SNAPSHOT
FIGURE 37 BUSINESS STRATEGY EXCELLENCE OF TOP PLAYERS IN TIRE MARKET FOR OE & REPLACEMENT
FIGURE 38 PRODUCT PORTFOLIO ANALYSIS OF TOP PLAYERS IN TIRE MARKET FOR OE & REPLACEMENT
FIGURE 40 BRIDGESTONE CORPORATION: COMPANY SNAPSHOT
FIGURE 41 CONTINENTAL AG: COMPANY SNAPSHOT
FIGURE 42 GOODYEAR TIRE & RUBBER COMPANY: COMPANY SNAPSHOT
FIGURE 43 MICHELIN: COMPANY SNAPSHOT
FIGURE 44 PIRELLI & C. S.P.A: COMPANY SNAPSHOT
FIGURE 45 SUMITOMO RUBBER INDUSTRIES LTD.: COMPANY SNAPSHOT
FIGURE 46 HANKOOK TIRE: COMPANY SNAPSHOT
FIGURE 47 YOKOHAMA RUBBER CO. LTD.: COMPANY SNAPSHOT
FIGURE 48 COOPER TIRE & RUBBER COMPANY: COMPANY SNAPSHOT
FIGURE 49 TOYO TIRE CORPORATION: COMPANY SNAPSHOT
The study involves four main activities to estimate the current size of the automotive tires market. Exhaustive secondary research was done to collect information such as Aftermarket (by Rim Size, Section Width, Aspect Ratio, and vehicle type), OE Market (Rim Size, by type, by Season and Vehicle type), and Retreading Market by Vehicle type. The next step was to validate these findings, assumptions, and market analysis with industry experts across value chains through primary research. The Bottum-up approach was employed to estimate the market size of different segments considered under this study.
Secondary Research
The secondary sources referred for this research study include associations such as the Tire Industry Association, Tire and Rim Association, Inc., Rubber Manufacturers Association, corporate filings (such as annual reports, investor presentations, and financial statements), and automotive associations. Secondary data has been collected and analyzed to arrive at the overall market size, which is further validated through primary research.
Primary Research
Extensive primary research has been conducted after acquiring an understanding of the automotive tires market through secondary research. Several primary interviews have been conducted with market experts from both, the demand- (Automotive OEMs, and Retreading Organizations) and supply-side (rubber suppliers, steel suppliers, oil companies and others) players across four major regionsnamely, North America, Europe, Asia-Pacific, and RoW (Latin America, the Middle East, and Africa). Approximately 20% and 80%, respectively of primary interviews have been conducted from both the demand and supply side. Primary data has been collected through questionnaires, e-mails, and telephonic interviews. In the canvassing of primaries, we have strived to cover various departments within organizations, including sales, operations, and administration, to provide a holistic viewpoint in our reports.
After interacting with industry participants, we have also conducted brief sessions with highly experienced independent consultants to reinforce the findings from our primaries. This, along with the in-house subject matter experts opinions, has led us to the findings as described in the remainder of this report.
Market Size Estimation
The bottom-up approach has been used to estimate and validate the market size of the automotive tires OE market as well as aftermarket. The market size of the automotive tire OE market by rim size and by country has been derived by multiplying the country level penetrations of different rim sizes calculated using model wise mapping with the country-wise production data of passenger cars, LCV, truck and bus. The market size, by value, has been derived by multiplying the rim size-wise OE pricing with the volume of the tire calculated in a million units. The total volume of each region is then summed up to estimate the total volume of the global automotive tires OE market for each vehicle type. The data has been validated through primary interviews with industry experts.
Tires aftermarket volume has been calculated using the vehicles on the road, average miles driven by each vehicle type in a year, replacement miles of tire for each vehicle type and the average number of tires getting replaced at a single service. The market value has been derived using the aftermarket prices found from various secondary and primary sources. The tires aftermarket is further segmented into section width, rim size, season and aspect ratio has been calculated using the bottom-up approach. The penetrations for section width, rim size, season, and aspect ratio have been derived from secondary sources and primary interviews and are applied on the tires aftermarket. Also, the retreading market is estimated using the retreading penetration by vehicle type in each region. The same is validated through primary respondents.
To know about the assumptions considered for the study, download the pdf brochure
Data Triangulation
All percentage shares, splits, and breakdowns have been determined using secondary sources and verified by primary sources. All parameters that are said to affect the markets covered in this research study have been accounted for, viewed in extensive detail, and analyzed to obtain the final quantitative and qualitative data. This data has been consolidated, enhanced with detailed inputs and analysis from MarketsandMarkets, and presented in the report. The data was triangulated by studying various factors and trends from both the demand and supply sides of the automotive tires market.
Report Objectives
- To analyze and forecast (20192025) the automotive tire market in terms of value (USD million) and volume (million units)
- To provide detailed information regarding the major factors influencing market growth
(drivers, restraints, opportunities, and challenges) - To segment and forecast the automotive tire aftermarket, in terms of value and volume, based on section width and vehicle type (<200MM, 200-230MM, and >230MM). This market is further segmented at a regional level
- To segment and forecast the automotive tire aftermarket, in terms of value and volume, based on aspect ratio and vehicle type (<60, 60-70, and >70). This market is further segmented at a regional level
- To segment and forecast the automotive tire aftermarket, in terms of value and volume, based on rim size and vehicle type (13"-15", 16"-18", 19"-21" and >21"). This market is further segmented at a regional level
- To segment and forecast the automotive tire aftermarket, in terms of value and volume, based on vehicle type (passenger car, light commercial vehicles, heavy commercial vehicle)
- To segment and forecast the automotive retreading market, in terms of value and volume, based on vehicle type (passenger car, light commercial vehicles, heavy commercial vehicle). This market is further segmented at a regional level
- To segment and forecast the automotive tire OE market, in terms of value and volume, based on vehicle type (passenger car, light commercial vehicles, buses, and trucks) and rim size (13"-15", 16"-18", 19"-21" and >21")
- To segment and forecast the automotive tire OE market, in terms of value and volume, based on type (Radial {tube and tubeless} and Bias)
- To segment and forecast the automotive tire OE market, in terms of value and volume, based on the season (Summer, Winter {studded and non-studded} and All seasons)
- To forecast the automotive tire market, in terms of value and volume, concerning key regions, namely, Asia Pacific, Europe, North America, Latin America and Africa and the Middle East
- To strategically analyze markets with respect to individual growth trends, prospects, and contribution to the total market
- To analyze markets and find the competitive landscape, market ranking, market overview, and industry overview of the automotive tire market
- To analyze the current joint ventures, mergers and acquisitions, and partnerships of various players engaged in the automotive tire market
Available Customizations
Automotive Tire Oe Market, By Season & Region
- Winter
- Summer
- All-Season
Automotive Tires OE, By Section Width & Region
- <200 mm
- 200-300 mm
- >300 mm
Automotive Tires Who Supplies Whom, By Region & OEM
- Europe
- Americas
- Asia


Growth opportunities and latent adjacency in Automotive Tires Market
I would need chapters 9,11 and 12 of the tires report. Would it further be possible to reduce the price by receiving chapter 12 only on the basis of a region instead of a country basis? It would be great to hear back from you today.
What is the tyre segment this report is concentrating on? Is it original equipment or replacement? Is it car CV 2wheeler OTR? What is the no. 666.66 Mn units?