
Biorational Pesticides Market by Source (Botanical, Microbial, Non-organic), Type (Insecticides, Fungicides, Nematicides), Mode of Application (Foliar Spray, Soil Treatment, Trunk Injection), Formulation, Crop Type, and Region - Global Forecast to 2022
Market Segmentation
| Report Metrics | Details |
|
Market size available for years |
2017 - 2022 |
|
CAGR % |
12.5 |
Top 10 companies in Biorational Pesticides Market


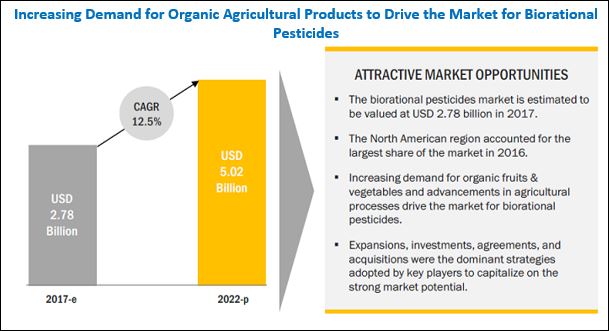
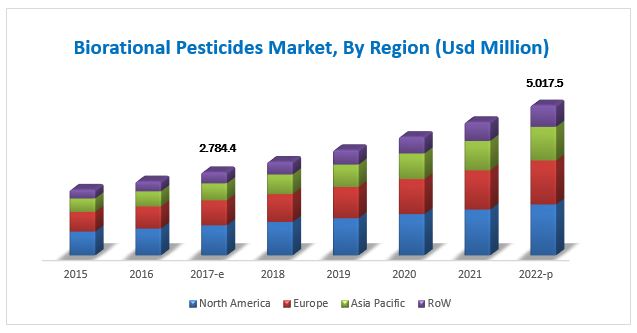
[162 Pages Report] The biorational pesticides market stood at USD 2.48 Billion in 2016; it is projected to grow at a CAGR of 12.5% from 2017, to reach USD 5.02 Billion by 2022. The base year considered for the study is 2016, and the forecast period is from 2017 to 2022. The basic objective of the report is to define, segment, and project the global market size for biorational pesticides on the basis of type, source, mode of application, crop type, formulation, and region. It also helps to understand the structure of this market by identifying its various segments. The other objectives include analyzing the opportunities in the market for stakeholders and providing a competitive landscape of market trends, analyzing the macro and micro indicators of this market and projecting the size of the biorational pesticides market and its submarkets, in terms of value as well as volume.
For More details on this research, Request Free Sample Report
This report includes estimations of the market size in terms of value (USD million). Both, the top-down and bottom-up approaches have been used to estimate and validate the size of the global biorational pesticides market and to estimate the size of various other dependent submarkets in the overall market. The key players in the market have been identified through secondary research; some of these sources are press releases, paid databases such as Factiva and Bloomberg, annual reports, and financial journals; their market share in respective regions has also been determined through primary and secondary research. All percentage shares, splits, and breakdowns have been determined using secondary sources and verified through primary sources. The figure below shows the breakdown of profiles of industry experts that participated in the primary discussions.
To know about the assumptions considered for the study, download the pdf brochure
Key participants in the supply chain of the biorational pesticides are the product manufacturers, end-use industries, and raw material suppliers. The key players that are profiled in the report include Valent Biosciences (US), Bayer (Germany), Monsanto BioAg (Germany), BASF (Germany), DowDuPont (US), and Syngenta (Switzerland).
This report is targeted at the existing stakeholders in the industry, which include the following:
- Regulatory and research organizations
- Raw material producers, suppliers, and distributors
- Biorational pesticide manufacturers, traders, distributors, and dealers
- Research and consulting firms
The study answers several questions for stakeholders, primarily which market segments to focus on in next two to five years for prioritizing efforts and investments.
Scope of the Biorational Pesticides Market Report:
On the basis of Type, the market has been segmented into:
- Insecticides
- Fungicides
- Nematicides
On the basis of Source, the market has been segmented into:
- Botanical
- Microbial
- Non-organic
On the basis of Mode of Application, the market has been segmented into:
- Foliar spray
- Soil treatment
- Trunk injection
On the basis of Crop Type, the market has been segmented into:
- Fruits & vegetables
- Cereals & grains
- Oilseeds & pulses
On the basis of Formulation, the market has been segmented into:
- Liquid
- Dry
On the basis of Region, the market has been segmented into:
- North America
- Europe
- Asia Pacific
- RoW (South America and the Middle East & Africa)
Available Customizations
With the given market data, MarketsandMarkets offers customizations according to the companys specific needs.
The following customization options are available for the report:
Segment Analysis
- Product matrix, which gives a detailed comparison of the product portfolio of each company
- Detailed analysis at volume level can also be provided
Regional Analysis
- Further breakdown of the Rest of Asia-Pacific biorational pesticides market, by country
- Further breakdown of the Rest of Europe biorational pesticides market, by country
- Further breakdown of South America, by country
- Further breakdown of the Middle East & Africa, by country
Company Information
- Detailed analysis and profiling of additional market players (up to five)
The term biorational is used to describe those pesticides that are efficacious against target pests but are less detrimental to natural enemies. The term is sometimes also used to describe only those products derived from natural sources such as plant extracts and insect pathogens. However, this report defines a biorational pesticide as any type of insecticide active against pest populations, but relatively innocuous to non-target organisms and therefore, non-disruptive to biological control.
The rise in concerns about food safety has led to farmers exploring new environment-friendly methods to replace or supplement the current chemical-based practices. The use of biorational pesticides has emerged as a promising alternative to chemical pesticides. Promotions by government organizations for the adoption of biorational pesticides and their low cost compared to that of chemical pesticides are some prominent factors that are expected to drive market growth through the next five years in most regions.
On the basis of type, the biorational pesticides market was led by biorational insecticides segment in 2016. It is one of the most largely commercially available types of biorational pesticides. North American countries are expected to become major markets owing to the high awareness among farmers and this contributes to the growth of the global market in the near future.
The botanical segment dominated the market in 2016. Botanical pesticides contain naturally occurring substances that control pests using a non-toxic mechanism. The substances that control diseases in this category include pyrethrin, azadirachtin, and plant extracts, while botanical oils such as neem oil, canola oil, and jojoba oil drive the growth of this segment.
The biorational pesticides market, on the basis of mode of application, is segmented into foliar spray, soil treatment, and trunk injection. The foliar spray segment covers the largest market share as direct application on leaves through foliar spray is the most effective way of supplying nutrients to plants, which results in enhanced productivity and greater yield; this also leads to rapid absorption and uniform supply of the nutrients to each part of the shoot and root.
North America accounted for the largest market share for biorational pesticides in 2016, owing to the increase in demand for biorational pesticides in countries such as the US and Canada. However, Asia Pacific is projected to be the fastest-growing market during the forecast period, due to increased awareness and increasing production of organic fruits & vegetables.
For more details on this research, Request Free Sample Report
In organic production systems, biorational pesticides represent the most significant crop protection tools that a grower has to produce a quality crop. While their use is not overly complicated, the application of some biorational pesticides may require a high level of understanding and knowledge of the diseases and pathogens that they are designed to control. As with any disease management program, proper timing and application are essential to ensure efficacy. Biorational pesticides may not perform as quickly as some synthetic chemical pesticides. However, biorational pesticides are generally less toxic to the user and are mild on non-target organisms, making them desirable and sustainable tools for disease management.
Companies such as Valent Biosciences (US), Bayer (Germany), Monsanto BioAg (Germany), BASF (Germany), DowDuPont (US), and Syngenta (Switzerland) have acquired leading market positions through the provision of a broad portfolio, catering to the varied requirements of the market, along with a focus on the diverse end-user segments. They are also focused on innovation and are geographically diversified.
To speak to our analyst for a discussion on the above findings, click Speak to Analyst
Table of Contents
1 Introduction (Page No. - 15)
1.1 Objectives of the Study
1.2 Market Definition
1.3 Market Scope
1.4 Periodization
1.5 Currency
1.6 Stakeholders
2 Research Methodology (Page No. - 19)
2.1 Research Data
2.1.1 Secondary Data
2.1.1.1 Key Data From Secondary Sources
2.1.2 Primary Data
2.1.2.1 Breakdown of Primaries, By Company Type, Designation, and Region
2.1.2.2 Key Industry Insights
2.2 Market Size Estimation
2.2.1 Bottom-Up Approach
2.2.2 Top-Down Approach
2.3 Market Breakdown & Data Triangulation
2.4 Research Assumptions & Limitations
2.4.1 Assumptions
2.4.2 Limitations
3 Executive Summary (Page No. - 28)
4 Premium Insights (Page No. - 34)
4.1 Attractive Opportunities in the Biorational Pesticides Market
4.2 Biorational Pesticides Market, By Type
4.3 Market, By Mode of Application
4.4 Global Market, By Crop Type
4.5 North American Biorational Pesticides Market Share, By Source & Country, 2016
4.6 Market, By Country
5 Market Overview (Page No. - 40)
5.1 Introduction
5.2 Market Dynamics
5.2.1 Drivers
5.2.1.1 Consumer Shift Toward Organic Foods
5.2.1.2 Heavy Crop Loss Due to Pest Attacks
5.2.1.3 Promotion By Government Organizations
5.2.1.4 Evolving Farming Practices & Technology
5.2.2 Restraints
5.2.2.1 Limited Product Availability and Low Shelf Life of Biorational Pesticides
5.2.3 Opportunities
5.2.3.1 Increasing Investment in Agricultural Activities
5.2.3.2 Strong Market Potential in Developing Countries
5.2.4 Challenges
5.2.4.1 Lack of Basic Infrastructure
5.3 Supply Chain Analysis
6 Biorational Pesticides Market, By Source (Page No. - 49)
6.1 Introduction
6.2 Botanical
6.2.1 Pyrethrin
6.2.2 Azadirachtin & Neem Oil
6.2.3 Rotenone
6.2.4 Others
6.3 Microbial
6.3.1 Bacillus Thuringiensis
6.3.2 Beauveria Bassiana
6.3.3 Others
6.4 Non-Organic
6.5 Others
7 Biorational Pesticides Market, By Mode of Application (Page No. - 56)
7.1 Introduction
7.2 Foliar Spray
7.3 Soil Treatment
7.4 Trunk Injection
7.5 Other Modes of Application
8 Biorational Pesticide Market, By Crop Type (Page No. - 63)
8.1 Introduction
8.2 Fruits & Vegetables
8.2.1 Citrus Fruits
8.2.2 Berries
8.2.3 Tomatoes
8.2.4 Potatoes
8.2.5 Others
8.3 Cereals & Grains
8.3.1 Wheat
8.3.2 Rice
8.3.3 Corn
8.3.4 Others
8.4 Oilseeds & Pulses
8.4.1 Soybean
8.4.2 Sunflower
8.4.3 Cotton Seed
8.4.4 Others
8.5 Other Crop Types
9 Market, By Formulation (Page No. - 71)
9.1 Introduction
9.2 Liquid
9.3 Dry
10 Market, By Type (Page No. - 76)
10.1 Introduction
10.2 Biorational Insecticides
10.3 Biorational Fungicides
10.4 Biorational Nematicides
10.5 Others
11 Market, By Region (Page No. - 82)
11.1 Introduction
11.2 North America
11.2.1 US
11.2.2 Canada
11.2.3 Mexico
11.3 Europe
11.3.1 France
11.3.2 Italy
11.3.3 Germany
11.3.4 Spain
11.3.5 UK
11.3.6 Rest of Europe
11.4 Asia Pacific
11.4.1 China
11.4.2 India
11.4.3 Japan
11.4.4 Australia
11.4.5 Rest of Asia Pacific
11.5 Rest of the World (RoW)
11.5.1 South America
11.5.2 Middle East & Africa
12 Biorational Pesticides Market: Regulatory Framework (Page No. - 113)
12.1 Introduction
12.2 North America
12.2.1 US
12.2.2 Canada
12.2.2.1 Regulatory Authority for Biopesticides Registration
12.2.2.2 Regulatory Authority for Biorational Registration
12.3 Europe
12.3.1 European Union
12.3.2 Germany
12.3.3 UK
12.3.4 France
12.3.5 Spain
12.3.6 Russia
12.4 Asia Pacific
12.4.1 China
12.4.2 Australia
12.4.2.1 Product Data Requirements
13 Competitive Landscape (Page No. - 119)
13.1 Overview
13.1.1 Key Market Strategies
13.2 Competitive Scenario
13.2.1 New Product Launch, 20122017
13.2.2 Expansions & Investments
13.2.3 Mergers & Acquisitions
13.2.4 Agreements, Partnerships, Collaborations, and Joint Ventures
14 Company Profiles (Page No. - 125)
(Business Overview, Products Offered, Recent Developments, SWOT Analysis, MnM View)*
14.1 Bayer
14.2 Syngenta
14.3 Monsanto Bioag
14.4 BASF SE
14.5 Dowdupont
14.6 Valent Biosciences
14.7 Isagro SAP
14.8 Koppert
14.9 Marrone Bio Innovations
14.10 Russell IPM
14.11 Gowan Company, LLC
*Details on Business Overview, Products Offered, Recent Developments, SWOT Analysis, MnM View Might Not Be Captured in Case of Unlisted Companies.
15 Appendix (Page No. - 154)
15.1 Discussion Guide
15.2 Knowledge Store: Marketsandmarkets Subscription Portal
15.3 Introducing RT: Real-Time Market Intelligence
15.4 Available Customizations
15.5 Related Reports
15.6 Author Details
List of Tables (71 Tables)
Table 1 US Dollar Exchange Rate Considered for Study, 20142016
Table 2 Market Size for Biorational Pesticides, By Source, 2015-2022 (USD Million)
Table 3 Botanical Biorational Pesticides Market Size, By Region, 2015-2022 (USD Million)
Table 4 Microbial Biorational Pesticides Market Size, By Region, 2015-2022 (USD Million)
Table 5 Non-Organic Biorational Pesticides Market Size, By Region, 2015-2022 (USD Million)
Table 6 Other Biorational Pesticides Market Size, By Region, 2015-2022 (USD Million)
Table 7 Market Size for Biorational Pesticides, By Mode of Application, 20152022 (USD Million)
Table 8 Foliar Spray Market Size, By Region, 20152022 (USD Million)
Table 9 Soil Treatment Market Size, By Region, 20152022 (USD Million)
Table 10 Trunk Injection Market Size, By Region, 20152022 (USD Million)
Table 11 Other Modes of Application Market Size, By Region, 20152022 (USD Million)
Table 12 Market Size, By Crop Type, 20152022 (USD Million)
Table 13 Fruits & Vegetables: Market Size, By Region, 20152022 (USD Million)
Table 14 Cereals & Grains: Market Size, By Region, 20152022 (USD Million)
Table 15 Oilseeds & Pulses Market Size, By Region, 20152022 (USD Million)
Table 16 Other Crop Types: Market Size, By Region, 20152022 (USD Million)
Table 17 Market Size, By Formulation, 20152022 ( USD Million)
Table 18 Liquid: Market Size, By Region, 20152022 (USD Million)
Table 19 Dry: Market Size, By Region, 20152022 (USD Million)
Table 20 Market Size for Biorational Pesticides, By Type, 20152022 (USD Million)
Table 21 Biorational Insecticides Market Size, By Region, 20152022 (USD Million)
Table 22 Biorational Fungicides Market Size, By Region, 20152022 (USD Million)
Table 23 Biorational Nematicides Market Size, By Region, 20152022 (USD Million)
Table 24 Other Biorational Pesticides Market Size, By Region, 20152022 (USD Million)
Table 25 Market Size for Biorational Pesticides, By Region, 20152022 (USD Million)
Table 26 North America: Biorational Pesticides Market Size, By Source, 20152022 (USD Million)
Table 27 North America: Market Size, By Crop Type, 20152022 (USD Million)
Table 28 North America: Market Size, By Mode of Application, 20152022 (USD Million)
Table 29 North America: Market Size, By Type, 20152022 (USD Million)
Table 30 North America: Market Size, By Formulation, 20152022 (USD Million)
Table 31 North America: Market Size, By Country, 20152022 (USD Million)
Table 32 US: Market Size, By Source, 20152022 (USD Million)
Table 33 Canada: Market Size for Biorational Pesticides, By Source, 20152022 (USD Million)
Table 34 Mexico: Market Size for Biorational Pesticides, By Source, 20152022 (USD Million)
Table 35 Europe: Market Size for Biorational Pesticides, By Source, 20152022 (USD Million)
Table 36 Europe: Market Size, By Crop Type, 20152022 (USD Million)
Table 37 Europe: Market Size, By Mode of Application, 20152022 (USD Million)
Table 38 Europe: Market Size, By Type, 20152022 (USD Million)
Table 39 Europe: Market Size, By Formulation, 20152022 (USD Million)
Table 40 Europe: Market Size, By Country, 20152022 (USD Million)
Table 41 France: Market Size for Biorational Pesticides, By Source, 20152022 (USD Million)
Table 42 Italy: Market Size for Biorational Pesticides, By Source, 20152022 (USD Million)
Table 43 Germany: Market Size for Biorational Pesticides, By Source, 20152022 (USD Million)
Table 44 Spain: Market Size for Biorational Pesticides, By Source, 20152022 (USD Million)
Table 45 UK: Market Size for Biorational Pesticides, By Source, 20152022 (USD Million)
Table 46 Rest of Europe: Market Size for Biorational Pesticides, By Source, 20152022 (USD Million)
Table 47 Asia Pacific: Biorational Pesticides Market Size, By Source, 20152022 (USD Million)
Table 48 Asia Pacific: Market Size, By Crop Type, 20152022 (USD Million)
Table 49 Asia Pacific: Market Size, By Mode of Application, 20152022 (USD Million)
Table 50 Asia Pacific: Market Size, By Type, 20152022 (USD Million)
Table 51 Asia Pacific: Market Size, By Formulation, 20152022 (USD Million)
Table 52 Asia Pacific: Market Size, By Country, 20152022 (USD Million)
Table 53 China: Market Size, By Source, 20152022 (USD Million)
Table 54 India: Market Size, By Source, 20152022 (USD Million)
Table 55 Japan: Market Size, By Source, 20152022 (USD Million)
Table 56 Australia: Market Size, By Source, 20152022 (USD Million)
Table 57 Rest of Asia Pacific: Market Size, By Source, 20152022 (USD Million)
Table 58 RoW: Market Size, By Type, 20152022 (USD Million)
Table 59 RoW: Market Size, By Crop Type, 20152022 (USD Million)
Table 60 RoW: Market Size, By Mode of Application, 20152022 (USD Million)
Table 61 RoW: Market Size, By Source, 20152022 (USD Million)
Table 62 RoW: Market Size, By Formulation, 20152022 (USD Million)
Table 63 RoW: Market Size, By Region, 20152022 (USD Million)
Table 64 South America: Biorational Pesticides Market Size, By Source, 20152022 (USD Million)
Table 65 Middle East & Africa: Biorational Pesticides Market Size, By Type, 20152022 (USD Million)
Table 66 Regulatory Authorities for Agricultural Biologicals in Each Country
Table 67 Biopesticides Registered in China, 2016
Table 68 New Product Launch, 20122017
Table 69 Investments & Expansions, 20132017
Table 70 Mergers & Acquisitions 20132017
Table 71 Agreements, Partnerships, Collaborations, and Joint Ventures, 20132016
List of Figures (53 Figures)
Figure 1 Market Segmentation
Figure 2 Biorational Pesticides Market: Research Design
Figure 3 Market Size Estimation Methodology: Bottom-Up Approach
Figure 4 Market Size Estimation Methodology: Top-Down Approach
Figure 5 Data Triangulation
Figure 6 Assumptions of the Research Study
Figure 7 Limitations of the Research Study
Figure 8 Biorational Pesticides Market Size, By Type, 20152022 (USD Million)
Figure 9 Market Size, By Mode of Application, 2017 vs 2022 (USD Million)
Figure 10 Market Size, By Crop Type, 2017 vs 2022 (USD Million)
Figure 11 Market Share (Value), By Source, 2016
Figure 12 Market Share, By Region, 2016
Figure 13 Increasing Demand for Organic Agricultural Products to Drive the Market for Biorational Pesticides
Figure 14 Insecticides Segment to Dominate the Market Between Through 2022
Figure 15 Foliar Spray Segment to Dominate the Market Through 2022
Figure 16 Fruits & Vegetables Segment to Dominate the Market Through 2022
Figure 17 Botanical Segment Dominated the North American Biorational Pesticides Market in 2016
Figure 18 India to Grow at the Highest CAGR From 2017 to 2022
Figure 19 Biorational Pesticides Market: Drivers, Restraints, Opportunities, and Challenges
Figure 20 Organic Food Sales in the Us, 20032015
Figure 21 Rising Trend of Setting Up Agricultural Investment Fund
Figure 22 Crop Harvested Area in Asia, 2011-2015 (000 Ha)
Figure 23 Crop Harvested Area in South America, 2011-2015 (000 Ha)
Figure 24 Regulatory Approvals Form A Vital Component of the Supply Chain
Figure 25 Botanical Segment Projected to Dominate the Market During the Forecast Period
Figure 26 Botanical Biorational Pesticides Market Size, By Region, 2017 vs 2022 (USD Million)
Figure 27 Foliar Spray is Projected to Dominate the Market From 2017 to 2022
Figure 28 North America to Account for the Largest Market Share for Foliar Spray From 2017 to 2022 (USD Million)
Figure 29 Fruits & Vegetable Segment to Dominate the Market From 2017 to 2022
Figure 30 North America to Hold the Largest Market Share for the Fruits & Vegetables Segment By 2022
Figure 31 Liquid Formulations to Dominate the Market From 2017 to 2022
Figure 32 North America to Account for the Largest Market Share for Liquid Biorational Pesticides From 2017 to 2022
Figure 33 Biorational Insecticides to Be the Largest Segment Through 2022
Figure 34 Biorational Insecticides Market Size, By Region, 2017 vs 2022 (USD Million)
Figure 35 North America to Dominate the global Market, 2017 vs 2022
Figure 36 India and China to Be the Most Attractive Markets for Biorational Pesticides Manufacturers (20172022)
Figure 37 North America: Biorational Pesticides Market Snapshot
Figure 38 Europe: Biorational Pesticides Market Snapshot
Figure 39 Asia Pacific Snapshot: Biorational Pesticides Market
Figure 40 Key Developments By Leading Players in this Market From 2015 to 2017
Figure 41 Biorational Pesticides Market Developments, By Growth Strategy, 20122017
Figure 42 Bayer: Company Snapshot
Figure 43 Bayer: SWOT Analysis
Figure 44 Syngenta: Company Snapshot
Figure 45 Syngenta: SWOT Analysis
Figure 46 Monsanto Bioag Alliance: Company Snapshot
Figure 47 Monsanto Bioag: SWOT Analysis
Figure 48 BASF SE: Company Snapshot
Figure 49 BASF: SWOT Analysis
Figure 50 Dowdupont: Company Snapshot
Figure 51 Dowdupont: SWOT Analysis
Figure 52 Isagro SAP : Company Snapshot
Figure 53 Marrone Bio Innovations: Company Snapshot


Growth opportunities and latent adjacency in Biorational Pesticides Market
Very informative market report.