TABLE OF CONTENTS
1 INTRODUCTION (Page No. - 36)
1.1 STUDY OBJECTIVES
1.2 MARKET DEFINITION
1.2.1 INCLUSIONS AND EXCLUSIONS
1.3 MARKET SCOPE
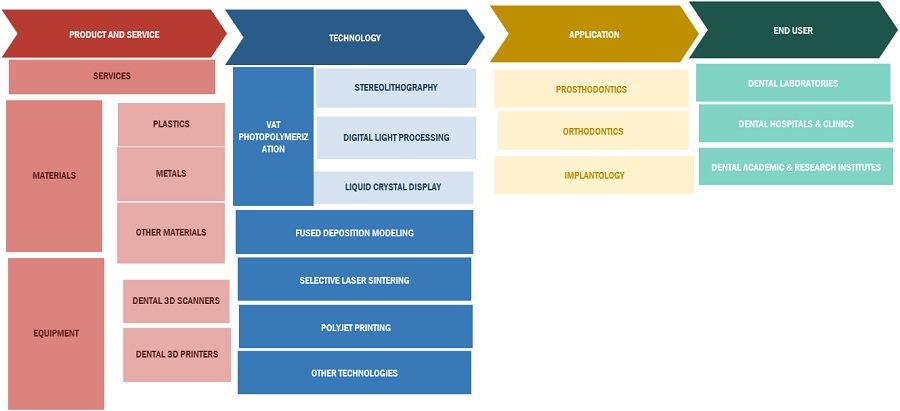
1.3.1 MARKETS COVERED
1.4 YEARS CONSIDERED
1.5 CURRENCY CONSIDERED
TABLE 1 STANDARD CURRENCY CONVERSION RATES
1.6 SCOPE-RELATED LIMITATIONS
1.7 STAKEHOLDERS
1.8 SUMMARY OF CHANGES
1.9 RECESSION IMPACT
2 RESEARCH METHODOLOGY (Page No. - 40)
2.1 RESEARCH DATA
FIGURE 1 RESEARCH DESIGN
2.1.1 SECONDARY DATA
2.1.1.1 Key data from secondary sources
2.1.2 PRIMARY DATA
FIGURE 2 PRIMARY SOURCES
2.1.2.1 Key data from primary sources
2.1.2.2 Key industry insights
FIGURE 3 BREAKDOWN OF PRIMARY INTERVIEWS: SUPPLY-SIDE AND DEMAND-SIDE PARTICIPANTS
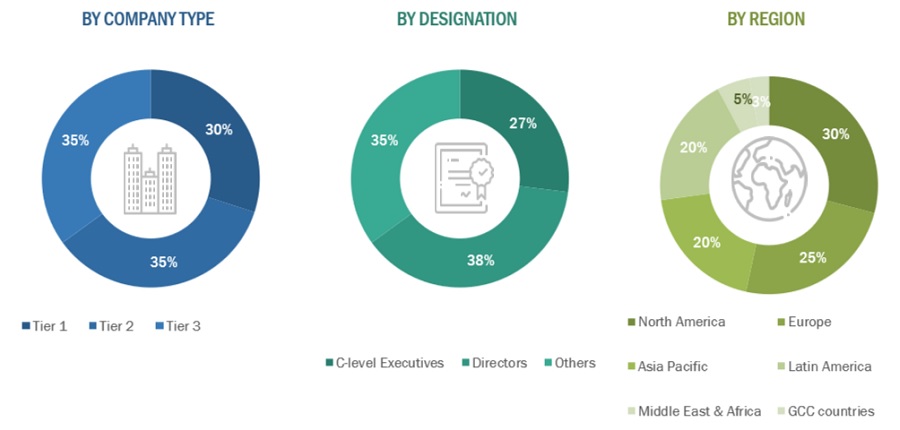
FIGURE 4 BREAKDOWN OF PRIMARY INTERVIEWS: BY END USER, DESIGNATION, AND REGION
2.2 MARKET SIZE ESTIMATION
FIGURE 5 MARKET SIZE ESTIMATION: REVENUE SHARE ANALYSIS (2022)
FIGURE 6 REVENUE SHARE ANALYSIS FOR 3D SYSTEMS CORPORATION (US) (2022)
FIGURE 7 DENTAL 3D PRINTING MARKET: SUPPLY SIDE ANALYSIS (2022)
FIGURE 8 DRIVERS, OPPORTUNITIES, AND CHALLENGES IN DENTAL 3D PRINTING MARKET
FIGURE 9 CAGR PROJECTIONS: SUPPLY SIDE ANALYSIS OF DENTAL 3D PRINTING MARKET (2022)
FIGURE 10 TOP-DOWN APPROACH
2.3 MARKET BREAKDOWN AND DATA TRIANGULATION
FIGURE 11 DATA TRIANGULATION METHODOLOGY
2.4 RESEARCH ASSUMPTIONS
TABLE 2 RESEARCH ASSUMPTIONS
2.5 RISK ASSESSMENT
TABLE 3 RISK ASSESSMENT
2.6 METHODOLOGY-RELATED LIMITATIONS
3 EXECUTIVE SUMMARY (Page No. - 54)
FIGURE 12 DENTAL 3D PRINTING MARKET, BY PRODUCT & SERVICE, 2023 VS. 2028 (USD MILLION)
FIGURE 13 DENTAL 3D PRINTING MARKET, BY TECHNOLOGY, 2023 VS. 2028 (USD MILLION)
FIGURE 14 DENTAL 3D PRINTING MARKET, BY APPLICATION, 2023 VS. 2028 (USD MILLION)
FIGURE 15 DENTAL 3D PRINTING MARKET, BY END USER, 2023 VS. 2028 (USD MILLION)
FIGURE 16 DENTAL 3D PRINTING MARKET: GEOGRAPHIC SNAPSHOT
4 PREMIUM INSIGHTS (Page No. - 58)
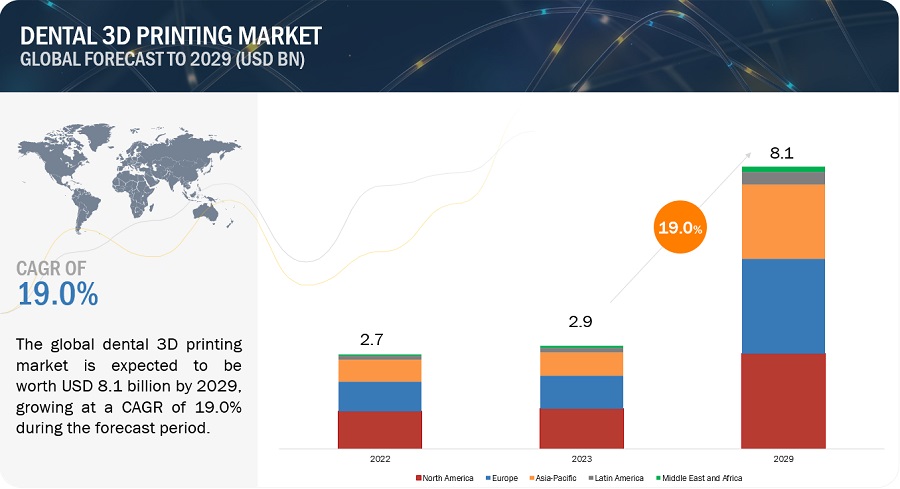
4.1 DENTAL 3D PRINTING MARKET OVERVIEW
FIGURE 17 HIGH INCIDENCE OF DENTAL CARIES TO DRIVE GLOBAL DENTAL 3D PRINTING MARKET GROWTH
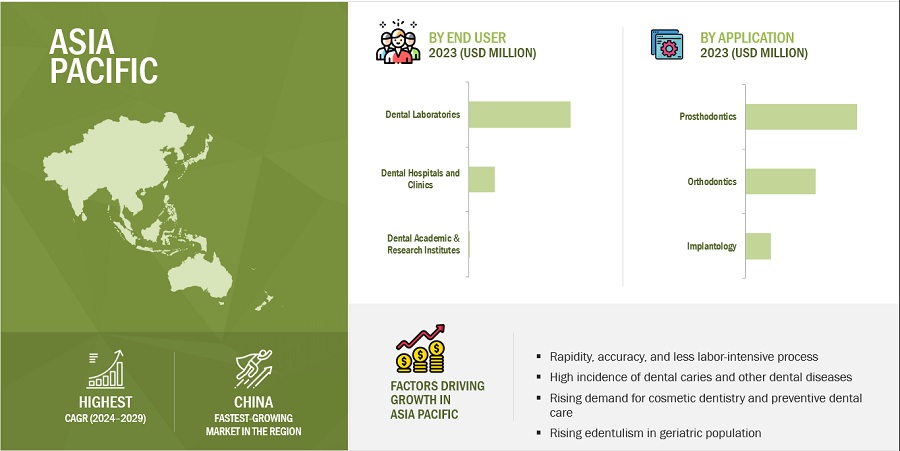
4.2 ASIA PACIFIC DENTAL 3D PRINTING MARKET, BY APPLICATION AND COUNTRY
FIGURE 18 PROSTHODONTICS TO ACCOUNT FOR LARGEST SHARE IN ASIA PACIFIC
4.3 DENTAL 3D PRINTING MARKET: GEOGRAPHIC GROWTH OPPORTUNITIES
FIGURE 19 CHINA TO GROW AT HIGHEST CAGR OVER FORECAST PERIOD
4.4 REGIONAL MIX: DENTAL 3D PRINTING MARKET (2023–2028)
FIGURE 20 NORTH AMERICA TO DOMINATE DENTAL 3D PRINTING MARKET
4.5 DENTAL 3D PRINTING MARKET: DEVELOPED VS. DEVELOPING MARKETS, 2023 VS. 2028 (USD MILLION)
FIGURE 21 DEVELOPING MARKETS TO REGISTER HIGH GROWTH DURING FORECAST PERIOD
5 MARKET OVERVIEW (Page No. - 62)
5.1 INTRODUCTION
5.2 MARKET DYNAMICS
FIGURE 22 DENTAL 3D PRINTING MARKET: DRIVERS, OPPORTUNITIES, AND CHALLENGES
5.2.1 DRIVERS
5.2.1.1 Rapidity, accuracy, and less labor-intensive process
5.2.1.2 High incidence of dental caries and other dental diseases
5.2.1.3 Rising demand for cosmetic dentistry and preventive dental care
5.2.1.4 Rising edentulism in geriatric population
TABLE 4 RISE IN GERIATRIC POPULATION, BY COUNTRY
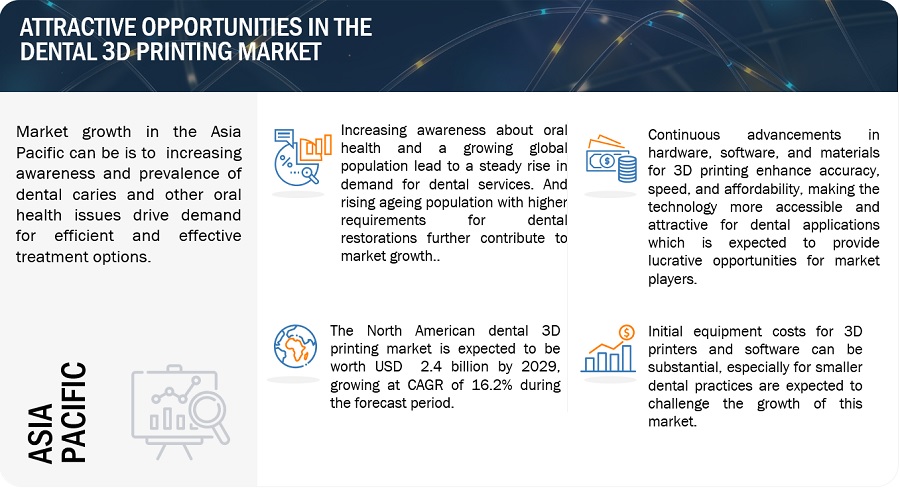
5.2.2 OPPORTUNITIES
5.2.2.1 Increasing popularity of CAD/CAM technology
5.2.2.2 Advancements in resins used for dental 3D printing
5.2.3 CHALLENGES
5.2.3.1 High capital investment and operating costs
5.2.3.2 Lack of skilled workforce due to limited specialized training in additive manufacturing
5.2.3.3 Rising number of large dental practices
5.3 PORTER’S FIVE FORCES ANALYSIS
FIGURE 23 PORTER’S FIVE FORCES ANALYSIS
5.3.1 THREAT FROM NEW ENTRANTS
5.3.2 THREAT FROM SUBSTITUTES
5.3.3 BARGAINING POWER OF SUPPLIERS
5.3.4 BARGAINING POWER OF BUYERS
5.3.5 INTENSITY OF COMPETITIVE RIVALRY
5.4 PATENT ANALYSIS
5.4.1 PATENT PUBLICATION TRENDS FOR DENTAL 3D PRINTING
FIGURE 24 PATENT PUBLICATION TRENDS (2013–2023)
5.4.2 INSIGHTS ON JURISDICTION AND TOP APPLICANT ANALYSIS
FIGURE 25 TOP APPLICANTS AND OWNERS (COMPANIES/INSTITUTES) FOR DENTAL 3D PRINTING PATENTS, 2013–2023
FIGURE 26 TOP 10 APPLICANT COUNTRIES/REGIONS FOR DENTAL 3D PRINTING PATENTS, 2013–2023
TABLE 5 DENTAL 3D PRINTING MARKET: LIST OF MAJOR PATENTS
5.5 PRICING ANALYSIS
TABLE 6 DENTAL 3D PRINTERS: MAJOR BRANDS WITH APPROXIMATE PRICING (USD) IN US
5.5.1 AVERAGE SELLING PRICE OF DENTAL 3D PRINTERS
FIGURE 27 AVERAGE SELLING PRICE OF DENTAL 3D PRINTERS (TOP PLAYERS)
5.5.2 AVERAGE SELLING PRICE TRENDS
5.6 KEY STAKEHOLDERS AND BUYING CRITERIA
5.6.1 KEY STAKEHOLDERS IN BUYING PROCESS
FIGURE 28 INFLUENCE OF STAKEHOLDERS ON BUYING PROCESS FOR DENTAL 3D PRINTING PRODUCTS AND SERVICES
TABLE 7 INFLUENCE OF STAKEHOLDERS ON BUYING PROCESS FOR DENTAL 3D PRINTING PRODUCTS AND SERVICES
5.6.2 BUYING CRITERIA
FIGURE 29 KEY BUYING CRITERIA FOR DENTAL 3D PRINTING PRODUCTS AND SERVICES
TABLE 8 KEY BUYING CRITERIA FOR DENTAL 3D PRINTING
5.7 VALUE CHAIN ANALYSIS
FIGURE 30 DENTAL 3D PRINTING MARKET: VALUE CHAIN ANALYSIS (2022)
5.8 ECOSYSTEM MAP
FIGURE 31 DENTAL 3D PRINTING MARKET: ECOSYSTEM MAP (2022)
5.9 TECHNOLOGY ANALYSIS
5.9.1 EVOLUTION OF DENTAL 3D PRINTING TECHNOLOGY
FIGURE 32 DENTAL 3D PRINTING: EVOLUTION
5.10 INDUSTRY TRENDS
5.10.1 ADVANCED 3D PRINTING MATERIALS FOR DENTAL APPLICATIONS
5.10.2 RISING ADOPTION OF DIGITAL DENTISTRY
FIGURE 33 WORKFLOW COMPARISON: TRADITIONAL VS. DIGITAL DENTISTRY
5.10.3 CONSOLIDATION OF DENTAL LABORATORIES
5.11 REGULATORY LANDSCAPE
5.11.1 US
5.11.2 EU
5.11.3 CHINA
5.11.4 REGULATORY BODIES, GOVERNMENT AGENCIES, AND OTHER ORGANIZATIONS
TABLE 9 NORTH AMERICA: REGULATORY BODIES, GOVERNMENT AGENCIES, AND OTHER ORGANIZATIONS
TABLE 10 EUROPE: REGULATORY BODIES, GOVERNMENT AGENCIES, AND OTHER ORGANIZATIONS
TABLE 11 ASIA PACIFIC: REGULATORY BODIES, GOVERNMENT AGENCIES, AND OTHER ORGANIZATIONS
TABLE 12 LATIN AMERICA: REGULATORY BODIES, GOVERNMENT AGENCIES, AND OTHER ORGANIZATIONS
TABLE 13 MIDDLE EAST AND AFRICA: REGULATORY BODIES, GOVERNMENT AGENCIES, AND OTHER ORGANIZATIONS
5.12 DENTAL 3D PRINTING MARKET: ADJACENT MARKETS
FIGURE 34 DENTAL 3D PRINTING MARKET: ADJACENT MARKETS
5.13 KEY CONFERENCES & EVENTS, 2023–2024
TABLE 14 KEY CONFERENCES & EVENTS, 2023–2024
6 DENTAL 3D PRINTING MARKET, BY PRODUCT & SERVICE (Page No. - 89)
6.1 INTRODUCTION
TABLE 15 DENTAL 3D PRINTING MARKET, BY PRODUCT & SERVICE, 2021–2028 (USD MILLION)
6.2 SERVICES
6.2.1 COST-EFFECTIVENESS TO BOOST SERVICE SECTOR GROWTH
TABLE 16 DENTAL 3D PRINTING SERVICES MARKET, BY COUNTRY, 2021–2028 (USD MILLION)
6.3 MATERIALS
TABLE 17 DENTAL 3D PRINTING MATERIALS MARKET, BY TYPE, 2021–2028 (USD MILLION)
TABLE 18 DENTAL 3D PRINTING MATERIALS MARKET, BY COUNTRY, 2021–2028 (USD MILLION)
6.3.1 PLASTICS
6.3.1.1 Advancements in material quality and increasing versatility to promote growth
TABLE 19 DENTAL 3D PRINTING MARKET FOR PLASTICS, BY COUNTRY, 2021–2028 (USD MILLION)
6.3.2 METALS
6.3.2.1 Superior mechanical strength and surface finish to drive market
TABLE 20 DENTAL 3D PRINTING MARKET FOR METALS, BY COUNTRY, 2021–2028 (USD MILLION)
6.3.3 OTHER MATERIALS
TABLE 21 LIQUID RESINS AVAILABLE IN DENTAL 3D PRINTING MARKET
TABLE 22 DENTAL 3D PRINTING MARKET FOR OTHER MATERIALS, BY COUNTRY, 2021–2028 (USD MILLION)
6.4 EQUIPMENT
TABLE 23 DENTAL 3D PRINTING EQUIPMENT MARKET, BY TYPE, 2021–2028 (USD MILLION)
TABLE 24 DENTAL 3D PRINTING EQUIPMENT MARKET, BY COUNTRY, 2021–2028 (USD MILLION)
6.4.1 DENTAL 3D SCANNERS
6.4.1.1 Increasing affordability and utility of dental 3D scanners to support segment growth
TABLE 25 DENTAL 3D SCANNERS MARKET, BY COUNTRY, 2021–2028 (USD MILLION)
6.4.2 DENTAL 3D PRINTERS
6.4.2.1 Workflow enhancements and benefits of digitization to support adoption
TABLE 26 DENTAL 3D PRINTERS MARKET, BY COUNTRY, 2021–2028 (USD MILLION)
7 DENTAL 3D PRINTING MARKET, BY TECHNOLOGY (Page No. - 102)
7.1 INTRODUCTION
TABLE 27 DENTAL 3D PRINTING MARKET, BY TECHNOLOGY, 2021–2028 (USD MILLION)
7.2 VAT PHOTOPOLYMERIZATION
TABLE 28 VAT PHOTOPOLYMERIZATION MARKET, BY TYPE, 2021–2028 (USD MILLION)
TABLE 29 VAT PHOTOPOLYMERIZATION MARKET, BY COUNTRY, 2021–2028 (USD MILLION)
7.2.1 STEREOLITHOGRAPHY
7.2.1.1 Rapidity, ease of use, and accuracy to drive adoption
TABLE 30 STEREOLITHOGRAPHY MARKET, BY COUNTRY, 2021–2028 (USD MILLION)
7.2.2 DIGITAL LIGHT PROCESSING
7.2.2.1 Low output quality of DLP printing to hamper market growth
TABLE 31 DIGITAL LIGHT PROCESSING MARKET, BY COUNTRY, 2021–2028 (USD MILLION)
7.2.3 LIQUID CRYSTAL DISPLAY
7.2.3.1 Smooth surface finish with fast and accurate printing to boost growth
TABLE 32 MAJOR COMPANIES OFFERING DENTAL LCD 3D PRINTERS
TABLE 33 LIQUID CRYSTAL DISPLAY MARKET, BY COUNTRY, 2021–2028 (USD MILLION)
7.3 SELECTIVE LASER SINTERING
7.3.1 HIGH PRODUCTIVITY OF SLS TO ENCOURAGE SEGMENT GROWTH
TABLE 34 SELECTIVE LASER SINTERING MARKET, BY COUNTRY, 2021–2028 (USD MILLION)
7.4 POLYJET PRINTING
7.4.1 HIGH PRECISION AND WIDE APPLICATIONS OF POLYJET TECHNOLOGY TO BOOST MARKET GROWTH
TABLE 35 POLYJET PRINTING MARKET, BY COUNTRY, 2021–2028 (USD MILLION)
7.5 FUSED DEPOSITION MODELING
7.5.1 LOW COST OF FDM PRINTERS TO DRIVE MARKET GROWTH
TABLE 36 FUSED DEPOSITION MODELING MARKET, BY COUNTRY, 2021–2028 (USD MILLION)
7.6 OTHER TECHNOLOGIES
TABLE 37 OTHER DENTAL 3D PRINTING TECHNOLOGIES MARKET, BY COUNTRY, 2021–2028 (USD MILLION)
8 DENTAL 3D PRINTING MARKET, BY APPLICATION (Page No. - 115)
8.1 INTRODUCTION
TABLE 38 DENTAL 3D PRINTING MARKET, BY APPLICATION, 2021–2028 (USD MILLION)
8.2 PROSTHODONTICS
8.2.1 GROWING EDENTULOUS POPULATION TO DRIVE 3D PRINTING IN PROSTHODONTICS
TABLE 39 DENTAL 3D PRINTING MARKET FOR PROSTHODONTICS, BY COUNTRY, 2021–2028 (USD MILLION)
8.3 ORTHODONTICS
8.3.1 POTENTIAL FOR IMPROVEMENTS IN CLINICAL WORKFLOW TO DRIVE DEMAND
TABLE 40 DENTAL 3D PRINTING MARKET FOR ORTHODONTICS, BY COUNTRY, 2021–2028 (USD MILLION)
8.4 IMPLANTOLOGY
8.4.1 GROWING PREFERENCE FOR 3D-PRINTED DENTAL IMPLANTS TO SUPPORT MARKET GROWTH
TABLE 41 DENTAL 3D PRINTING MARKET FOR IMPLANTOLOGY, BY COUNTRY, 2021–2028 (USD MILLION)
9 DENTAL 3D PRINTING MARKET, BY END USER (Page No. - 120)
9.1 INTRODUCTION
TABLE 42 DENTAL 3D PRINTING MARKET, BY END USER, 2021–2028 (USD MILLION)
9.2 DENTAL LABORATORIES
9.2.1 RAPID ADOPTION OF ADVANCED TECHNOLOGIES BY DENTAL LABORATORIES TO PROPEL SEGMENT GROWTH
TABLE 43 DENTAL 3D PRINTING MARKET FOR DENTAL LABORATORIES, BY COUNTRY, 2021–2028 (USD MILLION)
9.3 DENTAL HOSPITALS & CLINICS
9.3.1 GROWING NUMBER OF DENTAL CLINICS & HOSPITALS AND INCREASING TARGET POPULATION TO PROMOTE MARKET GROWTH
TABLE 44 DENTAL 3D PRINTING MARKET FOR DENTAL HOSPITALS & CLINICS, BY COUNTRY, 2021–2028 (USD MILLION)
9.4 DENTAL ACADEMIC & RESEARCH INSTITUTES
9.4.1 GROWING APPLICATION OF DENTAL 3D PRINTING IN PRECLINICAL EDUCATION TO BOOST MARKET
TABLE 45 TOP 10 NIDCR GRANTS TO US DENTAL INSTITUTIONS
TABLE 46 DENTAL 3D PRINTING MARKET FOR DENTAL ACADEMIC & RESEARCH INSTITUTES, BY COUNTRY, 2021–2028 (USD MILLION)
10 DENTAL 3D PRINTING MARKET, BY REGION (Page No. - 127)
10.1 INTRODUCTION
FIGURE 35 US TO DOMINATE DENTAL 3D MARKET DURING FORECAST PERIOD
TABLE 47 DENTAL 3D PRINTING MARKET, BY REGION, 2021–2028 (USD MILLION)
TABLE 48 DENTAL 3D PRINTING MARKET, BY COUNTRY, 2021–2028 (USD MILLION)
10.2 NORTH AMERICA
10.2.1 NORTH AMERICA: RECESSION IMPACT
FIGURE 36 NORTH AMERICA: DENTAL 3D PRINTING MARKET SNAPSHOT
TABLE 49 NORTH AMERICA: DENTAL 3D PRINTING MARKET, BY COUNTRY, 2021–2028 (USD MILLION)
TABLE 50 NORTH AMERICA: DENTAL 3D PRINTING MARKET, BY PRODUCT & SERVICE, 2021–2028 (USD MILLION)
TABLE 51 NORTH AMERICA: DENTAL 3D PRINTING EQUIPMENT MARKET, BY TYPE, 2021–2028 (USD MILLION)
TABLE 52 NORTH AMERICA: DENTAL 3D PRINTING MATERIALS MARKET, BY TYPE, 2021–2028 (USD MILLION)
TABLE 53 NORTH AMERICA: DENTAL 3D PRINTING MARKET, BY TECHNOLOGY, 2021–2028 (USD MILLION)
TABLE 54 NORTH AMERICA: VAT PHOTOPOLYMERIZATION MARKET, BY TYPE, 2021–2028 (USD MILLION)
TABLE 55 NORTH AMERICA: DENTAL 3D PRINTING MARKET, BY APPLICATION, 2021–2028 (USD MILLION)
TABLE 56 NORTH AMERICA: DENTAL 3D PRINTING MARKET, BY END USER, 2021–2028 (USD MILLION)
10.2.2 US
10.2.2.1 Presence of prominent market players and high per capita income to boost market growth
TABLE 57 US: MACROECONOMIC INDICATORS
FIGURE 37 US: RISE IN DENTAL EXPENDITURE, 2010–2030
TABLE 58 US: DENTAL 3D PRINTING MARKET, BY PRODUCT & SERVICE, 2021–2028 (USD MILLION)
TABLE 59 US: DENTAL 3D PRINTING EQUIPMENT MARKET, BY TYPE, 2021–2028 (USD MILLION)
TABLE 60 US: DENTAL 3D PRINTING MATERIALS MARKET, BY TYPE, 2021–2028 (USD MILLION)
TABLE 61 US: DENTAL 3D PRINTING MARKET, BY TECHNOLOGY, 2021–2028 (USD MILLION)
TABLE 62 US: VAT PHOTOPOLYMERIZATION MARKET, BY TYPE, 2021–2028 (USD MILLION)
TABLE 63 US: DENTAL 3D PRINTING MARKET, BY APPLICATION, 2021–2028 (USD MILLION)
TABLE 64 US: DENTAL 3D PRINTING MARKET, BY END USER, 2021–2028 (USD MILLION)
10.2.3 CANADA
10.2.3.1 Rising healthcare expenditure and favorable public & private funding to support market growth
TABLE 65 CANADA: MACROECONOMIC INDICATORS
TABLE 66 CANADA: DENTAL 3D PRINTING MARKET, BY PRODUCT & SERVICE, 2021–2028 (USD MILLION)
TABLE 67 CANADA: DENTAL 3D PRINTING EQUIPMENT MARKET, BY TYPE, 2021–2028 (USD MILLION)
TABLE 68 CANADA: DENTAL 3D PRINTING MATERIALS MARKET, BY TYPE, 2021–2028 (USD MILLION)
TABLE 69 CANADA: DENTAL 3D PRINTING MARKET, BY TECHNOLOGY, 2021–2028 (USD MILLION)
TABLE 70 CANADA: VAT PHOTOPOLYMERIZATION MARKET, BY TYPE, 2021–2028 (USD MILLION)
TABLE 71 CANADA: DENTAL 3D PRINTING MARKET, BY APPLICATION, 2021–2028 (USD MILLION)
TABLE 72 CANADA: DENTAL 3D PRINTING MARKET, BY END USER, 2021–2028 (USD MILLION)
10.3 EUROPE
10.3.1 EUROPE: RECESSION IMPACT
TABLE 73 EUROPE: DENTAL 3D PRINTING MARKET, BY COUNTRY, 2021–2028 (USD MILLION)
TABLE 74 EUROPE: DENTAL 3D PRINTING MARKET, BY PRODUCT & SERVICE, 2021–2028 (USD MILLION)
TABLE 75 EUROPE: DENTAL 3D PRINTING EQUIPMENT MARKET, BY TYPE, 2021–2028 (USD MILLION)
TABLE 76 EUROPE: DENTAL 3D PRINTING MATERIALS MARKET, BY TYPE, 2021–2028 (USD MILLION)
TABLE 77 EUROPE: DENTAL 3D PRINTING MARKET, BY TECHNOLOGY, 2021–2028 (USD MILLION)
TABLE 78 EUROPE: VAT PHOTOPOLYMERIZATION MARKET, BY TYPE, 2021–2028 (USD MILLION)
TABLE 79 EUROPE: DENTAL 3D PRINTING MARKET, BY APPLICATION, 2021–2028 (USD MILLION)
TABLE 80 EUROPE: DENTAL 3D PRINTING MARKET, BY END USER, 2021–2028 (USD MILLION)
10.3.2 GERMANY
10.3.2.1 Germany to dominate market in Europe
TABLE 81 GERMANY: MACROECONOMIC INDICATORS
TABLE 82 GERMANY: DENTAL 3D PRINTING MARKET, BY PRODUCT & SERVICE, 2021–2028 (USD MILLION)
TABLE 83 GERMANY: DENTAL 3D PRINTING EQUIPMENT MARKET, BY TYPE, 2021–2028 (USD MILLION)
TABLE 84 GERMANY: DENTAL 3D PRINTING MATERIALS MARKET, BY TYPE, 2021–2028 (USD MILLION)
TABLE 85 GERMANY: DENTAL 3D PRINTING MARKET, BY TECHNOLOGY, 2021–2028 (USD MILLION)
TABLE 86 GERMANY: VAT PHOTOPOLYMERIZATION MARKET, BY TYPE, 2021–2028 (USD MILLION)
TABLE 87 GERMANY: DENTAL 3D PRINTING MARKET, BY APPLICATION, 2021–2028 (USD MILLION)
TABLE 88 GERMANY: DENTAL 3D PRINTING MARKET, BY END USER, 2021–2028 (USD MILLION)
10.3.3 UK
10.3.3.1 Increasing incidence of dental disorders and favorable coverage under NHS to propel market growth
TABLE 89 UK: MACROECONOMIC INDICATORS
TABLE 90 UK: DENTAL 3D PRINTING MARKET, BY PRODUCT & SERVICE, 2021–2028 (USD MILLION)
TABLE 91 UK: DENTAL 3D PRINTING EQUIPMENT MARKET, BY TYPE, 2021–2028 (USD MILLION)
TABLE 92 UK: DENTAL 3D PRINTING MATERIALS MARKET, BY TYPE, 2021–2028 (USD MILLION)
TABLE 93 UK: DENTAL 3D PRINTING MARKET, BY TECHNOLOGY, 2021–2028 (USD MILLION)
TABLE 94 UK: VAT PHOTOPOLYMERIZATION MARKET, BY TYPE, 2021–2028 (USD MILLION)
TABLE 95 UK: DENTAL 3D PRINTING MARKET, BY APPLICATION, 2021–2028 (USD MILLION)
TABLE 96 UK: DENTAL 3D PRINTING MARKET, BY END USER, 2021–2028 (USD MILLION)
10.3.4 FRANCE
10.3.4.1 Favorable government healthcare strategies and rising dental professionals to drive market growth
TABLE 97 FRANCE: MACROECONOMIC INDICATORS
TABLE 98 FRANCE: DENTAL 3D PRINTING MARKET, BY PRODUCT & SERVICE, 2021–2028 (USD MILLION)
TABLE 99 FRANCE: DENTAL 3D PRINTING EQUIPMENT MARKET, BY TYPE, 2021–2028 (USD MILLION)
TABLE 100 FRANCE: DENTAL 3D PRINTING MATERIALS MARKET, BY TYPE, 2021–2028 (USD MILLION)
TABLE 101 FRANCE: DENTAL 3D PRINTING MARKET, BY TECHNOLOGY, 2021–2028 (USD MILLION)
TABLE 102 FRANCE: VAT PHOTOPOLYMERIZATION MARKET, BY TYPE, 2021–2028 (USD MILLION)
TABLE 103 FRANCE: DENTAL 3D PRINTING MARKET, BY APPLICATION, 2021–2028 (USD MILLION)
TABLE 104 FRANCE: DENTAL 3D PRINTING MARKET, BY END USER, 2021–2028 (USD MILLION)
10.3.5 ITALY
10.3.5.1 Increasing dental expenditure and low cost of dental treatment to drive market growth
TABLE 105 ITALY: MACROECONOMIC INDICATORS
TABLE 106 ITALY: DENTAL 3D PRINTING MARKET, BY PRODUCT & SERVICE, 2021–2028 (USD MILLION)
TABLE 107 ITALY: DENTAL 3D PRINTING EQUIPMENT MARKET, BY TYPE, 2021–2028 (USD MILLION)
TABLE 108 ITALY: DENTAL 3D PRINTING MATERIALS MARKET, BY TYPE, 2021–2028 (USD MILLION)
TABLE 109 ITALY: DENTAL 3D PRINTING MARKET, BY TECHNOLOGY, 2021–2028 (USD MILLION)
TABLE 110 ITALY: VAT PHOTOPOLYMERIZATION MARKET, BY TYPE, 2021–2028 (USD MILLION)
TABLE 111 ITALY: DENTAL 3D PRINTING MARKET, BY APPLICATION, 2021–2028 (USD MILLION)
TABLE 112 ITALY: DENTAL 3D PRINTING MARKET, BY END USER, 2021–2028 (USD MILLION)
10.3.6 SPAIN
10.3.6.1 Improving dental market and infrastructure to drive market growth
TABLE 113 SPAIN: MACROECONOMIC INDICATORS
TABLE 114 SPAIN: DENTAL 3D PRINTING MARKET, BY PRODUCT & SERVICE, 2021–2028 (USD MILLION)
TABLE 115 SPAIN: DENTAL 3D PRINTING EQUIPMENT MARKET, BY TYPE, 2021–2028 (USD MILLION)
TABLE 116 SPAIN: DENTAL 3D PRINTING MATERIALS MARKET, BY TYPE, 2021–2028 (USD MILLION)
TABLE 117 SPAIN: DENTAL 3D PRINTING MARKET, BY TECHNOLOGY, 2021–2028 (USD MILLION)
TABLE 118 SPAIN: VAT PHOTOPOLYMERIZATION MARKET, BY TYPE, 2021–2028 (USD MILLION)
TABLE 119 SPAIN: DENTAL 3D PRINTING MARKET, BY APPLICATION, 2021–2028 (USD MILLION)
TABLE 120 SPAIN: DENTAL 3D PRINTING MARKET, BY END USER, 2021–2028 (USD MILLION)
10.3.7 NETHERLANDS
10.3.7.1 Rising geriatric population and growing incidence of tooth loss to boost market
TABLE 121 NETHERLANDS: MACROECONOMIC INDICATORS
TABLE 122 NETHERLANDS: DENTAL 3D PRINTING MARKET, BY PRODUCT & SERVICE, 2021–2028 (USD MILLION)
TABLE 123 NETHERLANDS: DENTAL 3D PRINTING EQUIPMENT MARKET, BY TYPE, 2021–2028 (USD MILLION)
TABLE 124 NETHERLANDS: DENTAL 3D PRINTING MATERIALS MARKET, BY TYPE, 2021–2028 (USD MILLION)
TABLE 125 NETHERLANDS: DENTAL 3D PRINTING MARKET, BY TECHNOLOGY, 2021–2028 (USD MILLION)
TABLE 126 NETHERLANDS: VAT PHOTOPOLYMERIZATION MARKET, BY TYPE, 2021–2028 (USD MILLION)
TABLE 127 NETHERLANDS: DENTAL 3D PRINTING MARKET, BY APPLICATION, 2021–2028 (USD MILLION)
TABLE 128 NETHERLANDS: DENTAL 3D PRINTING MARKET, BY END USER, 2021–2028 (USD MILLION)
10.3.8 REST OF EUROPE
TABLE 129 REST OF EUROPE: DENTAL 3D PRINTING MARKET, BY PRODUCT & SERVICE, 2021–2028 (USD MILLION)
TABLE 130 REST OF EUROPE: DENTAL 3D PRINTING EQUIPMENT MARKET, BY TYPE, 2021–2028 (USD MILLION)
TABLE 131 REST OF EUROPE: DENTAL 3D PRINTING MATERIALS MARKET, BY TYPE, 2021–2028 (USD MILLION)
TABLE 132 REST OF EUROPE: DENTAL 3D PRINTING MARKET, BY TECHNOLOGY, 2021–2028 (USD MILLION)
TABLE 133 REST OF EUROPE: VAT PHOTOPOLYMERIZATION MARKET, BY TYPE, 2021–2028 (USD MILLION)
TABLE 134 REST OF EUROPE: DENTAL 3D PRINTING MARKET, BY APPLICATION, 2021–2028 (USD MILLION)
TABLE 135 REST OF EUROPE: DENTAL 3D PRINTING MARKET, BY END USER, 2021–2028 (USD MILLION)
10.4 ASIA PACIFIC
10.4.1 ASIA PACIFIC: RECESSION IMPACT
FIGURE 38 ASIA PACIFIC: DENTAL 3D PRINTING MARKET SNAPSHOT
TABLE 136 ASIA PACIFIC: DENTAL 3D PRINTING MARKET, BY COUNTRY, 2021–2028 (USD MILLION)
TABLE 137 ASIA PACIFIC: DENTAL 3D PRINTING MARKET, BY PRODUCT & SERVICE, 2021–2028 (USD MILLION)
TABLE 138 ASIA PACIFIC: DENTAL 3D PRINTING EQUIPMENT MARKET, BY TYPE, 2021–2028 (USD MILLION)
TABLE 139 ASIA PACIFIC: DENTAL 3D PRINTING MATERIALS MARKET, BY TYPE, 2021–2028 (USD MILLION)
TABLE 140 ASIA PACIFIC: DENTAL 3D PRINTING MARKET, BY TECHNOLOGY, 2021–2028 (USD MILLION)
TABLE 141 ASIA PACIFIC: VAT PHOTOPOLYMERIZATION MARKET, BY TYPE, 2021–2028 (USD MILLION)
TABLE 142 ASIA PACIFIC: DENTAL 3D PRINTING MARKET, BY APPLICATION, 2021–2028 (USD MILLION)
TABLE 143 ASIA PACIFIC: DENTAL 3D PRINTING MARKET, BY END USER, 2021–2028 (USD MILLION)
10.4.2 CHINA
10.4.2.1 China to hold largest share of APAC market
TABLE 144 CHINA: MACROECONOMIC INDICATORS
TABLE 145 CHINA: DENTAL 3D PRINTING MARKET, BY PRODUCT & SERVICE, 2021–2028 (USD MILLION)
TABLE 146 CHINA: DENTAL 3D PRINTING EQUIPMENT MARKET, BY TYPE, 2021–2028 (USD MILLION)
TABLE 147 CHINA: DENTAL 3D PRINTING MATERIALS MARKET, BY TYPE, 2021–2028 (USD MILLION)
TABLE 148 CHINA: DENTAL 3D PRINTING MARKET, BY TECHNOLOGY, 2021–2028 (USD MILLION)
TABLE 149 CHINA: VAT PHOTOPOLYMERIZATION MARKET, BY TYPE, 2021–2028 (USD MILLION)
TABLE 150 CHINA: DENTAL 3D PRINTING MARKET, BY APPLICATION, 2021–2028 (USD MILLION)
TABLE 151 CHINA: DENTAL 3D PRINTING MARKET, BY END USER, 2021–2028 (USD MILLION)
10.4.3 JAPAN
10.4.3.1 Growth in geriatric population and dental disease incidence to propel market
TABLE 152 JAPAN: MACROECONOMIC INDICATORS
TABLE 153 JAPAN: DENTAL 3D PRINTING MARKET, BY PRODUCT & SERVICE, 2021–2028 (USD MILLION)
TABLE 154 JAPAN: DENTAL 3D PRINTING EQUIPMENT MARKET, BY TYPE, 2021–2028 (USD MILLION)
TABLE 155 JAPAN: DENTAL 3D PRINTING MATERIALS MARKET, BY TYPE, 2021–2028 (USD MILLION)
TABLE 156 JAPAN: DENTAL 3D PRINTING MARKET, BY TECHNOLOGY, 2021–2028 (USD MILLION)
TABLE 157 JAPAN: VAT PHOTOPOLYMERIZATION MARKET, BY TYPE, 2021–2028 (USD MILLION)
TABLE 158 JAPAN: DENTAL 3D PRINTING MARKET, BY APPLICATION, 2021–2028 (USD MILLION)
TABLE 159 JAPAN: DENTAL 3D PRINTING MARKET, BY END USER, 2021–2028 (USD MILLION)
10.4.4 INDIA
10.4.4.1 Growing dental market with increasing private players to drive market
TABLE 160 INDIA: MACROECONOMIC INDICATORS
TABLE 161 INDIA: DENTAL 3D PRINTING MARKET, BY PRODUCT & SERVICE, 2021–2028 (USD MILLION)
TABLE 162 INDIA: DENTAL 3D PRINTING EQUIPMENT MARKET, BY TYPE, 2021–2028 (USD MILLION)
TABLE 163 INDIA: DENTAL 3D PRINTING MATERIALS MARKET, BY TYPE, 2021–2028 (USD MILLION)
TABLE 164 INDIA: DENTAL 3D PRINTING MARKET, BY TECHNOLOGY, 2021–2028 (USD MILLION)
TABLE 165 INDIA: VAT PHOTOPOLYMERIZATION MARKET, BY TYPE, 2021–2028 (USD MILLION)
TABLE 166 INDIA: DENTAL 3D PRINTING MARKET, BY APPLICATION, 2021–2028 (USD MILLION)
TABLE 167 INDIA: DENTAL 3D PRINTING MARKET, BY END USER, 2021–2028 (USD MILLION)
10.4.5 AUSTRALIA
10.4.5.1 Favorable government initiatives and growing disease cases to support market growth
TABLE 168 AUSTRALIA: MACROECONOMIC INDICATORS
TABLE 169 AUSTRALIA: DENTAL 3D PRINTING MARKET, BY PRODUCT & SERVICE, 2021–2028 (USD MILLION)
TABLE 170 AUSTRALIA: DENTAL 3D PRINTING EQUIPMENT MARKET, BY TYPE, 2021–2028 (USD MILLION)
TABLE 171 AUSTRALIA: DENTAL 3D PRINTING MATERIALS MARKET, BY TYPE, 2021–2028 (USD MILLION)
TABLE 172 AUSTRALIA: DENTAL 3D PRINTING MARKET, BY TECHNOLOGY, 2021–2028 (USD MILLION)
TABLE 173 AUSTRALIA: VAT PHOTOPOLYMERIZATION MARKET, BY TYPE, 2021–2028 (USD MILLION)
TABLE 174 AUSTRALIA: DENTAL 3D PRINTING MARKET, BY APPLICATION, 2021–2028 (USD MILLION)
TABLE 175 AUSTRALIA: DENTAL 3D PRINTING MARKET, BY END USER, 2021–2028 (USD MILLION)
10.4.6 SOUTH KOREA
10.4.6.1 Rising disposable income and geriatric population to boost market
TABLE 176 SOUTH KOREA: MACROECONOMIC INDICATORS
TABLE 177 SOUTH KOREA: DENTAL 3D PRINTING MARKET, BY PRODUCT & SERVICE, 2021–2028 (USD MILLION)
TABLE 178 SOUTH KOREA: DENTAL 3D PRINTING EQUIPMENT MARKET, BY TYPE, 2021–2028 (USD MILLION)
TABLE 179 SOUTH KOREA: DENTAL 3D PRINTING MATERIALS MARKET, BY TYPE, 2021–2028 (USD MILLION)
TABLE 180 SOUTH KOREA: DENTAL 3D PRINTING MARKET, BY TECHNOLOGY, 2021–2028 (USD MILLION)
TABLE 181 SOUTH KOREA: VAT PHOTOPOLYMERIZATION MARKET, BY TYPE, 2021–2028 (USD MILLION)
TABLE 182 SOUTH KOREA: DENTAL 3D PRINTING MARKET, BY APPLICATION, 2021–2028 (USD MILLION)
TABLE 183 SOUTH KOREA: DENTAL 3D PRINTING MARKET, BY END USER, 2021–2028 (USD MILLION)
10.4.7 REST OF ASIA PACIFIC
TABLE 184 REST OF ASIA PACIFIC: DENTAL 3D PRINTING MARKET, BY PRODUCT & SERVICE, 2021–2028 (USD MILLION)
TABLE 185 REST OF ASIA PACIFIC: DENTAL 3D PRINTING EQUIPMENT MARKET, BY TYPE, 2021–2028 (USD MILLION)
TABLE 186 REST OF ASIA PACIFIC: DENTAL 3D PRINTING MATERIALS MARKET, BY TYPE, 2021–2028 (USD MILLION)
TABLE 187 REST OF ASIA PACIFIC: DENTAL 3D PRINTING MARKET, BY TECHNOLOGY, 2021–2028 (USD MILLION)
TABLE 188 REST OF ASIA PACIFIC: VAT PHOTOPOLYMERIZATION MARKET, BY TYPE, 2021–2028 (USD MILLION)
TABLE 189 REST OF ASIA PACIFIC: DENTAL 3D PRINTING MARKET, BY APPLICATION, 2021–2028 (USD MILLION)
TABLE 190 REST OF ASIA PACIFIC: DENTAL 3D PRINTING MARKET, BY END USER, 2021–2028 (USD MILLION)
10.5 LATIN AMERICA
10.5.1 LATIN AMERICA: RECESSION IMPACT
TABLE 191 LATIN AMERICA: DENTAL 3D PRINTING MARKET, BY COUNTRY, 2021–2028 (USD MILLION)
TABLE 192 LATIN AMERICA: DENTAL 3D PRINTING MARKET, BY PRODUCT & SERVICE, 2021–2028 (USD MILLION)
TABLE 193 LATIN AMERICA: DENTAL 3D PRINTING EQUIPMENT MARKET, BY TYPE, 2021–2028 (USD MILLION)
TABLE 194 LATIN AMERICA: DENTAL 3D PRINTING MATERIALS MARKET, BY TYPE, 2021–2028 (USD MILLION)
TABLE 195 LATIN AMERICA: DENTAL 3D PRINTING MARKET, BY TECHNOLOGY, 2021–2028 (USD MILLION)
TABLE 196 LATIN AMERICA: VAT PHOTOPOLYMERIZATION MARKET, BY TYPE, 2021–2028 (USD MILLION)
TABLE 197 LATIN AMERICA: DENTAL 3D PRINTING MARKET, BY APPLICATION, 2021–2028 (USD MILLION)
TABLE 198 LATIN AMERICA: DENTAL 3D PRINTING MARKET, BY END USER, 2021–2028 (USD MILLION)
10.5.2 BRAZIL
10.5.2.1 Brazil to dominate LATAM market throughout forecast period
TABLE 199 BRAZIL: MACROECONOMIC INDICATORS
TABLE 200 BRAZIL: DENTAL 3D PRINTING MARKET, BY PRODUCT & SERVICE, 2021–2028 (USD MILLION)
TABLE 201 BRAZIL: DENTAL 3D PRINTING EQUIPMENT MARKET, BY TYPE, 2021–2028 (USD MILLION)
TABLE 202 BRAZIL: DENTAL 3D PRINTING MATERIALS MARKET, BY TYPE, 2021–2028 (USD MILLION)
TABLE 203 BRAZIL: DENTAL 3D PRINTING MARKET, BY TECHNOLOGY, 2021–2028 (USD MILLION)
TABLE 204 BRAZIL: VAT PHOTOPOLYMERIZATION MARKET, BY TYPE, 2021–2028 (USD MILLION)
TABLE 205 BRAZIL: DENTAL 3D PRINTING MARKET, BY APPLICATION, 2021–2028 (USD MILLION)
TABLE 206 BRAZIL: DENTAL 3D PRINTING MARKET, BY END USER, 2021–2028 (USD MILLION)
10.5.3 MEXICO
10.5.3.1 Growing need to improve healthcare infrastructure and availability of skilled dentists to propel market
TABLE 207 MEXICO: MACROECONOMIC INDICATORS
TABLE 208 MEXICO: DENTAL 3D PRINTING MARKET, BY PRODUCT & SERVICE, 2021–2028 (USD MILLION)
TABLE 209 MEXICO: DENTAL 3D PRINTING EQUIPMENT MARKET, BY TYPE, 2021–2028 (USD MILLION)
TABLE 210 MEXICO: DENTAL 3D PRINTING MATERIALS MARKET, BY TYPE, 2021–2028 (USD MILLION)
TABLE 211 MEXICO: DENTAL 3D PRINTING MARKET, BY TECHNOLOGY, 2021–2028 (USD MILLION)
TABLE 212 MEXICO: VAT PHOTOPOLYMERIZATION MARKET, BY TYPE, 2021–2028 (USD MILLION)
TABLE 213 MEXICO: DENTAL 3D PRINTING MARKET, BY APPLICATION, 2021–2028 (USD MILLION)
TABLE 214 MEXICO: DENTAL 3D PRINTING MARKET, BY END USER, 2021–2028 (USD MILLION)
10.5.4 REST OF LATIN AMERICA
TABLE 215 REST OF LATIN AMERICA: DENTAL 3D PRINTING MARKET, BY PRODUCT & SERVICE, 2021–2028 (USD MILLION)
TABLE 216 REST OF LATIN AMERICA: DENTAL 3D PRINTING EQUIPMENT MARKET, BY TYPE, 2021–2028 (USD MILLION)
TABLE 217 REST OF LATIN AMERICA: DENTAL 3D PRINTING MATERIALS MARKET, BY TYPE, 2021–2028 (USD MILLION)
TABLE 218 REST OF LATIN AMERICA: DENTAL 3D PRINTING MARKET, BY TECHNOLOGY, 2021–2028 (USD MILLION)
TABLE 219 REST OF LATIN AMERICA: VAT PHOTOPOLYMERIZATION MARKET, BY TYPE, 2021–2028 (USD MILLION)
TABLE 220 REST OF LATIN AMERICA: DENTAL 3D PRINTING MARKET, BY APPLICATION, 2021–2028 (USD MILLION)
TABLE 221 REST OF LATIN AMERICA: DENTAL 3D PRINTING MARKET, BY END USER, 2021–2028 (USD MILLION)
10.6 MIDDLE EAST & AFRICA
10.6.1 RISING PRESENCE OF MARKET PLAYERS AND INCREASING AWARENESS TO PROMOTE MARKET GROWTH
10.6.2 MIDDLE EAST & AFRICA: RECESSION IMPACT
TABLE 222 MIDDLE EAST & AFRICA: DENTAL 3D PRINTING MARKET, BY PRODUCT & SERVICE, 2021–2028 (USD MILLION)
TABLE 223 MIDDLE EAST & AFRICA: DENTAL 3D PRINTING EQUIPMENT MARKET, BY TYPE, 2021–2028 (USD MILLION)
TABLE 224 MIDDLE EAST & AFRICA: DENTAL 3D PRINTING MATERIALS MARKET, BY TYPE, 2021–2028 (USD MILLION)
TABLE 225 MIDDLE EAST & AFRICA: DENTAL 3D PRINTING MARKET, BY TECHNOLOGY, 2021–2028 (USD MILLION)
TABLE 226 MIDDLE EAST & AFRICA: VAT PHOTOPOLYMERIZATION MARKET, BY TYPE, 2021–2028 (USD MILLION)
TABLE 227 MIDDLE EAST & AFRICA: DENTAL 3D PRINTING MARKET, BY APPLICATION, 2021–2028 (USD MILLION)
TABLE 228 MIDDLE EAST & AFRICA: DENTAL 3D PRINTING MARKET, BY END USER, 2021–2028 (USD MILLION)
11 COMPETITIVE LANDSCAPE (Page No. - 209)
11.1 OVERVIEW
11.1.1 STRATEGIES ADOPTED BY KEY PLAYERS
TABLE 229 DENTAL 3D PRINTING MARKET: OVERVIEW OF STRATEGIES ADOPTED BY MAJOR PLAYERS
11.2 REVENUE SHARE ANALYSIS FOR KEY PLAYERS
FIGURE 39 DENTAL 3D PRINTING MARKET: REVENUE SHARE ANALYSIS OF KEY PLAYERS
11.3 MARKET SHARE ANALYSIS
FIGURE 40 DENTAL 3D PRINTING MATERIALS MARKET SHARE ANALYSIS, BY KEY PLAYER (2022)
FIGURE 41 DENTAL 3D PRINTING EQUIPMENT MARKET SHARE ANALYSIS, BY KEY PLAYER (2022)
TABLE 230 DENTAL 3D PRINTING EQUIPMENT MARKET: DEGREE OF COMPETITION
11.4 R&D ASSESSMENT OF KEY PLAYERS
FIGURE 42 R&D EXPENDITURE: MAJOR PLAYERS IN DENTAL 3D PRINTING MARKET, 2020–2022
11.5 GEOGRAPHIC REVENUE ASSESSMENT OF KEY PLAYERS
FIGURE 43 GEOGRAPHIC REVENUE ASSESSMENT: DENTAL 3D PRINTING MARKET (2022)
11.6 COMPANY EVALUATION QUADRANT, 2022
11.6.1 STARS
11.6.2 EMERGING LEADERS
11.6.3 PERVASIVE PLAYERS
11.6.4 PARTICIPANTS
FIGURE 44 DENTAL 3D PRINTING MARKET: COMPANY EVALUATION MATRIX, 2022
11.7 COMPANY EVALUATION QUADRANT FOR START-UPS/SMES, 2022
11.7.1 PROGRESSIVE COMPANIES
11.7.2 DYNAMIC COMPANIES
11.7.3 STARTING BLOCKS
11.7.4 RESPONSIVE COMPANIES
FIGURE 45 DENTAL 3D PRINTING MARKET: COMPANY EVALUATION MATRIX FOR START-UPS/SMES, 2022
11.8 COMPETITIVE BENCHMARKING
TABLE 231 OVERALL COMPANY FOOTPRINT ANALYSIS (25 COMPANIES)
TABLE 232 COMPANY FOOTPRINT ANALYSIS FOR KEY PLAYERS, BY PRODUCT & SERVICE
TABLE 233 COMPANY FOOTPRINT ANALYSIS FOR KEY PLAYERS, BY TECHNOLOGY
TABLE 234 COMPANY FOOTPRINT ANALYSIS FOR KEY PLAYERS, BY APPLICATION
TABLE 235 COMPANY FOOTPRINT ANALYSIS FOR KEY PLAYERS, BY END USER
TABLE 236 COMPANY FOOTPRINT ANALYSIS FOR KEY PLAYERS, BY REGION
11.9 COMPETITIVE SCENARIO
11.9.1 PRODUCT LAUNCHES, ENHANCEMENTS, AND APPROVALS
TABLE 237 PRODUCT LAUNCHES, ENHANCEMENTS, AND APPROVALS (2021–2023)
11.9.2 DEALS
TABLE 238 DEALS (2021–2023)
11.9.3 OTHER DEVELOPMENTS
TABLE 239 OTHER DEVELOPMENTS (2021–2023)
12 COMPANY PROFILES (Page No. - 228)
(Business overview, Products/Solutions/Services offered, Recent Developments, MNM view)*
12.1 KEY PLAYERS
12.1.1 STRATASYS LTD.
TABLE 240 STRATASYS: BUSINESS OVERVIEW
FIGURE 46 STRATASYS: COMPANY SNAPSHOT (2022)
12.1.2 3D SYSTEMS CORPORATION
TABLE 241 3D SYSTEMS CORPORATION: BUSINESS OVERVIEW
FIGURE 47 3D SYSTEMS CORPORATION: COMPANY SNAPSHOT (2022)
12.1.3 DESKTOP METAL, INC.
TABLE 242 DESKTOP METAL: BUSINESS OVERVIEW
FIGURE 48 DESKTOP METAL: COMPANY SNAPSHOT (2022)
12.1.4 DWS SYSTEMS SRL
TABLE 243 DWS SYSTEMS SRL: BUSINESS OVERVIEW
12.1.5 ALIGN TECHNOLOGY, INC.
TABLE 244 ALIGN TECHNOLOGY, INC.: BUSINESS OVERVIEW
FIGURE 49 ALIGN TECHNOLOGY: COMPANY SNAPSHOT (2022)
12.1.6 FORMLABS
TABLE 245 FORMLABS: BUSINESS OVERVIEW
12.1.7 PRODWAYS GROUP
TABLE 246 PRODWAYS GROUP: BUSINESS OVERVIEW
FIGURE 50 PRODWAYS GROUP: COMPANY SNAPSHOT (2022)
12.1.8 SLM SOLUTIONS GROUP AG
TABLE 247 SLM SOLUTIONS GROUP AG: BUSINESS OVERVIEW
FIGURE 51 SLM SOLUTIONS GROUP AG: COMPANY SNAPSHOT (2022)
12.1.9 CARBON, INC.
TABLE 248 CARBON: BUSINESS OVERVIEW
12.1.10 GE ADDITIVE
TABLE 249 GE ADDITIVE: BUSINESS OVERVIEW
12.2 OTHER PLAYERS
12.2.1 EOS GMBH
TABLE 250 EOS GMBH: BUSINESS OVERVIEW
12.2.2 RAPID SHAPE GMBH
TABLE 251 RAPID SHAPE GMBH: BUSINESS OVERVIEW
12.2.3 ASIGA
TABLE 252 ASIGA: BUSINESS OVERVIEW
12.2.4 ROLAND DG CORPORATION
TABLE 253 ROLAND DG CORPORATION: BUSINESS OVERVIEW
FIGURE 52 ROLAND DG CORPORATION: COMPANY SNAPSHOT (2022)
12.2.5 DENTSPLY SIRONA
TABLE 254 DENTSPLY SIRONA: BUSINESS OVERVIEW
FIGURE 53 DENTSPLY SIRONA: COMPANY SNAPSHOT (2022)
12.2.6 SPRINTRAY INC.
TABLE 255 SPRINTRAY: BUSINESS OVERVIEW
12.2.7 ZORTRAX
TABLE 256 ZORTRAX: BUSINESS OVERVIEW
12.2.8 DETAX GMBH
TABLE 257 DETAX GMBH: BUSINESS OVERVIEW
12.2.9 DMG AMERICA
TABLE 258 DMG AMERICA: BUSINESS OVERVIEW
12.2.10 RESYNER TECHNOLOGIES S.L. (3DRESYNS)
TABLE 259 3DRESYNS: BUSINESS OVERVIEW
12.2.11 MICRON DENTAL
TABLE 260 MICRON DENTAL: BUSINESS OVERVIEW
12.2.12 ACKURETTA TECHNOLOGIES PVT. LTD.
TABLE 261 ACKURETTA TECHNOLOGIES: BUSINESS OVERVIEW
12.2.13 CARIMA
TABLE 262 CARIMA: BUSINESS OVERVIEW
12.2.14 PLANMECA OY
TABLE 263 PLANMECA: BUSINESS OVERVIEW
12.2.15 SHENZHEN PIOCREAT 3D TECHNOLOGY CO., LTD
TABLE 264 SHENZHEN PIOCREAT 3D TECHNOLOGY: BUSINESS OVERVIEW
*Details on Business overview, Products/Solutions/Services offered, Recent Developments, MNM view might not be captured in case of unlisted companies.
13 APPENDIX (Page No. - 298)
13.1 DISCUSSION GUIDE
13.2 KNOWLEDGESTORE: MARKETSANDMARKETS’ SUBSCRIPTION PORTAL
13.3 CUSTOMIZATION OPTIONS
13.4 RELATED REPORTS
13.5 AUTHOR DETAILS


 Generating Response ...


Growth opportunities and latent adjacency in Dental 3D Printing Market