Electric Scooter and Motorcycle Market

Electric Scooter and Motorcycle Market by Vehicle (E-Scooters/Mopeds & E-Motorcycles), Battery (Lead Acid & Li-Ion), Distance, Voltage (36V, 48V, 60V, 72V, Above 72V), Technology Usage(Private, Commercial), Vehicle Class & Region - Global Forecast to 2028

Report Code: AT 7219 Mar, 2023, by marketsandmarkets.com

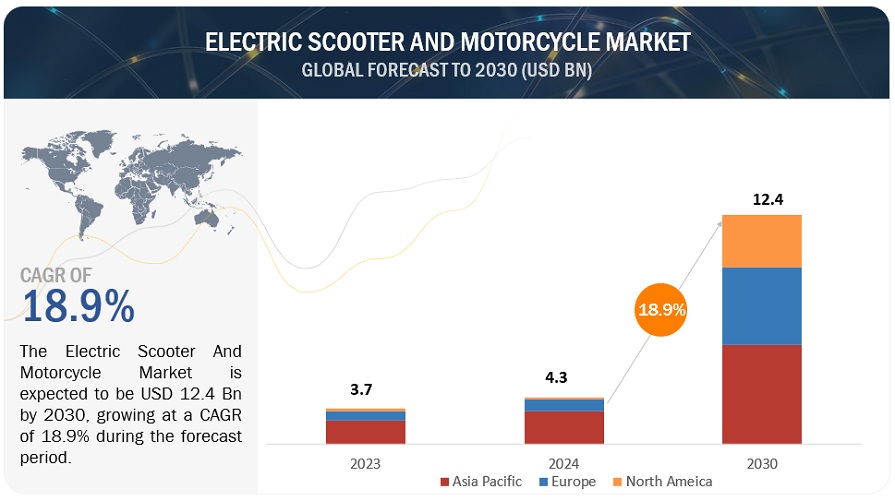
[392 Pages Report] The global electric scooter and motorcycle market, by value, is estimated to be USD 4.9  billion in 2023 and is projected to reach USD 14.7 billion by 2028, at a CAGR of 24.8% from 2023 to 2028. With rising emission levels, increasing prices, and the limited availability of petroleum, the demand for zero-emission alternative fuel vehicles has increased. This has, in turn, increased the demand for electric two-wheelers during the last few years.

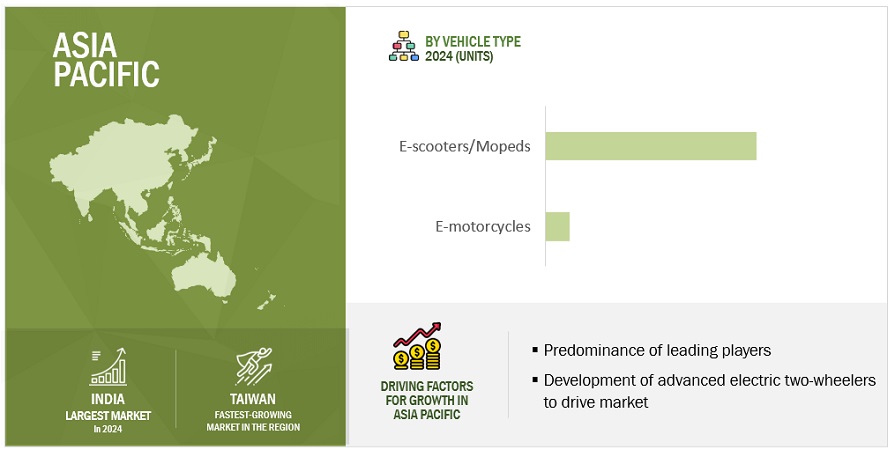
The most important part of any electric two wheeler is its battery. The performance, efficiency, and price of electric two wheelers are dependent on the battery installed. Till 2020, most electric scooters and motorcycles were offered with lead-acid batteries. However, two wheeler manufacturers are now focused on the development and installation of more advanced li-ion batteries in new electric scooters and motorcycles to overcome the disadvantages of lead-acid batteries. The economic growth and a rapidly growing population in India have made it imperative for the country to enhance its commuting media. The Indian Government offers buyers incentives to promote electric two-wheelers in the region. Asia Pacific region has major market players such as NIU International (China), Okinawa Autotech Internationall Private Limited (India), Jiangsu Xinri E-Vehicle Co., Ltd (China), Hero Electric (India), Yadea Technology Group Co.,Ltd. (China) and others that offer a wide range of electric scooters with advanced connectivity features for end-use applications. The implementation of new technologies and the establishment of new government regulations drive the electric scooter and motorcycle market in this region. In January 2023, Exicom, entered into an agreement with Hero Electric to supply Battery Management Systems (BMS) for the latter’s electric two-w­heelers in India.

Electric Scooter and Motorcycle Market

To know about the assumptions considered for the study, Request for Free Sample Report

Market Dynamics:

Driver: Implementation of Battery Swapping Technology

Battery swapping is a new technology that allows owner of electric vehicle to swap out their dying or dead battries with fully charged one. This development could completely transform the E2W market and improve the comfort and ease of long-distance driving for motorists. Automatic and manual battery switching are the two main methods that are use in battery swapping. The automated approach involves changing batteries with a robotic arm, much like changing of oil at a gas station. In manual technique where drained battery must be removed from the car and replaced with the fully charged.

The fact that range anxiety, a typical worry among EV users, is eliminated is one of the main advantages of battery swapping. With this technology in place, drivers won't have to worry about becoming stuck without a charge because all they have to do is stop at a switch station when they run out of power. Furthermore, because battery-swapping stations are far less expensive to construct than conventional gas stations, they are more accessible to communities that might not otherwise have access to fuelling choices. This may have a significant impact, especially in rural areas and underdeveloped nations where EV use is growing. In addition to this, Government are making policies and investment for development of battart sanpping station. For Instance, In February 2023,  Indian Government in financial budget 2023 announced to introduce a Battery Swapping Policy and interoperability standards to improve efficiency in the EV ecosystem. Such quick investments and advancements in battery technology will solve the problem of range limitation in electric two-wheelers, which positively encouraging customers to favour electric scooters and motorcycles.

Restraint: Lack of power output and limited range

The market for electric scooters and motorcycles is still in its early stages of development. Although manufacturers employ cutting-edge design and technology, these vehicles have not yet reached the efficiency and power levels of traditional two-wheelers. The majority of the electric bikes and scooters that have recently been released don't have the power output that customers want. A few concept models that meet the performance and design parameters have been developed by manufacturers.

Range limitation is another significant issue that is seen as a barrier in the market for electric scooters and motorcycles. Electric two-wheelers lack fuel tanks, in contrast to traditional two-wheelers. The range that a completely charged battery can reach is considerably less than that of traditional two-wheelers. Most electric two-wheelers currently available have a range of up to 100–120 miles. Because of this, consumers are wary of buying electric two-wheelers, especially those who make frequent long distance trips.

Opportunity: Use of IoT and Smart Infrastructure in Electric Two Wheelers Charging Station for Load Management

The increasing adoption of smartphones and connectivity solutions has inspired electric two wheelers manufacturers to integrates smartphones with the velectric two wheelers and infrastructure instruments clusters for more enhanced operation. Smartphones can be easily connected Via wireless LAN (WLAN), USB, or Bluetooth. Most Electric Two Wheelers charging station manufacturers have been developing Smart electric two wheelers charging stations, Which come with IoT based feature for load management and smart connectivity. Home charging stations these days come with software for charging analysis of electric two wheelers. Meanwhile, public and semi-public electric two wheelers charging station come with smart payments and power managements features for better power control and ease of electric two wheeler charging by customers combined with automated payment features.

Challenge: Initial investments and high cost of electricity

Electric two wheelers have lower operating costs than ICE two wheelrs in the long term. However, initial investment are higher than those for conventional two wheelers. The components used in electric two wheelers such as batteries, motors, and other electric components are more expensive than conventional mechanical parts. The electric two wheeler battery cost 40-50% of the overall production cost. At present, most manufacturers offer electric two wheelers along with charging solutions, making it can expensive initial investment for buyers. The high cost involved in developing electric two wheelers and relatated components such as batteries and monitoring systems is a major restraint for electric two wheeler adopting. The electric two wheeler battery need frequent and fast charging through additional equipment such as electric chargers, which are only aavailable at EV charging stations. The battery, charger, and installation cost of the charger add to the cost of the electric two wheelers, making them costlier than traditional ICE two wheelers.

The E-scooter/moped segment is expected to be the largest segment during the forecast period

E-scooter/moped is projected to form the largest segment in the electric scooter and motorcycle market during the forecast period due to the lower initial price than e-motorcycles and growing demand for affordable commuting. For instance, Nexzu Mobility has evolved into a holistic electric mobility company that operates in both B2B and B2C segments for electric two wheeler with the intention of bringing stylish and futuristic eco-friendly vehicles to consumers at an affordable price the segment is also estimated to be the fastest growing due to the higher adoption rate in the market across the globe. Electric scooters are suited for multiple end-use applications, making them preferable to electric motorcycles.

Electric scooters/mopeds offer the benefit of energy-efficient daily commuting and help reduce pollution. Several well-established two-wheeler manufacturers have entered the electric scooters/mopeds segment. For instance, In January 2023, Damon Motors, announced a partnership with PT Indika Energy Tbk., Indonesia’s leading diversified energy company. Indika has also made an undisclosed investment in Damon and will serve as the distributor for Damon’s line of motorcycles in the Indonesian market. Several other players have developed new models of electric scooters.

Silence Urban Ecomobility (Spain), NIU International (China), Okinawa (India), Jiangsu Xinri E-Vehicle Co., Ltd (China), Hero electric (India), Yadea (China), etc., offer a wide range of electric scooters with advanced connectivity features for end-use applications. So, the electric scooters/mopeds market is estimated to grow significantly over the forecast period.

The Asia Pacific market is projected to hold the largest share by 2028

Electric scooters for short-distance commuting, and governments promoting electric two-wheelers are expected to drive the Asia Pacific market during the forecast period. Key Asian manufacturers such as NIU International (China), Yadea Technology Group Co.,Ltd. (China), Jiangsu Xinri (China), Hero Electric (India), and Okinawa Autotech Internationall Private Limited (India) and others key players in the region. In April-2022, Init Esports, the Esports Powerhouse that specializes in sim racing events & motorcycle tournaments, announced its partnership with NIU Technologies, the world’s leading provider of smart urban mobility solutions. The market in Europe would be driven by the rising adoption of electric two wheelers and a strong policy environment, including various tax breaks and subsidies supporting the growth of the market. So, these are the key factors that will drive the growth of the market over the forecast period.
Electric Scooter and Motorcycle Market  Size, and Share

To know about the assumptions considered for the study, download the pdf brochure

Key Market Players

The global electric scooter and motorcycle market is dominated by major players such as Yadea Technology Group Co.,Ltd. (China), Jiangsu Xinri E-Vehicle Co., Ltd (China), NIU International (China), Hero Electric (India), and Okinawa Autotech Internationall Private Limited (India). These companies offer extensive products and solutions for the electric two-wheeler industry; and have strong distribution networks at the global level, and they invest heavily in R&D to develop new products.

Get online access to the report on the World's First Market Intelligence Cloud

  • Easy to Download Historical Data & Forecast Numbers
  • Company Analysis Dashboard for high growth potential opportunities
  • Research Analyst Access for customization & queries
  • Competitor Analysis with Interactive dashboard
  • Latest News, Updates & Trend analysis
Request Sample

Scope of the Report

Report Metric

Details

Market size available for years

2018–2028

Base year considered

2022

Forecast period

2023-2028

Forecast units

Volume (Thousand Units) and Value (USD Million)

Segments covered

Vehicle Type, Battery, Distance Covered, Voltage, Technology, Vehicle Class Usage, and Region

Geographies covered

Asia Pacific, Europe, and North America

Companies Covered

Yadea Technology Group Co.,Ltd. (China), Jiangsu Xinri E-Vehicle Co., Ltd (China), NIU International (China), Hero Electric (India), and Okinawa Autotech Internationall Private Limited (India). 
A total of 48 major company profiles covered and provided

This research report categorizes the electric scooter and motorcycle market based on vehicle type, battery, distance covered, technology, voltage, vehicle class, usage and region.

Based on the vehicle type:
  • E-Scooter/Moped
  • E-Motorcycle
Based on the battery type:
  • Sealed lead acid
  • Lithium-ion
Based on the distance covered:
  • Below 75 miles
  • 75-100 Miles
  • Above 100 Miles
Based on the technology:
  • Plug-in
  • Battery
Based on the voltage:
  • 36V
  • 48V
  • 60V
  • 72V
  • Above 72V
Based on the vehicle class:
  • Economy
  • Luxury
Based on the usage
  • Commercial
  • Private
Based on the region:
  • Asia Pacific
    • China
    • India
    • Japan
    • South Korea
    • Taiwan
    • Indonesia
    • Thailand
    • Malaysia
    • Vietnam
    • Phillipines
  • North America
    • US
    • Canada
  • Europe
    • France
    • Germany
    • Italy
    • Spain
    • United Kingdom
    • Austria
    • Belgium
    • Netherlands
    • Poland
    • Denmark

Recent Developments

  • In January 2023 Yadea Group (China) launched Yadea Keeness VFD atConsumer Electronics Show (CES) in Las Vegas, Nevada. Keeness VFD model is equipped with a 10KW mid-mounted high-performance motor and features a maximum speed of 100km/h, and an acceleration from 0-50km/h in just 4 seconds.
  • In January 2023 Yadea Group (China) launched new model Volrguard. The scooter is powered by an ATL lithium battery pack (72V27Ah*2), featured with ultra-high density, which outputs higher power at the same time.
  • January 2023, hero electric has entered into a long-term partnership with maxwell energy systems for the supply of advanced battery management systems. Under the partnership, maxwell will supply more than 10 lakh units of its battery management systems (bms) over the next three years to hero electric.
  • October 2022, NIU International announced to  launch of their newest kick scooter, the KQi3 Max. With a top speed of 20 MPH, and a 40.4-mile range, the KQi3 Max kick scooter offers maximum performance, comfort, and stability.
  • April 2022, Init Esports, the Esports Powerhouse that specializes in sim racing events & motorcycle tournaments, announced its partnership with NIU Technologies, the world’s leading provider of smart urban mobility solutions.
  • July 2022, The Silence Urban Ecomobility launched new model S01+. Scooter is equipped with 7.5 kWh of battery with vehicle range of 137 km/charge. The scooter has a top speed of 109 kmph.
  • December 2022, Astara has signed a strategic partnership with Silence Urban Ecomobility to distribute their electric scooters and vehicles for micro mobility in Belgium and Luxembourg.

Frequently Asked Questions (FAQ):

To speak to our analyst for a discussion on the above findings, click Speak to Analyst

TABLE OF CONTENTS
 
1 INTRODUCTION (Page No. - 46)
    1.1 STUDY OBJECTIVES 
    1.2 MARKET DEFINITION 
           TABLE 1 ELECTRIC SCOOTER AND MOTORCYCLE MARKET DEFINITION, BY VEHICLE TYPE
           TABLE 2 MARKET DEFINITION, BY BATTERY TYPE
           TABLE 3 MARKET DEFINITION, BY TECHNOLOGY TYPE
           TABLE 4 MARKET DEFINITION, BY VEHICLE CLASS
           TABLE 5 MARKET DEFINITION, BY USAGE
           1.2.1 INCLUSIONS AND EXCLUSIONS
                    TABLE 6 INCLUSIONS AND EXCLUSIONS FOR MARKET
    1.3 MARKET SCOPE 
           FIGURE 1 MARKET SEGMENTATION
           1.3.1 YEARS CONSIDERED
    1.4 CURRENCY CONSIDERED 
           TABLE 7 CURRENCY EXCHANGE RATES
    1.5 UNITS CONSIDERED 
    1.6 STAKEHOLDERS 
    1.7 SUMMARY OF CHANGES 
 
2 RESEARCH METHODOLOGY (Page No. - 53)
    2.1 RESEARCH DATA 
           FIGURE 2 ELECTRIC SCOOTER AND MOTORCYCLE MARKET: RESEARCH DESIGN
           FIGURE 3 RESEARCH METHODOLOGY MODEL
           2.1.1 SECONDARY DATA
                    2.1.1.1 Key secondary sources
                    2.1.1.2 Key data from secondary sources
           2.1.2 PRIMARY DATA
                    2.1.2.1 Key data from primary sources
                    2.1.2.2 List of participating companies for primary research
                    2.1.2.3 Key industry insights
                               FIGURE 4 BREAKDOWN OF PRIMARY INTERVIEWS BY COMPANY TYPE, DESIGNATION, AND REGION
                    2.1.2.4 Major objectives of primary research
           2.1.3 LIST OF PRIMARY PARTICIPANTS
    2.2 MARKET ESTIMATION METHODOLOGY 
           FIGURE 5 RESEARCH METHODOLOGY: HYPOTHESIS BUILDING
    2.3 MARKET SIZE ESTIMATION 
           2.3.1 RECESSION IMPACT ANALYSIS
           2.3.2 BOTTOM-UP APPROACH
                    FIGURE 6 BOTTOM-UP APPROACH: MARKET
           2.3.3 TOP-DOWN APPROACH
                    FIGURE 7 TOP-DOWN APPROACH: MARKET
                    FIGURE 8 MARKET: ESTIMATION NOTES
                    FIGURE 9 MARKET: RESEARCH DESIGN & METHODOLOGY – DEMAND SIDE
    2.4 MARKET BREAKDOWN AND DATA TRIANGULATION 
           FIGURE 10 DATA TRIANGULATION
    2.5 FACTOR ANALYSIS 
           2.5.1 MARKET GROWTH PROJECTIONS FROM DEMAND-SIDE DRIVERS AND OPPORTUNITIES
                    FIGURE 11 MARKET GROWTH PROJECTIONS FROM DEMAND-SIDE DRIVERS AND OPPORTUNITIES
    2.6 RESEARCH ASSUMPTIONS 
    2.7 RESEARCH LIMITATIONS 
 
3 EXECUTIVE SUMMARY (Page No. - 68)
    FIGURE 12 ELECTRIC SCOOTER AND MOTORCYCLE MARKET: MARKET OVERVIEW 
    FIGURE 13 E-SCOOTERS/MOPEDS SEGMENT TO HAVE LARGER MARKET SHARE THAN E-MOTORCYCLES SEGMENT FROM 2023 TO 2028 
    FIGURE 14 MARKET, BY REGION, 2023–2028 
 
4 PREMIUM INSIGHTS (Page No. - 72)
    4.1 ATTRACTIVE OPPORTUNITIES FOR PLAYERS IN ELECTRIC SCOOTER AND MOTORCYCLE MARKET 
           FIGURE 15 INCREASING DEMAND FOR EFFICIENT AND EMISSION-FREE COMMUTES TO DRIVE MARKET GROWTH
    4.2 MARKET, BY REGION 
           FIGURE 16 ASIA PACIFIC TO DOMINATE MARKET FROM 2023 TO 2028
    4.3 MARKET, BY VEHICLE TYPE 
           FIGURE 17 E-SCOOTERS/MOPEDS SEGMENT TO LEAD MARKET DURING FORECAST PERIOD
    4.4 MARKET, BY BATTERY TYPE 
           FIGURE 18 LITHIUM-ION SEGMENT TO REGISTER HIGHER CAGR THAN SEALED LEAD-ACID SEGMENT FROM 2023 TO 2028
    4.5 MARKET, BY DISTANCE COVERED 
           FIGURE 19 BELOW 75 MILES SEGMENT TO LEAD MARKET DURING FORECAST PERIOD
    4.6 MARKET, BY VOLTAGE 
           FIGURE 20 60 V SEGMENT TO COMMAND HIGHEST MARKET DEMAND FROM 2023 TO 2028
   (Page No. - )
    4.7 MARKET, BY TECHNOLOGY TYPE 
           FIGURE 21 PLUG-IN SEGMENT TO LEAD MARKET DURING FORECAST PERIOD
    4.8 MARKET, BY VEHICLE CLASS 
           FIGURE 22 ECONOMY SEGMENT TO LEAD MARKET FROM 2023 TO 2028
    4.9 MARKET, BY USAGE 
           FIGURE 23 COMMERCIAL SEGMENT TO REGISTER HIGHER CAGR THAN PRIVATE SEGMENT DURING FORECAST PERIOD
 
5 MARKET OVERVIEW (Page No. - 77)
    5.1 INTRODUCTION 
           TABLE 8 IMPACT OF MARKET DYNAMICS
    5.2 MARKET DYNAMICS 
           FIGURE 24 ELECTRIC SCOOTER AND MOTORCYCLE MARKET DYNAMICS
           5.2.1 DRIVERS
                    FIGURE 25 FACTORS DRIVING MARKET
                    5.2.1.1 Low operating and maintenance costs
                               FIGURE 26 COST SAVING COMPARISON: ELECTRIC SCOOTERS VS. PETROL SCOOTERS
                               FIGURE 27 COST DISTANCE RATIO ANALYSIS FOR ITALIAN MARKET
                    5.2.1.2 Government incentives and subsidies
                               FIGURE 28 ELECTRIFICATION TARGET, BY COUNTRY
                               TABLE 9 COUNTRY-WISE GOVERNMENT INCENTIVES AND SUBSIDIES
                    5.2.1.3 Advancements in battery technology
                               FIGURE 29 AVERAGE ENERGY DENSITY (WH/L) OF LI-ION BATTERIES, 2017–2031
                               TABLE 10 ELECTRIC SCOOTERS AND MOTORCYCLES WITH SIGNIFICANT RANGE AND BATTERY TYPE
                    5.2.1.4 Implementation of battery swapping technology
                               FIGURE 30 BATTERY SWAPPING SYSTEM
                    5.2.1.5 Rapid urbanization fueling need for convenient modes of transportation
                               FIGURE 31 SHARE OF URBAN POPULATION WORLDWIDE, BY CONTINENT, 2022
           5.2.2 RESTRAINTS
                    5.2.2.1 Lack of charging infrastructure
                               FIGURE 32 FAST PUBLICLY AVAILABLE CHARGERS, 2017–2022
                    5.2.2.2 Lack of power output and limited range
                               TABLE 11 MODEL-WISE DRIVING RANGE OF ELECTRIC SCOOTERS AND MOTORCYCLES
                    5.2.2.3 Battery heating issues and long charging time
                               TABLE 12 TIME REQUIRED TO CHARGE ELECTRIC SCOOTERS AND MOTORCYCLES
           5.2.3 OPPORTUNITIES
                    FIGURE 33 OPPORTUNITIES FOR ELECTRIC SCOOTER AND MOTORCYCLE MARKET
                    5.2.3.1 Government bodies backing electric two-wheelers
                               TABLE 13 KEY INITIATIVES BY GOVERNMENT BODIES IN EMERGING MARKETS
                    5.2.3.2 Decreasing prices of batteries
                               FIGURE 34 LITHIUM-ION BATTERY PRICE TREND, 2013–2022 (USD/KWH)
                    5.2.3.3 New revenue pockets in Asia Pacific and Europe
                    5.2.3.4 Use of IoT and smart infrastructure in electric two-wheeler charging stations for load management
                               FIGURE 35 SMART IOT-BASED TECHNOLOGY USED IN ELECTRIC TWO-WHEELER CHARGING STATIONS
           5.2.4 CHALLENGES
                    5.2.4.1 Initial investments and high cost of electricity
                               FIGURE 36 AVERAGE TOTAL COST OF CONVENTIONAL VS. ELECTRIC TWO-WHEELERS (2022)
                               TABLE 14 GLOBAL AVERAGE ELECTRICITY COST, 2022
                    5.2.4.2 Lack of compatibility, interchangeability, and standardization
                    5.2.4.3 Technological barriers related to battery development
                               FIGURE 37 TECHNOLOGICAL BARRIERS FOR ELECTRIC TWO-WHEELERS
    5.3 PORTER’S FIVE FORCES 
           FIGURE 38 PORTER’S FIVE FORCES: ELECTRIC SCOOTER AND MOTORCYCLE MARKET
           TABLE 15 MARKET: IMPACT OF PORTER’S FIVE FORCES
           5.3.1 THREAT OF SUBSTITUTES
           5.3.2 INTENSITY OF COMPETITIVE RIVALRY
           5.3.3 BARGAINING POWER OF BUYERS
           5.3.4 THREAT OF NEW ENTRANTS
           5.3.5 BARGAINING POWER OF SUPPLIERS
    5.4 MNM INSIGHTS ON OEM PLANNING AND DEVELOPMENTS 
           TABLE 16 OEM PLANNING AND DEVELOPMENTS
    5.5 PRICING ANALYSIS 
           5.5.1 AVERAGE SELLING PRICE TRENDS, BY VEHICLE TYPE
                    FIGURE 39 AVERAGE SELLING PRICE TRENDS, BY VEHICLE TYPE
           5.5.2 ELECTRIC SCOOTERS: AVERAGE SELLING PRICE, BY KEY PLAYERS
                    TABLE 17 ELECTRIC SCOOTERS: PRICE RANGE ANALYSIS
           5.5.3 ELECTRIC MOTORCYCLES: AVERAGE SELLING PRICE, BY KEY PLAYERS
                    TABLE 18 ELECTRIC MOTORCYCLES: PRICE RANGE ANALYSIS
                    TABLE 19 ELECTRIC SCOOTERS AND MOTORCYCLES: PRICE RANGE ANALYSIS
                    TABLE 20 OEM ELECTRIC VEHICLE MODELS: AVERAGE PRICE
    5.6 ECOSYSTEM ANALYSIS 
           FIGURE 40 ELECTRIC SCOOTER AND MOTORCYCLE MARKET: ECOSYSTEM ANALYSIS
           TABLE 21 MARKET: ROLE OF COMPANIES IN ECOSYSTEM
    5.7 MACROECONOMIC INDICATORS 
           5.7.1 GDP TRENDS AND FORECAST FOR MAJOR ECONOMIES
                    TABLE 22 GDP TRENDS AND FORECAST, BY MAJOR ECONOMIES, 2018–2026 (USD BILLION)
                    TABLE 23 REAL GDP GROWTH RATE (ANNUAL PERCENTAGE CHANGE AND FORECAST), BY MAJOR ECONOMIES, 2022–2026
                    TABLE 24 GDP PER CAPITA TRENDS AND FORECAST, BY MAJOR ECONOMIES, 2018–2026 (USD)
    5.8 VALUE CHAIN ANALYSIS 
           FIGURE 41 VALUE CHAIN ANALYSIS: MARKET
    5.9 CASE STUDY ANALYSIS 
           5.9.1 ATHER ENERGY CASE STUDY
           5.9.2 HERO ELECTRIC CASE STUDY
           5.9.3 GENZE CASE STUDY
           5.9.4 CASE STUDY ON OFFICIAL POSTAL SERVICE OF TAIWAN
    5.10 PATENT ANALYSIS 
           TABLE 25 IMPORTANT PATENT REGISTRATIONS RELATED TO MARKET
           FIGURE 42 GLOBALLY PUBLISHED PATENTS FOR MARKET (2017–2022)
    5.11 TECHNOLOGY ANALYSIS 
           5.11.1 BATTERY SWAPPING IN ELECTRIC SCOOTERS
                    FIGURE 43 TCO OF ICE VS. BATTERY SWAPPING POWERED VEHICLES, 2022
           5.11.2 IOT IN ELECTRIC TWO-WHEELERS
           5.11.3 REGENERATIVE BRAKING
           5.11.4 SHARED MOBILITY
           5.11.5 SOLID-STATE BATTERIES
           5.11.6 SMART CHARGING SYSTEMS
                    FIGURE 44 SMART EV CHARGING SYSTEM
           5.11.7 BATTERY-RELATED SERVICES
    5.12 REGULATORY OVERVIEW 
                    TABLE 26 GLOBAL REGULATORY ENVIRONMENT
                    TABLE 27 CENTRAL AND STATE TAXES AND FEES IN INDIA FOR VEHICLES SELECTED
           5.12.1 COUNTRY-WISE TARIFF AND REGULATORY OVERVIEW
                    5.12.1.1 India
                    5.12.1.2 Indonesia
                    5.12.1.3 China
                    5.12.1.4 France
                    5.12.1.5 Germany
                    5.12.1.6 Spain
                    5.12.1.7 Austria
                    5.12.1.8 US
           5.12.2 LIST OF REGULATORY BODIES, GOVERNMENT AGENCIES, AND OTHER ORGANIZATIONS
                    TABLE 28 NORTH AMERICA: LIST OF REGULATORY BODIES, GOVERNMENT AGENCIES, AND OTHER ORGANIZATIONS
                    TABLE 29 EUROPE: LIST OF REGULATORY BODIES, GOVERNMENT AGENCIES, AND OTHER ORGANIZATIONS
                    TABLE 30 ASIA PACIFIC: LIST OF REGULATORY BODIES, GOVERNMENT AGENCIES, AND OTHER ORGANIZATIONS
    5.13 KEY CONFERENCES AND EVENTS IN 2022–2023 
                    TABLE 31 ELECTRIC SCOOTER AND MOTORCYCLE MARKET: DETAILED LIST OF CONFERENCES AND EVENTS
    5.14 KEY STAKEHOLDERS AND BUYING CRITERIA 
           5.14.1 KEY STAKEHOLDERS IN BUYING PROCESS
                    FIGURE 45 INFLUENCE OF STAKEHOLDERS ON BUYING PROCESS
                    TABLE 32 INFLUENCE OF STAKEHOLDERS ON BUYING PROCESS (%)
           5.14.2 BUYING CRITERIA
                    5.14.2.1 Food delivery
                    5.14.2.2 Postal services
                    5.14.2.3 Municipal services
                               FIGURE 46 KEY BUYING CRITERIA
                               TABLE 33 KEY BUYING CRITERIA
    5.15 TRENDS AND DISRUPTIONS 
                    FIGURE 47 TRENDS AND DISRUPTIONS
                    TABLE 34 IMPLICATIONS OF FUTURE HOTBEDS IN MARKET
    5.16 RECESSION IMPACT ANALYSIS 
                    TABLE 35 ELECTRIC SCOOTER AND MOTORCYCLE SALES, BY KEY COUNTRIES, 2021–2022
    5.17 SCENARIO ANALYSIS 
           5.17.1 MOST LIKELY SCENARIO
                    TABLE 36 MOST LIKELY SCENARIO: MARKET, BY REGION, 2023–2028 (USD MILLION)
           5.17.2 OPTIMISTIC SCENARIO
                    TABLE 37 OPTIMISTIC SCENARIO: MARKET, BY REGION, 2023–2028 (USD MILLION)
           5.17.3 PESSIMISTIC SCENARIO
                    TABLE 38 PESSIMISTIC SCENARIO: MARKET, BY REGION, 2023–2028 (THOUSAND UNITS)
 
6 ELECTRIC SCOOTER AND MOTORCYCLE MARKET, BY BATTERY TYPE (Page No. - 137)
    6.1 INTRODUCTION 
           FIGURE 48 LITHIUM-ION BATTERY VS. LEAD-ACID BATTERY
           FIGURE 49 LITHIUM-ION BATTERY SEGMENT PROJECTED TO GROW AT HIGHER CAGR DURING FORECAST PERIOD
           TABLE 39 MARKET, BY BATTERY TYPE, 2018–2022 (THOUSAND UNITS)
           TABLE 40 MARKET, BY BATTERY TYPE, 2023–2028 (THOUSAND UNITS)
           TABLE 41 MARKET, BY BATTERY TYPE, 2018–2022 (USD MILLION)
           TABLE 42 MARKET, BY BATTERY TYPE, 2023–2028 (USD MILLION)
           TABLE 43 ADVANTAGES AND DISADVANTAGES OF LEAD-ACID BATTERIES
           TABLE 44 ADVANTAGES AND DISADVANTAGES OF LITHIUM-ION BATTERIES
    6.2 SEALED LEAD-ACID 
           6.2.1 LOW COST OF LEAD-ACID BATTERIES TO DRIVE MARKET
                    TABLE 45 SEALED LEAD-ACID BATTERY: MARKET, BY REGION, 2018–2022 (THOUSAND UNITS)
                    TABLE 46 SEALED LEAD-ACID BATTERY: MARKET, BY REGION, 2023–2028 (THOUSAND UNITS)
                    TABLE 47 SEALED LEAD-ACID BATTERY: MARKET, BY REGION, 2018–2022 (USD MILLION)
                    TABLE 48 SEALED LEAD-ACID BATTERY: MARKET, BY REGION, 2023–2028 (USD MILLION)
    6.3 LITHIUM-ION 
           6.3.1 ASIA PACIFIC TO LEAD LITHIUM-ION BATTERY SEGMENT DUE TO GROWING USAGE OF MODERN ELECTRIC TWO-WHEELERS
                    FIGURE 50 CHEMISTRIES OF CATHODES
                    FIGURE 51 LITHIUM-ION BATTERY CELL PRODUCTION CAPACITY, BY REGION, 2022
                    TABLE 49 LITHIUM-ION BATTERY: MARKET, BY REGION, 2018–2022 (THOUSAND UNITS)
                    TABLE 50 LITHIUM-ION BATTERY: MARKET, BY REGION, 2023–2028 (THOUSAND UNITS)
                    TABLE 51 LITHIUM-ION BATTERY: MARKET, BY REGION, 2018–2022 (USD MILLION)
                    TABLE 52 LITHIUM-ION BATTERY: MARKET, BY REGION, 2023–2028 (USD MILLION)
    6.4 NICKEL METAL HYDRIDE BATTERY 
    6.5 SODIUM-ION BATTERY 
    6.6 KEY PRIMARY INSIGHTS 
 
7 ELECTRIC SCOOTER AND MOTORCYCLE MARKET, BY DISTANCE COVERED (Page No. - 148)
    7.1 INTRODUCTION 
           FIGURE 52 KEY MANUFACTURERS AND THEIR VEHICLE MODELS WITH RANGE
           FIGURE 53 75–100 MILES SEGMENT TO REGISTER HIGHEST CAGR DURING FORECAST PERIOD
           TABLE 53 MARKET, BY DISTANCE COVERED, 2018–2022 (THOUSAND UNITS)
           TABLE 54 MARKET, BY DISTANCE COVERED, 2023–2028 (THOUSAND UNITS)
           TABLE 55 MARKET, BY DISTANCE COVERED, 2018–2022 (USD MILLION)
           TABLE 56 MARKET, BY DISTANCE COVERED, 2023–2028 (USD MILLION)
    7.2 BELOW 75 MILES 
           7.2.1 ASIA PACIFIC TO HOLD MAJOR MARKET SHARE IN BELOW 75 MILES SEGMENT
                    TABLE 57 BELOW 75 MILES: MARKET, BY REGION, 2018–2022 (THOUSAND UNITS)
                    TABLE 58 BELOW 75 MILES: MARKET, BY REGION, 2023–2028 (THOUSAND UNITS)
                    TABLE 59 BELOW 75 MILES: MARKET, BY REGION, 2018–2022 (USD MILLION)
                    TABLE 60 BELOW 75 MILES: MARKET, BY REGION, 2023–2028 (USD MILLION)
    7.3 75–100 MILES 
           7.3.1 IMPROVING BATTERY TECHNOLOGIES TO DRIVE DEMAND FOR 75–100 MILES RANGE ELECTRIC TWO-WHEELERS
                    TABLE 61 75–100 MILES: MARKET, BY REGION, 2018–2022 (THOUSAND UNITS)
                    TABLE 62 75–100 MILES: MARKET, BY REGION, 2023–2028 (THOUSAND UNITS)
                    TABLE 63 75–100 MILES: MARKET, BY REGION, 2018–2022 (USD MILLION)
                    TABLE 64 75–100 MILES: MARKET, BY REGION, 2023–2028 (USD MILLION)
    7.4 ABOVE 100 MILES 
           7.4.1 DEVELOPMENTS IN BATTERY TECHNOLOGY TO BOOST DEMAND FOR HIGH-RANGE ELECTRIC SCOOTERS AND MOTORCYCLES
                    TABLE 65 ABOVE 100 MILES: MARKET, BY REGION, 2018–2022 (THOUSAND UNITS)
                    TABLE 66 ABOVE 100 MILES: MARKET, BY REGION, 2023–2028 (THOUSAND UNITS)
                    TABLE 67 ABOVE 100 MILES: MARKET, BY REGION, 2018–2022 (USD MILLION)
                    TABLE 68 ABOVE 100 MILES: MARKET, BY REGION, 2023–2028 (USD MILLION)
    7.5 KEY PRIMARY INSIGHTS 
 
8 ELECTRIC SCOOTER AND MOTORCYCLE MARKET, BY VOLTAGE TYPE (Page No. - 159)
    8.1 INTRODUCTION 
           FIGURE 54 ELECTRIC SCOOTERS AND MOTORCYCLES OFFERED BY OEMS, BY VOLTAGE TYPE
           FIGURE 55 60 V SEGMENT TO HOLD LARGEST MARKET SHARE DURING FORECAST PERIOD
           TABLE 69 MARKET, BY VOLTAGE TYPE, 2018–2022 (THOUSAND UNITS)
           TABLE 70 MARKET, BY VOLTAGE TYPE, 2023–2028 (THOUSAND UNITS)
           TABLE 71 MARKET, BY VOLTAGE TYPE, 2018–2022 (USD MILLION)
           TABLE 72 MARKET, BY VOLTAGE TYPE, 2023–2028 (USD MILLION)
    8.2 36 V 
           8.2.1 RISING DEMAND FOR DAILY SHORT-DISTANCE TRAVEL TO DRIVE SEGMENT
                    TABLE 73 36 V: MARKET, BY REGION, 2018–2022 (THOUSAND UNITS)
                    TABLE 74 36 V: MARKET, BY REGION, 2023–2028 (THOUSAND UNITS)
                    TABLE 75 36 V: MARKET, BY REGION, 2018–2022 (USD MILLION)
                    TABLE 76 36 V: MARKET, BY REGION, 2023–2028 (USD MILLION)
    8.3 48 V 
           8.3.1 RISING DEMAND FOR 48 V-POWERED ELECTRIC SCOOTERS AND MOTORCYCLES FOR SHORT MOBILITY PURPOSES
                    TABLE 77 48 V: MARKET, BY REGION, 2018–2022 (THOUSAND UNITS)
                    TABLE 78 48 V: MARKET, BY REGION, 2023–2028 (THOUSAND UNITS)
                    TABLE 79 48 V: MARKET, BY REGION, 2018–2022 (USD MILLION)
                    TABLE 80 48 V: MARKET, BY REGION, 2023–2028 (USD MILLION)
    8.4 60 V 
           8.4.1 GROWING NEED FOR HIGH-PERFORMANCE ELECTRIC TWO-WHEELERS TO DRIVE SEGMENT
                    TABLE 81 60 V: MARKET, BY REGION, 2018–2022 (THOUSAND UNITS)
                    TABLE 82 60 V: MARKET, BY REGION, 2023–2028 (THOUSAND UNITS)
                    TABLE 83 60 V: MARKET, BY REGION, 2018–2022 (USD MILLION)
                    TABLE 84 60 V: MARKET, BY REGION, 2023–2028 (USD MILLION)
    8.5 72 V 
           8.5.1 ADVANCEMENTS IN BATTERY TECHNOLOGY AND GROWING DEMAND FOR HIGH-PERFORMANCE TWO-WHEELERS TO DRIVE MARKET
                    TABLE 85 72 V: MARKET, BY REGION, 2018–2022 (THOUSAND UNITS)
                    TABLE 86 72 V: MARKET, BY REGION, 2023–2028 (THOUSAND UNITS)
                    TABLE 87 72 V: MARKET, BY REGION, 2018–2022 (USD MILLION)
                    TABLE 88 72 V: MARKET, BY REGION, 2023–2028 (USD MILLION)
    8.6 ABOVE 72 V 
           8.6.1 ADVANCEMENTS IN BATTERY TECHNOLOGY FOR HIGH-PERFORMANCE MOTORCYCLES TO DRIVE SEGMENT
                    TABLE 89 ABOVE 72 V: MARKET, BY REGION, 2018–2022 (THOUSAND UNITS)
                    TABLE 90 ABOVE 72 V: MARKET, BY REGION, 2023–2028 (THOUSAND UNITS)
                    TABLE 91 ABOVE 72 V: MARKET, BY REGION, 2018–2022 (USD MILLION)
                    TABLE 92 ABOVE 72 V: MARKET, BY REGION, 2023–2028 (USD MILLION)
    8.7 KEY PRIMARY INSIGHTS 
 
9 ELECTRIC SCOOTER AND MOTORCYCLE MARKET, BY TECHNOLOGY TYPE (Page No. - 172)
    9.1 INTRODUCTION 
           FIGURE 56 PLUG-IN SEGMENT TO HOLD LARGER MARKET SHARE THAN BATTERY SEGMENT DURING FORECAST PERIOD
           TABLE 93 MARKET, BY TECHNOLOGY TYPE, 2018–2022 (THOUSAND UNITS)
           TABLE 94 MARKET, BY TECHNOLOGY TYPE, 2023–2028 (THOUSAND UNITS)
           TABLE 95 MARKET, BY TECHNOLOGY TYPE, 2018–2022 (USD MILLION)
           TABLE 96 MARKET, BY TECHNOLOGY TYPE, 2023–2028 (USD MILLION)
    9.2 PLUG-IN 
           9.2.1 INCREASING PUBLIC FAST-CHARGING STATIONS FOR ELECTRIC TWO-WHEELERS TO DRIVE SEGMENT
                    TABLE 97 PLUG-IN: MARKET, BY REGION, 2018–2022 (THOUSAND UNITS)
                    TABLE 98 PLUG-IN: MARKET, BY REGION, 2023–2028 (THOUSAND UNITS)
                    TABLE 99 PLUG-IN: MARKET, BY REGION, 2018–2022 (USD MILLION)
                    TABLE 100 PLUG-IN: MARKET, BY REGION, 2023–2028 (USD MILLION)
    9.3 BATTERY 
           9.3.1 INITIAL COST-BENEFIT ON PURCHASE OF BATTERY SWAPPING SCOOTERS AND MOTORCYCLES TO DRIVE MARKET
                    FIGURE 57 BATTERY-POWERED ELECTRIC SCOOTER AND MOTORCYCLE BUSINESS MODEL
                    TABLE 101 BATTERY: MARKET, BY REGION, 2018–2022 (THOUSAND UNITS)
                    TABLE 102 BATTERY: MARKET, BY REGION, 2023–2028 (THOUSAND UNITS)
                    TABLE 103 BATTERY: MARKET, BY REGION, 2018–2022 (USD MILLION)
                    TABLE 104 BATTERY: MARKET, BY REGION, 2023–2028 (USD MILLION))
    9.4 KEY PRIMARY INSIGHTS 
 
10 ELECTRIC SCOOTER AND MOTORCYCLE MARKET, BY VEHICLE CLASS (Page No. - 181)
     10.1 INTRODUCTION 
               FIGURE 58 LUXURY SEGMENT TO REGISTER HIGHER CAGR THAN ECONOMY SEGMENT FROM 2023 TO 2028
               TABLE 105 MARKET, BY VEHICLE CLASS, 2018–2022 (THOUSAND UNITS)
               TABLE 106 MARKET, BY VEHICLE CLASS, 2023–2028 (THOUSAND UNITS)
               TABLE 107 MARKET, BY VEHICLE CLASS, 2018–2022 (USD MILLION)
               TABLE 108 MARKET, BY VEHICLE CLASS, 2023–2028 (USD MILLION)
     10.2 ECONOMY 
             10.2.1 INCREASED SALES OF ELECTRIC SCOOTERS IN ASIA PACIFIC TO DRIVE SEGMENT
                       TABLE 109 ECONOMY: MARKET, BY REGION, 2018–2022 (THOUSAND UNITS)
                       TABLE 110 ECONOMY: MARKET, BY REGION, 2023–2028 (THOUSAND UNITS)
                       TABLE 111 ECONOMY: MARKET, BY REGION, 2018–2022 (USD MILLION)
                       TABLE 112 ECONOMY: MARKET, BY REGION, 2023–2028 (USD MILLION))
     10.3 LUXURY 
             10.3.1 RISING ADOPTION OF LUXURY-CLASS ELECTRIC TWO-WHEELERS TO DRIVE SEGMENT
                       TABLE 113 LUXURY: MARKET, BY REGION, 2018–2022 (THOUSAND UNITS)
                       TABLE 114 LUXURY: MARKET, BY REGION, 2023–2028 (THOUSAND UNITS)
                       TABLE 115 LUXURY: MARKET, BY REGION, 2018–2022 (USD MILLION)
                       TABLE 116 LUXURY: MARKET, BY REGION, 2023–2028 (USD MILLION)
     10.4 KEY PRIMARY INSIGHTS 
 
11 ELECTRIC SCOOTER AND MOTORCYCLE MARKET, BY VEHICLE TYPE (Page No. - 188)
     11.1 INTRODUCTION 
               FIGURE 59 TECHNICAL SPECIFICATIONS FOR CONVENTIONAL AND BATTERY ELECTRIC TWO-WHEELERS IN 2022
               FIGURE 60 E-MOTORCYCLES SEGMENT TO REGISTER HIGHER CAGR THAN E-SCOOTERS/MOPEDS DURING FORECAST PERIOD
               TABLE 117 MARKET, BY VEHICLE TYPE, 2018–2022 (THOUSAND UNITS)
               TABLE 118 MARKET, BY VEHICLE TYPE, 2023–2028 (THOUSAND UNITS)
               TABLE 119 MARKET, BY VEHICLE TYPE, 2018–2022 (USD MILLION)
               TABLE 120 MARKET, BY VEHICLE TYPE, 2023–2028 (USD MILLION)
               TABLE 121 KEY OEMS AND THEIR PRODUCTION CAPACITY IN INDIA
     11.2 E-SCOOTERS/MOPEDS 
             11.2.1 GROWING GOVERNMENT INITIATIVES TO ENHANCE E-MOBILITY
                       TABLE 122 E-SCOOTERS/MOPEDS MARKET, BY REGION, 2018–2022 (THOUSAND UNITS)
                       TABLE 123 E-SCOOTERS/MOPEDS MARKET, BY REGION, 2023–2028 (THOUSAND UNITS)
                       TABLE 124 E-SCOOTERS/MOPEDS MARKET, BY REGION, 2018–2022 (USD MILLION)
                       TABLE 125 E-SCOOTERS/MOPEDS MARKET, BY REGION, 2023–2028 (USD MILLION))
     11.3 E-MOTORCYCLES 
             11.3.1 RISING DEMAND FOR HIGH-PERFORMANCE ELECTRIC MOTORCYCLES TO DRIVE MARKET
                       TABLE 126 E-MOTORCYCLES MARKET, BY REGION, 2018–2022 (THOUSAND UNITS)
                       TABLE 127 E-MOTORCYCLES MARKET, BY REGION, 2023–2028 (THOUSAND UNITS)
                       TABLE 128 E-MOTORCYCLES MARKET, BY REGION, 2018–2022 (USD MILLION)
                       TABLE 129 E-MOTORCYCLES MARKET, BY REGION, 2023–2028 (USD MILLION))
     11.4 KEY PRIMARY INSIGHTS 
 
12 ELECTRIC SCOOTER AND MOTORCYCLE MARKET, BY USAGE (Page No. - 199)
     12.1 INTRODUCTION 
               FIGURE 61 ELECTRIC TWO-WHEELER USER CATEGORIES AND CHARGING INFRASTRUCTURE
               FIGURE 62 PRIVATE SEGMENT TO REGISTER HIGHER CAGR THAN COMMERCIAL SEGMENT DURING FORECAST PERIOD
               TABLE 130 MARKET, BY USAGE, 2018–2022 (THOUSAND UNITS)
               TABLE 131 MARKET, BY USAGE, 2023–2028 (THOUSAND UNITS)
               TABLE 132 MARKET, BY USAGE, 2018–2022 (USD MILLION)
               TABLE 133 MARKET, BY USAGE, 2023–2028 (USD MILLION)
     12.2 PRIVATE 
             12.2.1 VARIED RANGE OF PRODUCTS CLUBBED WITH GOVERNMENT INCENTIVES AND REDUCING PRICES TO DRIVE SEGMENT
                       TABLE 134 PRIVATE: MARKET, BY REGION, 2018–2022 (THOUSAND UNITS)
                       TABLE 135 PRIVATE: MARKET, BY REGION, 2023–2028 (THOUSAND UNITS)
                       TABLE 136 PRIVATE: MARKET, BY REGION, 2018–2022 (USD MILLION)
                       TABLE 137 PRIVATE: MARKET, BY REGION, 2023–2028 (USD MILLION))
     12.3 COMMERCIAL USE 
             12.3.1 HIGH INITIAL COST OF OWNERSHIP AND LOW OPERATIONAL AND MAINTENANCE COSTS TO DRIVE SEGMENT
                       TABLE 138 COMMERCIAL: MARKET, BY REGION, 2018–2022 (THOUSAND UNITS)
                       TABLE 139 COMMERCIAL: MARKET, BY REGION, 2023–2028 (THOUSAND UNITS)
                       TABLE 140 COMMERCIAL: MARKET, BY REGION, 2018–2022 (USD MILLION)
                       TABLE 141 COMMERCIAL: MARKET, BY REGION, 2023–2028 (USD MILLION))
     12.4 KEY PRIMARY INSIGHTS 
 
13 ELECTRIC SCOOTER AND MOTORCYCLE MARKET, BY REGION (Page No. - 207)
     13.1 INTRODUCTION 
               FIGURE 63 MARKET, BY REGION, 2023 VS. 2028
               TABLE 142 MARKET, BY REGION, 2018–2022 (THOUSAND UNITS)
               TABLE 143 MARKET, BY REGION, 2023–2028 (THOUSAND UNITS)
               TABLE 144 MARKET, BY REGION, 2018–2022 (USD MILLION)
               TABLE 145 MARKET, BY REGION, 2023–2028 (USD MILLION)
     13.2 ASIA PACIFIC 
             13.2.1 ASIA PACIFIC: RECESSION IMPACT
                       FIGURE 64 ASIA PACIFIC: MARKET SNAPSHOT
                       TABLE 146 ASIA PACIFIC: MARKET, BY COUNTRY, 2018–2022 (THOUSAND UNITS)
                       TABLE 147 ASIA PACIFIC: MARKET, BY COUNTRY, 2023–2028 (THOUSAND UNITS)
                       TABLE 148 ASIA PACIFIC: MARKET, BY COUNTRY, 2018–2022 (USD MILLION)
                       TABLE 149 ASIA PACIFIC: MARKET, BY COUNTRY, 2023–2028 (USD MILLION)
             13.2.2 CHINA
                       13.2.2.1 China to be largest market for e-scooters/mopeds globally
                                   FIGURE 65 MARKET GROWTH OF ELECTRIC MOTORCYCLES AND SCOOTERS IN CHINA, 2015–2024
                                   TABLE 150 CHINA: MARKET, BY VEHICLE TYPE, 2018–2022 (UNITS)
                                   TABLE 151 CHINA: MARKET, BY VEHICLE TYPE, 2023–2028 (UNITS)
                                   TABLE 152 CHINA: MARKET, BY VEHICLE TYPE, 2018–2022 (USD MILLION)
                                   TABLE 153 CHINA: MARKET, BY VEHICLE TYPE, 2023–2028 (USD MILLION)
             13.2.3 JAPAN
                       13.2.3.1 Renowned manufacturers to develop advanced electric two-wheelers in Japan
                                   TABLE 154 ELECTRIC TWO-WHEELER IMPORT DATA OF JAPAN
                                   TABLE 155 JAPAN: MARKET, BY VEHICLE TYPE, 2018–2022 (UNITS)
                                   TABLE 156 JAPAN: MARKET, BY VEHICLE TYPE, 2023–2028 (UNITS)
                                   TABLE 157 JAPAN: MARKET, BY VEHICLE TYPE, 2018–2022 (USD MILLION)
                                   TABLE 158 JAPAN: MARKET, BY VEHICLE TYPE, 2023–2028 (USD MILLION)
             13.2.4 INDIA
                       13.2.4.1 Shift of focus from ICE two-wheelers to electric two-wheelers to reduce pollution
                                   TABLE 159 KEY PLANNED INVESTMENTS IN INDIA BATTERY MANUFACTURING SPACE, 2022
                                   FIGURE 66 INDIA: ANNUAL ELECTRIC TWO-WHEELER SALES PROJECTION, 2018–2025
                                   TABLE 160 INDIA: MARKET, BY VEHICLE TYPE, 2018–2022 (UNITS)
                                   TABLE 161 INDIA: MARKET, BY VEHICLE TYPE, 2023–2028 (UNITS)
                                   TABLE 162 INDIA: MARKET, BY VEHICLE TYPE, 2018–2022 (USD MILLION)
                                   TABLE 163 INDIA: MARKET, BY VEHICLE TYPE, 2023–2028 (USD MILLION)
             13.2.5 SOUTH KOREA
                       13.2.5.1 South Korean automotive industry to develop electric two-wheelers
                                   TABLE 164 SOUTH KOREA: MARKET, BY VEHICLE TYPE, 2018–2022 (UNITS)
                                   TABLE 165 SOUTH KOREA: MARKET, BY VEHICLE TYPE, 2023–2028 (UNITS)
                                   TABLE 166 SOUTH KOREA: MARKET, BY VEHICLE TYPE, 2018–2022 (USD MILLION)
                                   TABLE 167 SOUTH KOREA: MARKET, BY VEHICLE TYPE, 2023–2028 (USD MILLION)
             13.2.6 TAIWAN
                       13.2.6.1 Expanding charging solution networks in Taiwan to boost market
                                   FIGURE 67 TAIWAN: E-SCOOTER MARKET SHARE, 2022
                                   FIGURE 68 TAIWAN: BATTERY SWAPPING NETWORK, BY GOGORO, 2022
                                   FIGURE 69 TAIWAN: ELECTRIC SCOOTER REGISTRATIONS, BY BRAND, 2022
                                   TABLE 168 TAIWAN: MARKET, BY VEHICLE TYPE, 2018–2022 (UNITS)
                                   TABLE 169 TAIWAN: MARKET, BY VEHICLE TYPE, 2023–2028 (UNITS)
                                   TABLE 170 TAIWAN: MARKET, BY VEHICLE TYPE, 2018–2022 (USD MILLION)
                                   TABLE 171 TAIWAN: MARKET, BY VEHICLE TYPE, 2023–2028 (USD MILLION)
             13.2.7 THAILAND
                       13.2.7.1 Need to curb emissions to create more opportunities for electric two-wheelers
                                   TABLE 172 THAILAND: MARKET, BY VEHICLE TYPE, 2018–2022 (UNITS)
                                   TABLE 173 THAILAND: MARKET, BY VEHICLE TYPE, 2023–2028 (UNITS)
                                   TABLE 174 THAILAND: MARKET, BY VEHICLE TYPE, 2018–2022 (USD MILLION)
                                   TABLE 175 THAILAND: MARKET, BY VEHICLE TYPE, 2023–2028 (USD MILLION)
             13.2.8 INDONESIA
                       13.2.8.1 Government initiatives and strong local demand to boost market
                                   FIGURE 70 INDONESIA: EXISTING POLICIES FOR ELECTRIC TWO-WHEELERS
                                   TABLE 176 INDONESIA: OEM SALES (UNITS), 2022
                                   TABLE 177 ELECTRIC TWO/THREE-WHEELERS AVAILABLE FOR SALE IN INDONESIAN MARKET
                                   TABLE 178 INDONESIA: MARKET, BY VEHICLE TYPE, 2018–2022 (UNITS)
                                   TABLE 179 INDONESIA: MARKET, BY VEHICLE TYPE, 2023–2028 (UNITS)
                                   TABLE 180 INDONESIA: MARKET, BY VEHICLE TYPE, 2018–2022 (USD MILLION)
                                   TABLE 181 INDONESIA: MARKET, BY VEHICLE TYPE, 2023–2028 (USD MILLION)
             13.2.9 MALAYSIA
                       13.2.9.1 Increasing technological development and emergence of electric mobility-as-a-service to drive market
                                   TABLE 182 MALAYSIA: MARKET, BY VEHICLE TYPE, 2018–2022 (UNITS)
                                   TABLE 183 MALAYSIA: MARKET, BY VEHICLE TYPE, 2023–2028 (UNITS)
                                   TABLE 184 MALAYSIA: MARKET, BY VEHICLE TYPE, 2018–2022 (USD MILLION)
                                   TABLE 185 MALAYSIA: MARKET, BY VEHICLE TYPE, 2023–2028 (USD MILLION)
             13.2.10 PHILIPPINES
                       13.2.10.1 Increasing industrialization to drive market
                                   TABLE 186 PHILIPPINES: ELECTRIC SCOOTER AND MOTORCYCLE PRICES
                                   TABLE 187 PHILIPPINES: MARKET, BY VEHICLE TYPE, 2018–2022 (UNITS)
                                   TABLE 188 PHILIPPINES: MARKET, BY VEHICLE TYPE, 2023–2028 (UNITS)
                                   TABLE 189 PHILIPPINES: MARKET, BY VEHICLE TYPE, 2018–2022 (USD MILLION)
                                   TABLE 190 PHILIPPINES: MARKET, BY VEHICLE TYPE, 2023–2028 (USD MILLION)
             13.2.11 VIETNAM
                       13.2.11.1 Focus on reducing GHG emissions to drive market
                                   TABLE 191 VIETNAM: ELECTRIC SCOOTER AND MOTORCYCLE PRICES
                                   TABLE 192 VIETNAM: MARKET, BY VEHICLE TYPE, 2018–2022 (UNITS)
                                   TABLE 193 VIETNAM: MARKET, BY VEHICLE TYPE, 2023–2028 (UNITS)
                                   TABLE 194 VIETNAM: MARKET, BY VEHICLE TYPE, 2018–2022 (USD MILLION)
                                   TABLE 195 VIETNAM: MARKET, BY VEHICLE TYPE, 2023–2028 (USD MILLION)
     13.3 EUROPE 
             13.3.1 EUROPE: RECESSION IMPACT
                       FIGURE 71 EUROPE: MARKET, BY COUNTRY, 2023 VS. 2028 (USD MILLION)
                       TABLE 196 EUROPE: MARKET, BY COUNTRY, 2018–2022 (THOUSAND UNITS)
                       TABLE 197 EUROPE: MARKET, BY COUNTRY, 2023–2028 (THOUSAND UNITS)
                       TABLE 198 EUROPE: MARKET, BY COUNTRY, 2018–2022 (USD MILLION)
                       TABLE 199 EUROPE: MARKET, BY COUNTRY, 2023–2028 (USD MILLION)
             13.3.2 FRANCE
                       13.3.2.1 Purchase grants by French government to boost demand
                                   TABLE 200 FRANCE: EV CHARGING INFRASTRUCTURE TARGETS
                                   TABLE 201 FRANCE: MARKET, BY VEHICLE TYPE, 2018–2022 (UNITS)
                                   TABLE 202 FRANCE: MARKET, BY VEHICLE TYPE, 2023–2028 (UNITS)
                                   TABLE 203 FRANCE: MARKET, BY VEHICLE TYPE, 2018–2022 (USD MILLION)
                                   TABLE 204 FRANCE: MARKET, BY VEHICLE TYPE, 2023–2028 (USD MILLION)
             13.3.3 GERMANY
                       13.3.3.1 Leading players from Germany to enter electric two-wheeler segment
                                   FIGURE 72 GERMANY: SCOOTER-SHARING PROVIDERS
                                   TABLE 205 GERMANY: MARKET, BY VEHICLE TYPE, 2018–2022 (UNITS)
                                   TABLE 206 GERMANY: MARKET, BY VEHICLE TYPE, 2023–2028 (UNITS)
                                   TABLE 207 GERMANY: MARKET, BY VEHICLE TYPE, 2018–2022 (USD MILLION)
                                   TABLE 208 GERMANY: MARKET, BY VEHICLE TYPE, 2023–2028 (USD MILLION)
             13.3.4 SPAIN
                       13.3.4.1 Increasing government investments in charging infrastructure to fuel market
                                   FIGURE 73 SPAIN: EV FLEET BY 2030
                                   TABLE 209 SPAIN: MARKET, BY VEHICLE TYPE, 2018–2022 (UNITS)
                                   TABLE 210 SPAIN: MARKET, BY VEHICLE TYPE, 2023–2028 (UNITS)
                                   TABLE 211 SPAIN: MARKET, BY VEHICLE TYPE, 2018–2022 (USD MILLION)
                                   TABLE 212 SPAIN: MARKET, BY VEHICLE TYPE, 2023–2028 (USD MILLION)
             13.3.5 AUSTRIA
                       13.3.5.1 Development of performance e-motorcycles to drive market
                                   TABLE 213 AUSTRIA: MARKET, BY VEHICLE TYPE, 2018–2022 (UNITS)
                                   TABLE 214 AUSTRIA: MARKET, BY VEHICLE TYPE, 2023–2028 (UNITS)
                                   TABLE 215 AUSTRIA: MARKET, BY VEHICLE TYPE, 2018–2022 (USD MILLION)
                                   TABLE 216 AUSTRIA: MARKET, BY VEHICLE TYPE, 2023–2028 (USD MILLION)
             13.3.6 UK
                       13.3.6.1 Investments in ultra-low emission vehicles to drive market
                                   TABLE 217 UK: MARKET, BY VEHICLE TYPE, 2018–2022 (UNITS)
                                   TABLE 218 UK: MARKET, BY VEHICLE TYPE, 2023–2028 (UNITS)
                                   TABLE 219 UK: MARKET, BY VEHICLE TYPE, 2018–2022 (USD MILLION)
                                   TABLE 220 UK: MARKET, BY VEHICLE TYPE, 2023–2028 (USD MILLION)
             13.3.7 ITALY
                       13.3.7.1 Superior performance of e-scooters and e-motorcycles to drive market
                                   TABLE 221 ITALY: MARKET, BY VEHICLE TYPE, 2018–2022 (UNITS)
                                   TABLE 222 ITALY: MARKET, BY VEHICLE TYPE, 2023–2028 (UNITS)
                                   TABLE 223 ITALY: MARKET, BY VEHICLE TYPE, 2018–2022 (USD MILLION)
                                   TABLE 224 ITALY: MARKET, BY VEHICLE TYPE, 2023–2028 (USD MILLION)
             13.3.8 BELGIUM
                       13.3.8.1 Development of advanced charging infrastructure by Belgian government to promote electric two-wheelers
                                   TABLE 225 BELGIUM: MARKET, BY VEHICLE TYPE, 2018–2022 (UNITS)
                                   TABLE 226 BELGIUM: MARKET, BY VEHICLE TYPE, 2023–2028 (UNITS)
                                   TABLE 227 BELGIUM: MARKET, BY VEHICLE TYPE, 2018–2022 (USD MILLION)
                                   TABLE 228 BELGIUM: MARKET, BY VEHICLE TYPE, 2023–2028 (USD MILLION)
             13.3.9 NETHERLANDS
                       13.3.9.1 Plan to phase out conventional ICE two-wheelers to drive market
                                   TABLE 229 NETHERLAND: ELECTRIC SCOOTER IMPORT DATA (2022)
                                   TABLE 230 NETHERLANDS: MARKET, BY VEHICLE TYPE, 2018–2022 (UNITS)
                                   TABLE 231 NETHERLANDS: MARKET, BY VEHICLE TYPE, 2023–2028 (UNITS)
                                   TABLE 232 NETHERLANDS: MARKET, BY VEHICLE TYPE, 2018–2022 (USD MILLION)
                                   TABLE 233 NETHERLANDS: MARKET, BY VEHICLE TYPE, 2023–2028 (USD MILLION)
             13.3.10 POLAND
                       13.3.10.1 Green commuting to raise market demand
                                   FIGURE 74 POLAND: MARKET SHARE OF ELECTRIC SCOOTER SERVICE PROVIDERS (2022)
                                   TABLE 234 POLAND: MARKET, BY VEHICLE TYPE, 2018–2022 (UNITS)
                                   TABLE 235 POLAND: MARKET, BY VEHICLE TYPE, 2023–2028 (UNITS)
                                   TABLE 236 POLAND: MARKET, BY VEHICLE TYPE, 2018–2022 (USD MILLION)
                                   TABLE 237 POLAND: MARKET, BY VEHICLE TYPE, 2023–2028 (USD MILLION)
             13.3.11 DENMARK
                       13.3.11.1 Government promotion of private infrastructure to positively affect market
                                   TABLE 238 DENMARK: TOP CITIES WITH EV CHARGING STATIONS (2022)
                                   TABLE 239 DENMARK: MARKET, BY VEHICLE TYPE, 2018–2022 (UNITS)
                                   TABLE 240 DENMARK: MARKET, BY VEHICLE TYPE, 2023–2028 (UNITS)
                                   TABLE 241 DENMARK: MARKET, BY VEHICLE TYPE, 2018–2022 (USD MILLION)
                                   TABLE 242 DENMARK: MARKET, BY VEHICLE TYPE, 2023–2028 (USD MILLION)
     13.4 NORTH AMERICA 
             13.4.1 NORTH AMERICA: RECESSION IMPACT
                       FIGURE 75 NORTH AMERICA: MARKET SNAPSHOT
                       TABLE 243 NORTH AMERICA: MARKET, BY COUNTRY, 2018–2022 (THOUSAND UNITS)
                       TABLE 244 NORTH AMERICA: MARKET, BY COUNTRY, 2023–2028 (THOUSAND UNITS)
                       TABLE 245 NORTH AMERICA: MARKET, BY COUNTRY, 2018–2022 (USD MILLION)
                       TABLE 246 NORTH AMERICA: MARKET, BY COUNTRY, 2023–2028 (USD MILLION)
             13.4.2 US
                       13.4.2.1 Government initiatives to control increasing pollution to push market demand
                                   TABLE 247 US: POPULAR ELECTRIC TWO-WHEELER OEMS, BY AVERAGE PRICE RANGE
                                   TABLE 248 US: MARKET, BY VEHICLE TYPE, 2018–2022 (UNITS)
                                   TABLE 249 US: MARKET, BY VEHICLE TYPE, 2023–2028 (UNITS)
                                   TABLE 250 US: MARKET, BY VEHICLE TYPE, 2018–2022 (USD MILLION)
                                   TABLE 251 US: MARKET, BY VEHICLE TYPE, 2023–2028 (USD MILLION)
             13.4.3 CANADA
                       13.4.3.1 Government funding for charging infrastructure to be key to market growth
                                   TABLE 252 AVERAGE COST PENETRATION, BY VEHICLE USE, 2022
                                   TABLE 253 CANADA: MARKET, BY VEHICLE TYPE, 2018–2022 (UNITS)
                                   TABLE 254 CANADA: MARKET, BY VEHICLE TYPE, 2023–2028 (UNITS)
                                   TABLE 255 CANADA: MARKET, BY VEHICLE TYPE, 2018–2022 (USD MILLION)
                                   TABLE 256 CANADA: MARKET, BY VEHICLE TYPE, 2023–2028 (USD MILLION)
 
14 COMPETITIVE LANDSCAPE (Page No. - 267)
     14.1 OVERVIEW 
               TABLE 257 OEM SALES DATA FOR INDIA, 2022
     14.2 MARKET SHARE ANALYSIS FOR ELECTRIC SCOOTER AND MOTORCYCLE MARKET 
               TABLE 258 MARKET SHARE ANALYSIS, 2022
               FIGURE 76 MARKET SHARE ANALYSIS, 2022
             14.2.1 YADEA TECHNOLOGY GROUP CO., LTD.
             14.2.2 JIANGSU XINRI E-VEHICLE CO., LTD.
             14.2.3 NIU INTERNATIONAL
             14.2.4 HERO ELECTRIC
             14.2.5 OKINAWA AUTOTECH INTERNATIONALL PRIVATE LIMITED
     14.3 KEY PLAYER STRATEGIES 2019–2023 
               TABLE 259 OVERVIEW OF STRATEGIES ADOPTED BY KEY PLAYERS IN ELECTRIC SCOOTER AND MOTORCYCLE MARKET
     14.4 REVENUE ANALYSIS OF TOP LISTED/PUBLIC PLAYERS, 2021 
               FIGURE 77 TOP PUBLIC/LISTED PLAYERS DOMINATING MARKET DURING LAST 5 YEARS
     14.5 COMPETITIVE SCENARIO 
             14.5.1 NEW PRODUCT LAUNCHES
                       TABLE 260 NEW PRODUCT LAUNCHES, 2019–2023
             14.5.2 DEALS
                       TABLE 261 DEALS, 2019–2023
             14.5.3 OTHERS
                       TABLE 262 OTHERS, 2019–2023
     14.6 COMPANY EVALUATION QUADRANT 
             14.6.1 STARS
             14.6.2 EMERGING LEADERS
             14.6.3 PERVASIVE PLAYERS
             14.6.4 PARTICIPANTS
                       FIGURE 78 MARKET: COMPANY EVALUATION QUADRANT, 2022
                       TABLE 263 MARKET: COMPANY FOOTPRINT, 2022
                       TABLE 264 MARKET: PRODUCT FOOTPRINT, 2022
                       TABLE 265 ELECTRIC SCOOTER AND MOTORCYCLE MARKET: REGIONAL FOOTPRINT, 2022
     14.7 START-UP/SME EVALUATION QUADRANT 
             14.7.1 PROGRESSIVE COMPANIES
             14.7.2 RESPONSIVE COMPANIES
             14.7.3 DYNAMIC COMPANIES
             14.7.4 STARTING BLOCKS
                       FIGURE 79 MARKET: START-UP/SME EVALUATION QUADRANT, 2022
                       TABLE 266 MARKET: DETAILED LIST OF KEY START-UPS/SMES
                       TABLE 267 ELECTRIC SCOOTERS AND MOTORCYCLE MARKET: COMPETITIVE BENCHMARKING OF KEY PLAYERS [START-UPS/SMES]
 
15 COMPANY PROFILES (Page No. - 291)
(Business Overview, Products Offered, Recent Developments, and MnM View (Key strengths/Right to Win, Strategic Choices Made, and Weaknesses and Competitive Threats))*
     15.1 KEY PLAYERS 
             15.1.1 YADEA TECHNOLOGY GROUP CO., LTD.
                       TABLE 268 YADEA TECHNOLOGY GROUP CO., LTD.: BUSINESS OVERVIEW
                       FIGURE 80 YADEA TECHNOLOGY GROUP CO., LTD.: COMPANY SNAPSHOT
                       FIGURE 81 YADEA TECHNOLOGY GROUP CO., LTD.: SALES NETWORK, 2022
                       FIGURE 82 YADEA TECHNOLOGY GROUP CO., LTD.: REVENUE GENERATED BY PRODUCT TYPE, 2020 & 2021
                       TABLE 269 YADEA TECHNOLOGY GROUP CO., LTD.: PRODUCTS OFFERED
                       TABLE 270 YADEA TECHNOLOGY GROUP CO., LTD.: NEW PRODUCT DEVELOPMENTS
                       TABLE 271 YADEA TECHNOLOGY GROUP CO., LTD.: DEALS
                       TABLE 272 YADEA TECHNOLOGY GROUP CO., LTD.: OTHERS
             15.1.2 NIU INTERNATIONAL
                       TABLE 273 NIU INTERNATIONAL: BUSINESS OVERVIEW
                       FIGURE 83 NIU INTERNATIONAL: COMPANY SNAPSHOT
                       FIGURE 84 NIU INTERNATIONAL: ORGANIZATIONAL STRUCTURE
                       TABLE 274 NIU INTERNATIONAL: PRODUCTS OFFERED
                       TABLE 275 NIU INTERNATIONAL: NEW PRODUCT DEVELOPMENTS
                       TABLE 276 NIU INTERNATIONAL: DEALS
             15.1.3 SILENCE URBAN ECOMOBILITY
                       TABLE 277 SILENCE URBAN ECOMOBILITY: BUSINESS OVERVIEW
                       FIGURE 85 SILENCE URBAN ECOMOBILITY: COMPANY SNAPSHOT
                       TABLE 278 SILENCE URBAN ECOMOBILITY: PRODUCTS OFFERED
                       TABLE 279 SILENCE URBAN ECOMOBILITY: NEW PRODUCT DEVELOPMENTS
                       TABLE 280 SILENCE URBAN ECOMOBILITY: DEALS
                       TABLE 281 SILENCE URBAN ECOMOBILITY: OTHERS
             15.1.4 HERO ELECTRIC
                       TABLE 282 HERO ELECTRIC: BUSINESS OVERVIEW
                       FIGURE 86 HERO ELECTRIC: COMPANY ANNUAL GROWTH
                       TABLE 283 HERO ELECTRIC: PRODUCTS OFFERED
                       TABLE 284 HERO ELECTRIC: NEW PRODUCT DEVELOPMENTS
                       TABLE 285 HERO ELECTRIC: DEALS
                       TABLE 286 HERO ELECTRIC: OTHERS
             15.1.5 JIANGSU XINRI E-VEHICLE CO., LTD.
                       TABLE 287 JIANGSU XINRI E-VEHICLE CO., LTD.: BUSINESS OVERVIEW
                       FIGURE 87 JIANGSU XINRI E-VEHICLE CO., LTD.: COMPANY SNAPSHOT
                       TABLE 288 JIANGSU XINRI E-VEHICLE CO., LTD.: PRODUCTS OFFERED
                       TABLE 289 JIANGSU XINRI E-VEHICLE CO., LTD.: NEW PRODUCT DEVELOPMENTS
                       TABLE 290 JIANGSU XINRI E-VEHICLE CO., LTD.: DEALS
                       TABLE 291 JIANGSU XINRI E-VEHICLE CO., LTD.: OTHERS
             15.1.6 VMOTO LIMITED
                       TABLE 292 VMOTO LIMITED: BUSINESS OVERVIEW
                       FIGURE 88 VMOTO LIMITED: COMPANY SNAPSHOT
                       FIGURE 89 VMOTO LIMITED: ELECTRIC MOTORCYCLE/MOPED SALES, BY QUARTER, 2020–2022
                       TABLE 293 VMOTO LIMITED: PRODUCTS OFFERED
                       TABLE 294 VMOTO LIMITED: NEW PRODUCT DEVELOPMENTS
                       TABLE 295 VMOTO LIMITED: DEALS
                       TABLE 296 VMOTO LIMITED: OTHERS
             15.1.7 ENERGICA MOTOR COMPANY S.P.A.
                       TABLE 297 ENERGICA MOTOR COMPANY S.P.A: BUSINESS OVERVIEW
                       FIGURE 90 ENERGICA MOTOR COMPANY S.P.A.: COMPANY SNAPSHOT
                       TABLE 298 ENERGICA MOTOR COMPANY S.P.A.: PRODUCTS OFFERED
                       TABLE 299 ENERGICA MOTOR COMPANY S.P.A.: NEW PRODUCT DEVELOPMENTS
                       TABLE 300 ENERGICA MOTOR COMPANY S.P.A.: DEALS
                       TABLE 301 ENERGICA MOTOR COMPANY S.P.A.: OTHERS
             15.1.8 ASKOLL EVA S.P.A.
                       TABLE 302 ASKOLL EVA S.P.A.: BUSINESS OVERVIEW
                       FIGURE 91 ASKOLL EVA S.P.A.: COMPANY SNAPSHOT
                       FIGURE 92 ASKOLL EVA S.P.A.: COMPANY BUSINESS LINE SNAPSHOT
                       TABLE 303 ASKOLL EVA S.P.A.: PRODUCTS OFFERED
                       TABLE 304 ASKOLL EVA S.P.A.: NEW PRODUCT DEVELOPMENTS
                       TABLE 305 ASKOLL EVA S.P.A.: DEALS
             15.1.9 GOGORO
                       TABLE 306 GOGORO: BUSINESS OVERVIEW
                       FIGURE 93 GOGORO: COMPANY SNAPSHOT
                       TABLE 307 GOGORO: PRODUCTS OFFERED
                       TABLE 308 GOGORO: NEW PRODUCT DEVELOPMENTS
                       TABLE 309 GOGORO: DEALS
             15.1.10 OKINAWA AUTOTECH INTERNATIONALL PVT. LTD.
                       TABLE 310 OKINAWA AUTOTECH PVT. LTD.: BUSINESS OVERVIEW
                       TABLE 311 OKINAWA AUTOTECH PVT. LTD.: PRODUCTS OFFERED
                       TABLE 312 OKINAWA AUTOTECH INTERNATIONALL PVT. LTD.: NEW PRODUCT DEVELOPMENTS
                       TABLE 313 OKINAWA AUTOTECH INTERNATIONALL PVT. LTD.: DEALS
                       TABLE 314 OKINAWA AUTOTECH INTERNATIONALL PVT. LTD.: OTHERS
             15.1.11 ZHEJIANG LUYUAN ELECTRIC VEHICLE CO., LTD.
                       TABLE 315 ZHEJIANG LUYUAN ELECTRIC VEHICLE CO., LTD.: BUSINESS OVERVIEW
                       TABLE 316 ZHEJIANG LUYUAN ELECTRIC VEHICLE CO., LTD.: PRODUCTS OFFERED
                       TABLE 317 ZHEJIANG LUYUAN ELECTRIC VEHICLE CO., LTD.: NEW PRODUCT DEVELOPMENTS
                       TABLE 318 ZHEJIANG LUYUAN ELECTRIC VEHICLE CO., LTD.: DEALS
                       TABLE 319 ZHEJIANG LUYUAN ELECTRIC VEHICLE CO., LTD.: OTHERS
             15.1.12 ZERO MOTORCYCLES, INC.
                       TABLE 320 ZERO MOTORCYCLES, INC.: BUSINESS OVERVIEW
                       TABLE 321 ZERO MOTORCYCLES, INC.: PRODUCTS OFFERED
                       TABLE 322 ZERO MOTORCYCLES, INC.: NEW PRODUCT DEVELOPMENTS
                       TABLE 323 ZERO MOTORCYCLES, INC.: DEALS
             15.1.13 GOVECS
                       TABLE 324 GOVECS: BUSINESS OVERVIEW
                       TABLE 325 GOVECS: PRODUCTS OFFERED
                       TABLE 326 GOVECS: NEW PRODUCT DEVELOPMENTS
                       TABLE 327 GOVECS: DEALS
                       TABLE 328 GOVECS CORPORATION: OTHERS
     15.2 OTHER PLAYERS 
             15.2.1 ULTRAVIOLETTE AUTOMOTIVE
                       TABLE 329 ULTRAVIOLETTE AUTOMOTIVE: BUSINESS OVERVIEW
             15.2.2 REVOLT INTELLICORP PRIVATE LIMITED (REVOLT MOTORS)
                       TABLE 330 REVOLT INTELLICORP PRIVATE LIMITED (REVOLT MOTORS): BUSINESS OVERVIEW
             15.2.3 ATHER ENERGY
                       TABLE 331 ATHER ENERGY: BUSINESS OVERVIEW
             15.2.4 OLA ELECTRIC MOBILITY PVT. LTD.
                       TABLE 332 OLA ELECTRIC MOBILITY PVT LTD.: BUSINESS OVERVIEW
             15.2.5 Z ELECTRIC VEHICLE
                       TABLE 333 Z ELECTRIC VEHICLE: BUSINESS OVERVIEW
             15.2.6 CAKE
                       TABLE 334 CAKE: BUSINESS OVERVIEW
             15.2.7 LIGHTNING MOTORCYCLES
                       TABLE 335 LIGHTNING MOTORCYCLES: BUSINESS OVERVIEW
             15.2.8 JOHAMMER
                       TABLE 336 JOHAMMER: BUSINESS OVERVIEW
             15.2.9 PIAGGIO GROUP
                       TABLE 337 PIAGGIO GROUP: BUSINESS OVERVIEW
             15.2.10 KTM AG
                       TABLE 338 KTM AG: BUSINESS OVERVIEW
             15.2.11 HARLEY DAVIDSON
                       TABLE 339 HARLEY DAVIDSON: BUSINESS OVERVIEW
             15.2.12 BMW GROUP
                       TABLE 340 BMW GROUP: BUSINESS OVERVIEW
             15.2.13 AIMA TECHNOLOGY GROUP CO., LTD.
                       TABLE 341 AIMA TECHNOLOGY GROUP CO., LTD.: BUSINESS OVERVIEW
             15.2.14 HONDA MOTOR CO., LTD.
                       TABLE 342 HONDA MOTOR CO., LTD.: BUSINESS OVERVIEW
             15.2.15 GREAVES ELECTRIC MOBILITY PRIVATE LIMITED (AMPERE VEHICLES)
                       FIGURE 94 GREAVES ELECTRIC MOBILITY PRIVATE LIMITED: COMPANY REVENUE SNAPSHOT
                       TABLE 343 GREAVES ELECTRIC MOBILITY PRIVATE LIMITED (AMPERE VEHICLES): BUSINESS OVERVIEW
             15.2.16 DONGGUAN TAILING ELECTRIC VEHICLE CO., LTD.
                       TABLE 344 DONGGUAN TAILING ELECTRIC VEHICLE CO., LTD.: BUSINESS OVERVIEW
             15.2.17 CEZETA
                       TABLE 345 CEZETA: BUSINESS OVERVIEW
             15.2.18 TERRA MOTORS CORPORATION
                       TABLE 346 TERRA MOTORS CORPORATION: BUSINESS OVERVIEW
             15.2.19 SHANDONG INCALCU ELECTRIC VEHICLE CO., LTD.
                       TABLE 347 SHANDONG INCALCU ELECTRIC VEHICLE CO., LTD.: BUSINESS OVERVIEW
             15.2.20 NEXZU MOBILITY LTD. (AVAN MOTORS INDIA)
                       TABLE 348 NEXZU MOBILITY LTD. (AVAN MOTORS INDIA): BUSINESS OVERVIEW
             15.2.21 EMFLUX MOTORS
                       TABLE 349 EMFLUX MOTORS: BUSINESS OVERVIEW
             15.2.22 TVS MOTOR COMPANY
                       TABLE 350 TVS MOTOR COMPANY: BUSINESS OVERVIEW
             15.2.23 BAJAJ AUTO LTD.
                       TABLE 351 BAJAJ AUTO LTD.: BUSINESS OVERVIEW
             15.2.24 MAHINDRA & MAHINDRA LTD.
                       TABLE 352 MAHINDRA & MAHINDRA LTD.: BUSINESS OVERVIEW
             15.2.25 DAMON MOTORS INC.
                       TABLE 353 DAMON MOTORS INC.: BUSINESS OVERVIEW
             15.2.26 VIAR MOTOR INDONESIA
                       TABLE 354 VIAR MOTOR INDONESIA: BUSINESS OVERVIEW
             15.2.27 SELIS
                       TABLE 355 SELIS: BUSINESS OVERVIEW
             15.2.28 GESITS
                       TABLE 356 GESITS: BUSINESS OVERVIEW
             15.2.29 UNITED MOTOR
                       TABLE 357 UNITED MOTOR: BUSINESS OVERVIEW
             15.2.30 ELVINDO
                       TABLE 358 ELVINDO: BUSINESS OVERVIEW
             15.2.31 RAKATA MOTORCYCLE
                       TABLE 359 RAKATA MOTORCYCLE: BUSINESS OVERVIEW
             15.2.32 KWANG YANG MOTOR CO., LTD.
                       TABLE 360 KWANG YANG MOTOR CO., LTD.: BUSINESS OVERVIEW
             15.2.33 SMOOT ELEKTRIK
                       TABLE 361 SMOOT ELEKTRIK: BUSINESS OVERVIEW
             15.2.34 PT VOLTA INDONESIA SEMESTA (VOLTA)
                       TABLE 362 PT VOLTA INDONESIA SEMESTA (VOLTA): BUSINESS OVERVIEW
             15.2.35 ALVA
                       TABLE 363 ALVA: BUSINESS OVERVIEW
             15.2.36 NUSA MOTORS
                       TABLE 364 NUSA MOTORS: BUSINESS OVERVIEW
             15.2.37 OYIKA
                       TABLE 365 OYIKA: BUSINESS OVERVIEW
             15.2.38 MIGO EBIKE
                       TABLE 366 MIGO EBIKE: BUSINESS OVERVIEW
             15.2.39 BF GOODRICH
                       TABLE 367 BF GOODRICH: BUSINESS OVERVIEW
             15.2.40 ROBERT BOSCH GMBH
                       TABLE 368 ROBERT BOSCH GMBH: BUSINESS OVERVIEW
             15.2.41 NIDEC CORPORATION
                       TABLE 369 NIDEC CORPORATION: BUSINESS OVERVIEW
             15.2.42 CONTINENTAL AG
                       TABLE 370 CONTINENTAL AG: BUSINESS OVERVIEW
             15.2.43 VALEO
                       TABLE 371 VALEO: BUSINESS OVERVIEW
             15.2.44 SEG AUTOMOTIVE
                       TABLE 372 SEG AUTOMOTIVE: BUSINESS OVERVIEW
*Details on Business Overview, Products Offered, Recent Developments, and MnM View (Key strengths/Right to Win, Strategic Choices Made, and Weaknesses and Competitive Threats) might not be captured in case of unlisted companies.
 
16 RECOMMENDATIONS BY MARKETSANDMARKETS (Page No. - 384)
     16.1 RISING DEMAND FOR ELECTRIC SCOOTERS AND MOTORCYCLES IN ASIA PACIFIC 
     16.2 TECHNOLOGICAL ADVANCEMENTS TO HELP DEVELOP MARKET FOR BATTERY SWAPPING 
     16.3 CONCLUSION 
 
17 APPENDIX (Page No. - 386)
     17.1 KEY INSIGHTS FROM INDUSTRY EXPERTS 
     17.2 DISCUSSION GUIDE 
     17.3 KNOWLEDGESTORE: MARKETSANDMARKETS SUBSCRIPTION PORTAL 
     17.4 CUSTOMIZATION OPTIONS 
     17.5 RELATED REPORTS 
     17.6 AUTHOR DETAILS 

The study involved four major activities in estimating the current size of the electric scooter and motorcycle market. Exhaustive secondary research was done to collect information on the market, the peer market, and the parent market. The next step was to validate these findings, assumptions, and sizing with the industry experts across value chains through primary research. The top-down and bottom-up approaches were employed to estimate the complete market size. Thereafter, market breakdown and data triangulation processes were used to estimate the market size of segments and subsegments.

Secondary Research

In the secondary research process, various secondary sources such as company annual reports/presentations, press releases, industry association publications [for example, publications of electric vehicle manufacturers, Organisation Internationale des Constructeurs d'Automobiles (OICA), the Alternative Fuels Data Center (AFDC),International Energy Agency (IEA), Federal Transit Administration (FTA), Regional Transportation Authority (RTA), country-level vehicle associations and trade organizations, and the US Department of Transportation (DOT)], electric two-wheeler magazine articles, directories, technical handbooks, World Economic Outlook, trade websites, government organizations websites, and technical articles have been used to identify and collect information useful for an extensive commercial study of the global electric scooter and motorcycle market.

Primary Research

Extensive primary research has been conducted after acquiring an understanding of this market scenario through secondary research. In the primary research process, various primary sources from both supply and demand sides were interviewed to obtain qualitative and quantitative information for the report. The primary sources from the supply side included industry experts, such as Chief Executive Officers (CEOs), Vice Presidents (VPs), marketing directors, technology and innovation directors, and related key executives from various key companies and organizations. The primary sources from the demand side included end users, such as Chief Information Officers (CIOs), consultants, service professionals, technicians and technologists, and managers at public and investor-owned utilities. Approximately 30% and 70% of primary interviews have been conducted from the demand and supply side, respectively. Primary data has been collected through questionnaires, emails, LinkedIn, and telephonic interviews. In the canvassing of primaries, we have strived to cover various departments within organizations, such as sales, operations, and administration, to provide a holistic viewpoint in our report.

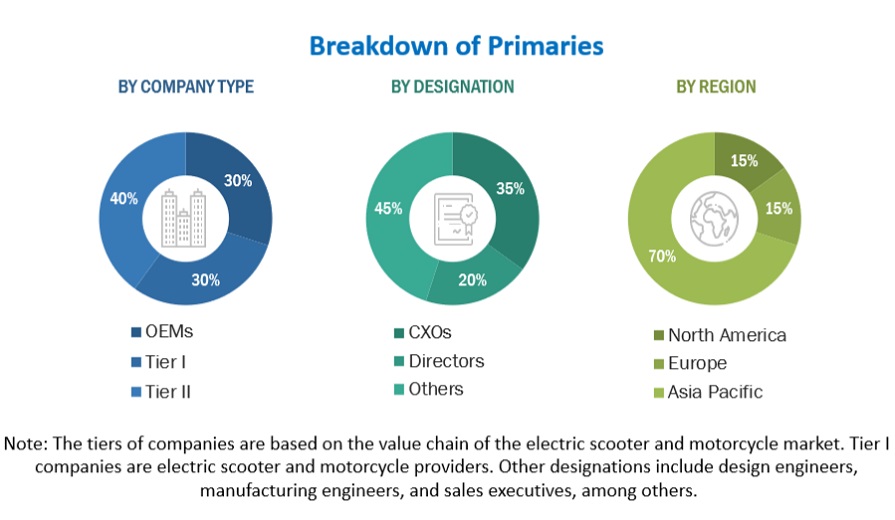
After interacting with industry experts, we conducted brief sessions with highly experienced independent consultants to reinforce the findings from our primaries. This, along with the in-house subject matter experts’ opinions, has led us to the findings as described in the remainder of this report. Following is the breakdown of primary respondents.
Electric Scooter and Motorcycle Market  Size, and Share

To know about the assumptions considered for the study, download the pdf brochure

Market Size Estimation

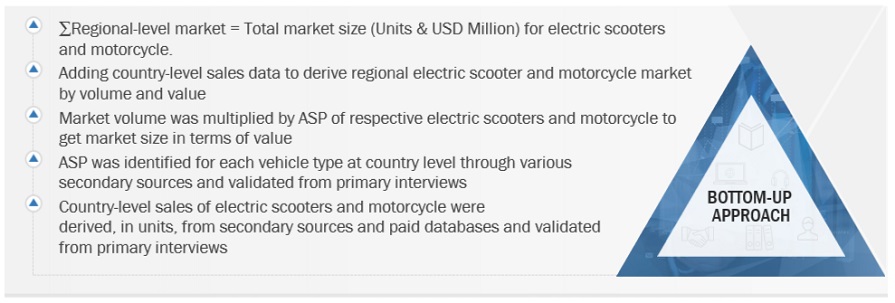
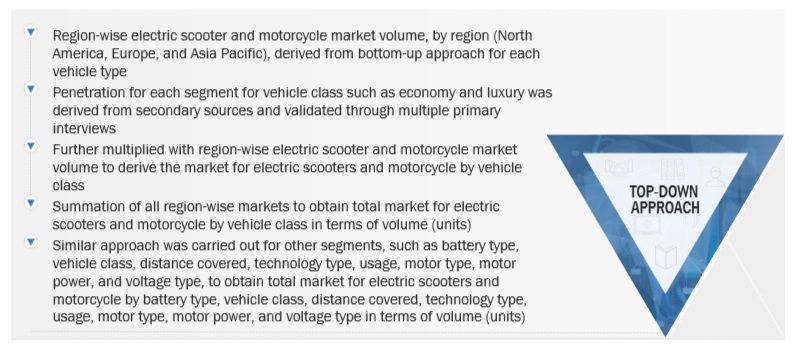
Multiple approaches were adopted for estimating and forecasting the electric scooter and motorcycle market. The first approach involves estimating the market size by summation of revenue generated through the sale of electric scooters and motorcycles. The top-down and bottom-up approaches have been used to estimate and validate the size of the global market and to estimate the size of various other dependent submarkets in the overall market. The research methodology used to estimate the market size includes the following details. The key players in the market were identified through secondary research, and their market shares in respective regions were determined through primary and secondary research. The entire procedure includes studying the annual and financial reports of top market players and extensive interviews with industry leaders such as CEOs, VPs, directors, and marketing executives. All percentage shares and breakdowns were determined using secondary sources and verified through primary sources. All possible parameters that affect the markets covered in this research study have been accounted for, viewed in extensive detail, verified through primary research, and analyzed to get the final quantitative and qualitative data.

Bottom-Up Approach: Electric Scooter And Motorcycle Market
Electric Scooter and Motorcycle Market  Size, and Share

To know about the assumptions considered for the study, Request for Free Sample Report

Top-Down Approach: Electric Scooter And Motorcycle Market
Electric Scooter and Motorcycle Market  Size, and Share

Data Triangulation

  • After arriving at the overall market size—using the market size estimation processes as explained above—the market was split into several segments and subsegments. To complete the overall market engineering process and arrive at the exact statistics of each market segment and subsegment, data triangulation, and market breakdown procedures were employed, wherever applicable. The data was triangulated by studying various factors and trends from both the demand and supply sides.

Market Definition

Electric scooters and motorcycles are plug-in two-wheeled vehicles that use electric motors to attain locomotion. The electricity is stored in a rechargeable battery, which drives the electric motors. These vehicles are zero-emission electric motor-driven vehicles. The operating speed and top speed of electric two-wheelers are based on battery technology.

A scooter/moped is an easy-to-operate two-wheeler with a step-through frame and a platform for the user’s feet. These two-wheelers are affordable, lightweight, and easy to commute. On the other hand, a motorcycle is a heavier, faster, and bigger two-wheeler than scooters/mopeds. Depending on the requirement, these two wheelers have different body designs and frames from scooters/mopeds. The electric versions of scooters and motorcycles are powered by electricity stored in the batteries.

Key Stackholders

  • Senior Management
  • Finance/Procurement Department
  • R&D Department
  • End User/Operator

Report Objectives

  • To segment and forecast the electric scooter and motorcycle market size in terms of volume (thousand units) and value (USD million/billion)
  • To define, describe, and forecast the market based on vehicle type, battery type, voltage type, vehicle class, technology type, distance covered, usage, and region.
  • To segment and forecast the market by battery type [sealed lead acid (SLA) and lithium-ion
    (li-ion)]
  • To segment and forecast the market by vehicle type (e-scooters/mopeds and e-motorcycles)
  • To segment and forecast the market by voltage type (36V, 48V, 60V, 72 V, and above 72V)
  • To segment and forecast the market by technology type (plug-in and batteries)
  • To segment and forecast the market by distance covered (below 75 miles, 75–100 miles, and above 100 miles)
  • To segment and forecast the market by vehicle class (economy and luxury)
  • To segment and forecast the market by usage (private and commercial)
  • To forecast the market size with respect to key regions, namely, North America, Europe, and Asia Pacific
  • To provide detailed information regarding the major factors influencing the market growth (drivers, challenges, restraints, and opportunities)
  • To analyze technological developments impacting the market
  • To analyze opportunities for stakeholders and the competitive landscape for market leaders in the electric scooter and motorcycle market
  • To strategically analyze markets with respect to individual growth trends, prospects, and contributions to the total market.
  • To study the following with respect to the market
    • Value Chain Analysis
    • Ecosystem Analysis
    • Porter’s Five Forces Analysis
    • Technology Analysis
    • Trade Analysis
    • Case Study Analysis
    • Patent Analysis
    • Regulatory Landscape
    • Conference and Events
    • Macro-economic Factor
    • Average Selling Price Analysis
    • Buying Criteria
  • To strategically profile key players and comprehensively analyze their market share and their core competencies.
  • To track and analyze competitive developments such as deals (joint ventures, mergers & acquisitions, partnerships, collaborations), new product development, and other activities carried out by key industry participants

Available Customizations

With the given market data, MarketsandMarkets offers customizations in line with the company’s specific needs.

  • Electric Scooter and Motorcycle Market, By technology Type at country level (For countries covered in the report)
  • Electric Scooter and Motorcycle Market, By battery type at country level (For countries covered in the report)

Company Information

  • Profiling of Additional Market Players (Up to 5)
Custom Market Research Services

We will customize the research for you, in case the report listed above does not meet with your exact requirements. Our custom research will comprehensively cover the business information you require to help you arrive at strategic and profitable business decisions.

Request Customization

Instant Answers with GPT - Ask Now!

Ask real questions. Get complete answers !
Report Code
AT 7219
Published ON
Mar, 2023
Choose License Type
BUY NOW
  • SHARE
X
Request Customization
Speak to Analyst
Speak to Analyst
OR FACE-TO-FACE MEETING
PERSONALIZE THIS RESEARCH
  • Triangulate with your Own Data
  • Get Data as per your Format and Definition
  • Gain a Deeper Dive on a Specific Application, Geography, Customer or Competitor
  • Any level of Personalization
REQUEST A FREE CUSTOMIZATION
LET US HELP YOU!
  • What are the Known and Unknown Adjacencies Impacting the Electric Scooter and Motorcycle Market
  • What will your New Revenue Sources be?
  • Who will be your Top Customer; what will make them switch?
  • Defend your Market Share or Win Competitors
  • Get a Scorecard for Target Partners
CUSTOMIZED WORKSHOP REQUEST
+1-888-600-6441
  • Call Us
  • +1-888-600-6441 (Corporate office hours)
  • +1-888-600-6441 (US/Can toll free)
  • +44-800-368-9399 (UK office hours)
CONNECT WITH US
ABOUT TRUST ONLINE
©2023 MarketsandMarkets Research Private Ltd. All rights reserved
DMCA.com Protection Status Website Feedback