Electrolyzers Market

Electrolyzers Market by Technology (Alkaline Electrolyzer (AE), Proton Exchange Membrane (PEM), SOE, AEM), Application (Energy, Mobility, Industrial, Grid Injection), Power Rating (<500 kW, 500-2,000 kW, >2,000 kW) and Region - Global Forecast to 2028

Report Code: EP 8577 Feb, 2023, by marketsandmarkets.com

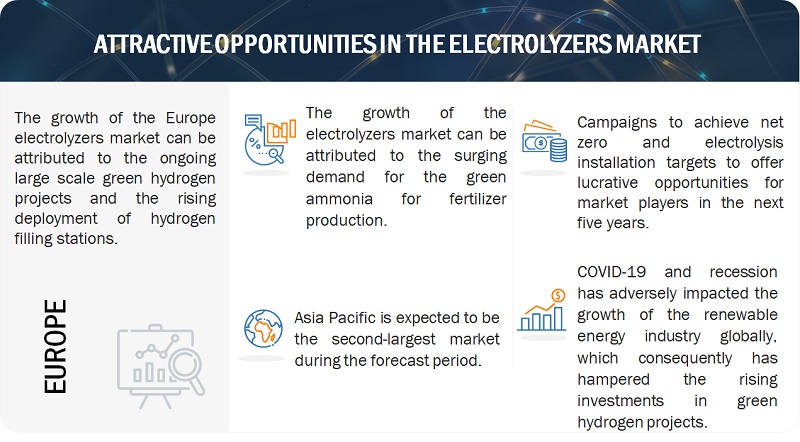
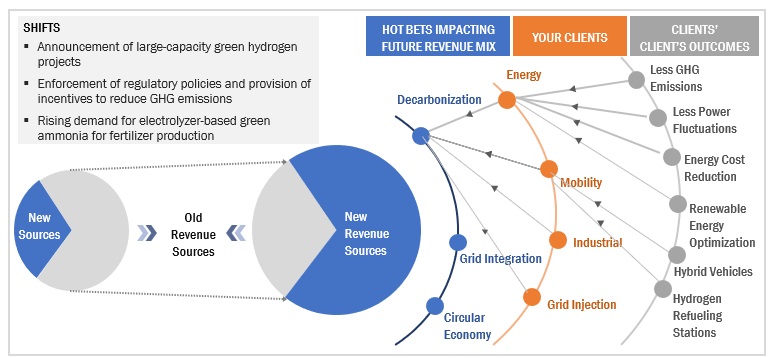
[206 Pages Report] The global electrolyzers market in terms of revenue was estimated to be worth $1.2 billion in 2023 and is poised to reach $23.6 billion by 2028, growing at a CAGR of 80.3% from 2023 to 2028. The increasing investments in green hydrogen production and surge in demand for the electrolyzer based green ammonia for fertilizers production are some of the key factors accelerating the growth of the electrolyzers market.
Electrolyzers Market

To know about the assumptions considered for the study, Request for Free Sample Report

Market Dynamics

Driver: Increased investments in large-capacity green hydrogen projects

Increasing investments in green hydrogen projects have spurred the electrolyzers market growth. Currently, there is a renewed interest in green hydrogen projects as the possible uses of hydrogen are expanding across multiple sectors, including power generation, manufacturing processes in industries such as steelmaking and cement production, fuel cells for electric vehicles, heavy transport such as shipping, green ammonia production for fertilizers, cleaning products, refrigeration, and electricity grid stabilization. As more projects are being set up, companies plan to accommodate and utilize green hydrogen in their value chain, and this, in turn, is providing lucrative opportunities for the use of electrolyzers. More private players would venture into the field with such projects and attract new and innovative companies to advance the technologies. Asia, Europe, and Australia are at the forefront of developing green hydrogen and associated technologies. Moreover, as the sizes of projects have been increasing, so is the investment required for them.

Restraints: Underdeveloped electrolyzer supply chain

Geographies such as North America, rely on imports for procuring platinum, iridium, and graphite, which are crucial components for electrolyzers. The nascent electrolyzers market is made up of limited suppliers. Many key players are large companies (Cummins Inc., Siemens Energy, etc.), but the electrolyzer business is only a small portion of their business profiles. Some large electrolyzer manufacturers produce most of the subcomponents (i.e., gas diffusion layer, bipolar plates, and electrolyte membrane) in-house. Other suppliers typically produce one or two subcomponents in the supply chain. Additionally, suppliers do lack the capacity to produce electrolyzers and components at high manufacturing rates.

Opportunities: Growing demand for the electrolyzer based on-site hydrogen fueling stations

The requirement to construct hydrogen refueling stations is growing as there is a rise in use of fuel cell vehicles.. The emissions from vehicles account for more than 15% of global greenhouse emissions. Hence, governments all over the world are finding alternative power sources for use in the transportation sector. The adoption of fuel cell vehicles (FCVs) in the sector is expected to increase in the near future owing to the absence of CO2 emissions during vehicle operations. Therefore, many automotive manufacturers are making considerable investments to incorporate fuel cell vehicles in their product offerings.  Fuel cell electric vehicles (FCEVs) can convert hydrogen stored in the vehicle via fuel cells into electricity to power the electric motor. Due to high fuel and purchase prices, the cost of owning and operating FCEVs is more than electric vehicles. However, governments of various countries worldwide are deploying fuel cell-powered public buses and garbage trucks as they are environment-friendly. FCEVs have been commercially available since 2014, and according to IEA, the number of FCEVs increased by 40% in 2020.

Challenges: High initial setup cost and insufficient hydrogen infrastructure

In the present scenario, hydrogen is produced at locations where it is to be used. Hydrogen delivery and storage infrastructure will need to grow to support a large hydrogen market. Pipelines are the most energy-efficient approach to transporting hydrogen. However, their deployment is challenged by their high capital costs. The lack of need for transportation has hence left the hydrogen market unexplored. Additionally, The setup costs of hydrogen fuel stations and other infrastructure are quite high compared to petroleum, diesel, and other fuels. This high cost is due to the expensive equipment required for the fuel stations, along with necessary precautions and safety measures, as hydrogen is highly combustible.

Market Trends
Electrolyzers Market

To know about the assumptions considered for the study, download the pdf brochure

By technology, alkaline electrolyzers segment to witness largest electrolyzers market share during forecast period

The alkaline electrolyzers segment is expected to witness the largest market share from 2023 to 2028. The growth of the alkaline electrolyzer is attributed by the fact that it is relatively mature technology and cost-effective segment as compared to other technologies during the forecasted period. Europe led the electrolyzers market for alkaline electrolyzer technology in 2022. The high growth and market share of alkaline electrolyzer technology are attributed to its key advantages over other manufacturing technologies in the region. The region is a competitive market for electrolyzers.

By application, grid injection segment to witness highest CAGR during forecast period

By application, grid injection segment is expected to grow at highest rate during the forecast period. The segment's growth is attributed to increased penetration of renewables in energy systems. In the grid injection sector in 2022, Europe dominated the electrolyzers market. This is because the preexisting grids for natural gas, carbon dioxide, petroleum, and other resources can be repurposed. This is increasing grid injection as well as the region's investment in electrolyzers

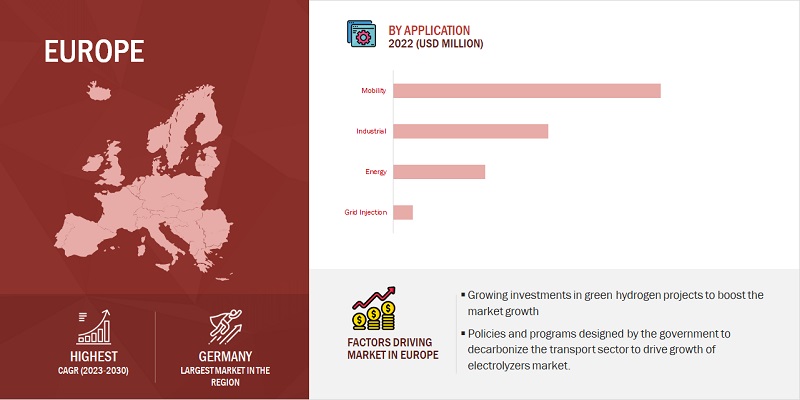
Europe is expected to be the largest electrolyzers market during the forecast period.

Europe is expected to be the largest market share in the electrolyzers market during the forecast period. The European market has been studied for Germany, the UK, France, Denmark, Austria, Spain, the Netherlands, Norway, and Rest of Europe. Currently, less than 2% of Europe’s energy consumption comes from hydrogen, mainly used for making products such as plastics and fertilizers, and 96% is made from natural gas, emitting a significant amount of CO2 in the process. The growth of the Europe electrolyzers market is characterized by the increase in the production of green electricity for small-scale applications in rural areas and green fuel due to higher demand for fuel cell vehicles.
Electrolyzers Market Size, and Share

Key Market Players

The major players in the global electrolyzers market are Siemens Energy (Germany), Nel ASA (Norway), Plug Power Inc. (US), Enapter S.r.l. (Italy), and Cummins Inc. (US).

Electrolyzers Market Report Scope

Report Attributes

Details

Market size:

USD 1.2 billion in 2023 to USD 23.6 billion by 2028

Growth Rate:

80.3%

Largest Market:

Europe

Market Dynamics:

Drivers, Restraints, Opportunities & Challenges

Forecast Period:

2023-2028

Forecast Units:

Value (USD Billion)

Report Coverage:

Revenue Forecast, Competitive Landscape, Growth Factors, and Trends

Segments Covered: 

Power Rating, Technology, Application, and Region

Geographies Covered:

Europe, North America, Asia Pacific, Latin America, and Middle East and Africa

Report Highlights:


Updated financial information / product portfolio of players

Key Market Opportunities:

Growing demand for the electrolyzer based on-site hydrogen fueling stations

Key Market Drivers:

Increased investments in large-capacity green hydrogen projects

This research report categorizes the electrolyzers market by power rating, technology, application, and region.

On the basis of technology, the electrolyzers market has been segmented as follows:
  • Alkaline Electrolyzer (AE)
  • Proton Exchange Membrane (PEM)
  • Solid Oxide Electrolyzer (SOE)
  • Anion Exchange Membrane (AEM)
On the basis of application, the electrolyzers market has been segmented as follows:
  • Energy
    • Power Generation
    • CHP
  • Mobility
  • Industrial
    • Chemical
    • Industries
  • Grid Injection
On the basis of power rating, the electrolyzers market has been segmented as follows:
  • <500 KW
  • 500-2,000 KW
  • >2,000 KW
Based on region, the electrolyzers market has been segmented as follows:
  • Europe
  • Asia Pacific
  • North America
  • Rest of the World

Recent Developments

  • In January 2023, Enapter S.r.l received a contract from Adsensys, one of the leading suppliers of fuels, for supplying an AEM Multicore electrolyzer. This electrolyzer can produce about 450 kilograms of green hydrogen per day.
  • In December 2022, Cummins Inc. received a contract from Linde plc for supplying a 35-megawatt (MW) proton exchange membrane (PEM) electrolyzer system for Linde’s new hydrogen production plant in Niagara Falls, New York.
  • In June 2022, Siemens Energy and Air Liquide formed a joint venture for the production of industrial-scale renewable hydrogen electrolyzers in Europe.
  • In May 2022, Nel ASA has officially opened a 20 MW PEM electrolyzer plant in Spain, Europe. It will be utilized to generate green hydrogen, which can reduce CO2 emissions from fertilizer production.

Frequently Asked Questions (FAQ):

To speak to our analyst for a discussion on the above findings, click Speak to Analyst

TABLE OF CONTENTS
 
1 INTRODUCTION (Page No. - 24)
    1.1 STUDY OBJECTIVES 
    1.2 MARKET DEFINITION 
           1.2.1 INCLUSIONS AND EXCLUSIONS
    1.3 MARKET SCOPE 
           1.3.1 MARKET SEGMENTATION
           1.3.2 REGIONAL SCOPE
           1.3.3 YEARS CONSIDERED
    1.4 CURRENCY CONSIDERED 
    1.5 LIMITATIONS 
    1.6 STAKEHOLDERS 
    1.7 IMPACT OF RECESSION 
 
2 RESEARCH METHODOLOGY (Page No. - 28)
    2.1 RESEARCH DATA 
           FIGURE 1 ELECTROLYZERS MARKET: RESEARCH DESIGN
    2.2 MARKET BREAKDOWN AND DATA TRIANGULATION 
           FIGURE 2 DATA TRIANGULATION METHODOLOGY
           2.2.1 SECONDARY DATA
                    2.2.1.1 Key data from secondary sources
           2.2.2 PRIMARY DATA
                    2.2.2.1 Key data from primary sources
                    2.2.2.2 Breakdown of primary interviews
                               FIGURE 3 BREAKDOWN OF PRIMARIES
    2.3 MARKET SIZE ESTIMATION 
           2.3.1 BOTTOM-UP APPROACH
                    FIGURE 4 ELECTROLYZERS MARKET: BOTTOM-UP APPROACH
           2.3.2 TOP-DOWN APPROACH
                    FIGURE 5 ELECTROLYZERS MARKET: TOP-DOWN APPROACH
           2.3.3 DEMAND-SIDE ANALYSIS
                    FIGURE 6 METRICS CONSIDERED TO ANALYZE DEMAND FOR ELECTROLYZERS
                    2.3.3.1 Assumptions for demand-side analysis
                    2.3.3.2 Calculations for demand-side analysis
                               TABLE 1 GLOBAL MARKET SIZE ESTIMATION, BY TECHNOLOGY, 2022
           2.3.4 SUPPLY-SIDE ANALYSIS
                    FIGURE 7 KEY METRICS CONSIDERED FOR ASSESSING SUPPLY OF ELECTROLYZERS
                    FIGURE 8 ELECTROLYZERS MARKET: SUPPLY SIDE ANALYSIS
                    2.3.4.1 Assumptions and calculations for supply-side analysis
                               FIGURE 9 ELECTROLYZERS MARKET: MARKET SHARE ANALYSIS
    2.4 GROWTH FORECAST 
    2.5 IMPACT OF RECESSION 
 
3 EXECUTIVE SUMMARY (Page No. - 38)
    TABLE 2 ELECTROLYZERS MARKET SNAPSHOT 
    FIGURE 10 ALKALINE ELECTROLYZERS TO DOMINATE MARKET, BY TECHNOLOGY, DURING FORECAST PERIOD 
    FIGURE 11 MOBILITY APPLICATIONS TO LEAD MARKET, BY APPLICATION, DURING FORECAST PERIOD 
    FIGURE 12 ROW DOMINATED MARKET IN 2022 
 
4 PREMIUM INSIGHTS (Page No. - 41)
    4.1 ATTRACTIVE OPPORTUNITIES FOR PLAYERS IN ELECTROLYZERS MARKET 
           FIGURE 13 INCREASING DEMAND FOR GREEN HYDROGEN TO DRIVE ELECTROLYZER MARKET, 2023–2028
    4.2 ELECTROLYZERS MARKET, BY REGION 
           FIGURE 14 EUROPE TO WITNESS FASTEST GROWTH OF ELECTROLYZERS MARKET DURING FORECAST PERIOD
    4.3 ELECTROLYZERS MARKET, BY TECHNOLOGY 
           FIGURE 15 ALKALINE ELECTROLYZER SEGMENT DOMINATED MARKET, BY TECHNOLOGY, IN 2021
    4.4 ELECTROLYZERS MARKET, BY APPLICATION 
           FIGURE 16 MOBILITY SEGMENT DOMINATED MARKET, BY APPLICATION, IN 2022
    4.5 ELECTROLYZERS MARKET IN ROW, BY APPLICATION & COUNTRY 
           FIGURE 17 INDUSTRIAL APPLICATIONS & EGYPT DOMINATED MARKET IN ROW, BY APPLICATION & COUNTRY, IN 2022
 
5 MARKET OVERVIEW (Page No. - 44)
    5.1 INTRODUCTION 
    5.2 MARKET DYNAMICS 
           FIGURE 18 ELECTROLYZERS MARKET: DRIVERS, RESTRAINTS, OPPORTUNITIES, AND CHALLENGES
           5.2.1 DRIVERS
                    5.2.1.1 Declining renewable energy costs
                               TABLE 3 GLOBAL LCOE FROM NEWLY COMMISSIONED UTILITY-SCALE SOLAR AND WIND POWER TECHNOLOGIES, 2020–2021
                               FIGURE 19 GLOBAL WEIGHTED AVERAGE LCOE FROM NEWLY COMMISSIONED, UTILITY-SCALE RENEWABLE POWER GENERATION TECHNOLOGIES, 2010–2021
                    5.2.1.2 Increasing government support
                    5.2.1.3 Increasing investments in electrolyzer deployment
                    5.2.1.4 Rising demand for electrolyzer-based green ammonia for fertilizer production
           5.2.2 RESTRAINTS
                    5.2.2.1 Use of critical materials
                               TABLE 4 CRITICAL MATERIALS GLOBAL SHARES
                    5.2.2.2 Underdeveloped electrolyzer supply chain
           5.2.3 OPPORTUNITIES
                    5.2.3.1 Plans to achieve net zero and electrolyzer targets
                               TABLE 5 ZERO EMISSION TARGETS OF MAJOR ECONOMIES
                               FIGURE 20 ELECTROLYZER CAPACITY TARGETS IN EUROPE, 2030 (GW)
                    5.2.3.2 Increasing demand for electrolyzer-based onsite hydrogen refueling stations (HRS)
                               FIGURE 21 HYDROGEN REFUELING STATIONS WORLDWIDE, 2020
                    5.2.3.3 High potential of electrolyzer-based hydrogen trade in Europe
           5.2.4 CHALLENGES
                    5.2.4.1 High initial investments in hydrogen fueling infrastructure
                    5.2.4.2 Insufficient infrastructure to support hydrogen markets
    5.3 TRENDS/DISRUPTIONS IMPACTING CUSTOMER BUSINESS 
           FIGURE 22 REVENUE SHIFT FOR ELECTROLYZER PROVIDERS
    5.4 SUPPLY CHAIN ANALYSIS 
           FIGURE 23 ELECTROLYZERS MARKET: SUPPLY CHAIN ANALYSIS
           5.4.1 RAW MATERIALS PROVIDERS
           5.4.2 PROCESSED MATERIALS PROVIDERS
           5.4.3 SUBCOMPONENT PROVIDERS
           5.4.4 ELECTROLYZER MANUFACTURERS
           5.4.5 END USERS
                    TABLE 6 LIST OF COMPANIES AND THEIR ROLES IN ELECTROLYZER ECOSYSTEM
    5.5 ECOSYSTEM MAPPING 
           FIGURE 24 ELECTROLYZER MARKET MAP
    5.6 TECHNOLOGY ANALYSIS 
    5.7 PATENT ANALYSIS 
           5.7.1 LIST OF MAJOR PATENTS
                    TABLE 7 ELECTROLYZER: INNOVATIONS AND PATENT REGISTRATIONS, JUNE 2016–NOVEMBER 2022
    5.8 TARIFF AND REGULATORY FRAMEWORK 
           5.8.1 REGULATORY BODIES, GOVERNMENT AGENCIES, AND OTHER ORGANIZATIONS
                    TABLE 8 NORTH AMERICA: LIST OF REGULATORY BODIES, GOVERNMENT AGENCIES, AND OTHER ORGANIZATIONS
                    TABLE 9 EUROPE: LIST OF REGULATORY BODIES, GOVERNMENT AGENCIES, AND OTHER ORGANIZATIONS
                    TABLE 10 ASIA PACIFIC: LIST OF REGULATORY BODIES, GOVERNMENT AGENCIES, AND OTHER ORGANIZATIONS
                    TABLE 11 REST OF THE WORLD: LIST OF REGULATORY BODIES, GOVERNMENT AGENCIES, AND OTHER ORGANIZATIONS
           5.8.2 ELECTROLYZERS MARKET: REGULATORY FRAMEWORK
                    TABLE 12 REGULATORY FRAMEWORK: MARKET, BY REGION
    5.9 KEY CONFERENCES AND EVENTS 
           TABLE 13 ELECTROLYZERS MARKET: DETAILED LIST OF CONFERENCES AND EVENTS, 2023–2024
    5.10 TRADE ANALYSIS 
           5.10.1 HS CODE
                    5.10.1.1 Export scenario
                               TABLE 14 EXPORT SCENARIO FOR HS CODE, BY COUNTRY, 2019–2021 (USD)
                               FIGURE 25 EXPORT DATA FOR TOP 5 COUNTRIES, 2019–2021 (USD)
                    5.10.1.2 Import scenario
                               TABLE 15 IMPORT SCENARIO FOR HS CODE, BY COUNTRY, 2019–2021 (USD)
                               FIGURE 26 IMPORT DATA FOR TOP 5 COUNTRIES, 2019–2021 (USD)
    5.11 PRICING ANALYSIS 
                    TABLE 16 INDICATIVE PRICING ANALYSIS, BY TECHNOLOGY
    5.12 CASE STUDY ANALYSIS 
           5.12.1 LARGE-SCALE HYDROGEN PRODUCTION
                    5.12.1.1 Problem statement
                    5.12.1.2 Solution
           5.12.2 STORING AND TRANSPORTING RENEWABLE ENERGY
                    5.12.2.1 Problem statement
                    5.12.2.2 Solution
    5.13 PORTER'S FIVE FORCES ANALYSIS 
                    FIGURE 27 PORTER'S FIVE FORCES ANALYSIS FOR MARKET
                    TABLE 17 ELECTROLYZERS MARKET: PORTER'S FIVE FORCES ANALYSIS
           5.13.1 THREAT OF SUBSTITUTES
           5.13.2 BARGAINING POWER OF SUPPLIERS
           5.13.3 BARGAINING POWER OF BUYERS
           5.13.4 THREAT OF NEW ENTRANTS
           5.13.5 INTENSITY OF COMPETITIVE RIVALRY
    5.14 KEY STAKEHOLDERS AND BUYING CRITERIA 
           5.14.1 KEY STAKEHOLDERS IN BUYING PROCESS
                    FIGURE 28 INFLUENCE OF STAKEHOLDERS ON BUYING PROCESS FOR TOP 3 APPLICATION INDUSTRIES
                    TABLE 18 INFLUENCE OF STAKEHOLDERS ON BUYING PROCESS FOR TOP 3 APPLICATIONS (%)
           5.14.2 BUYING CRITERIA
                    FIGURE 29 KEY BUYING CRITERIA FOR TOP 3 APPLICATIONS
                    TABLE 19 KEY BUYING CRITERIA FOR TOP 3 APPLICATIONS
 
6 ELECTROLYZERS MARKET, BY POWER RATING (Page No. - 70)
    6.1 INTRODUCTION 
           TABLE 20 COMPANY POWER RATING FOOTPRINT
    6.2 <500 KW 
           6.2.1 GROWING DEMAND FOR <500 KW ELECTROLYZERS EXPECTED TO BOOST SEGMENT
    6.3 500–2,000 KW 
           6.3.1 INCREASING DEMAND FOR GREEN HYDROGEN TO BOOST ELECTROLYZERS MARKET
    6.4 >2,000 KW 
           6.4.1 RISING INVESTMENTS IN HIGH-CAPACITY HYDROGEN PRODUCTION PLANTS
 
7 ELECTROLYZERS MARKET, BY TECHNOLOGY (Page No. - 73)
    7.1 INTRODUCTION 
           FIGURE 30 ELECTROLYZERS MARKET SHARE, BY TECHNOLOGY, 2022 (%)
           TABLE 21 MARKET, BY TECHNOLOGY, 2021–2028 (KW)
           TABLE 22 MARKET, BY TECHNOLOGY, 2021–2028 (USD MILLION)
    7.2 ALKALINE ELECTROLYZER (AE) 
           7.2.1 RELATIVELY MATURE AND COST-EFFECTIVE TECHNOLOGY
                    TABLE 23 ALKALINE ELECTROLYZER: ELECTROLYZERS MARKET, BY REGION, 2021–2028 (KW)
                    TABLE 24 ALKALINE ELECTROLYZER: MARKET, BY REGION, 2021–2028 (USD MILLION)
    7.3 PROTON EXCHANGE MEMBRANE (PEM) 
           7.3.1 HIGHLY FLEXIBLE TECHNOLOGY AND GOOD COUPLING WITH DYNAMIC AND INTERMITTENT RENEWABLE ENERGY SYSTEMS
                    TABLE 25 PROTON EXCHANGE MEMBRANE (PEM): ELECTROLYZERS MARKET, BY REGION, 2021–2028 (KW)
                    TABLE 26 PROTON EXCHANGE MEMBRANE (PEM): MARKET, BY REGION, 2021–2028 (USD MILLION)
    7.4 SOLID OXIDE ELECTROLYZER (SOE) 
           7.4.1 EFFICIENT TECHNOLOGY REDUCING NEED FOR ELECTRICITY WHILE PRODUCING HYDROGEN
                    TABLE 27 SOLID OXIDE ELECTROLYZER: ELECTROLYZERS MARKET, BY REGION, 2021–2028 (KW)
                    TABLE 28 SOLID OXIDE ELECTROLYZER: MARKET, BY REGION, 2021–2028 (USD MILLION)
    7.5 ANION EXCHANGE MEMBRANE (AEM) 
           7.5.1 POTENTIAL TECHNOLOGY COUPLED WITH BENEFITS OF PROTON EXCHANGE MEMBRANE AND ALKALINE WATER ELECTROLYSIS
                    TABLE 29 ANION EXCHANGE MEMBRANE: ELECTROLYZERS MARKET, BY REGION, 2021–2028 (KW)
                    TABLE 30 ANION EXCHANGE MEMBRANE: MARKET, BY REGION, 2021–2028 (USD MILLION)
 
8 ELECTROLYZERS MARKET, BY APPLICATION (Page No. - 80)
    8.1 INTRODUCTION 
           FIGURE 31 ELECTROLYZERS MARKET SHARE, BY APPLICATION, 2022 (%)
           TABLE 31 MARKET, BY APPLICATION, 2021–2028 (KW)
           TABLE 32 MARKET, BY APPLICATION, 2021–2028 (USD MILLION)
    8.2 ENERGY 
           TABLE 33 ENERGY: ELECTROLYZERS MARKET, BY REGION, 2021–2028 (KW)
           TABLE 34 ENERGY: MARKET, BY REGION, 2021–2028 (USD MILLION)
           TABLE 35 ENERGY: MARKET, BY APPLICATION, 2021–2028 (KW)
           TABLE 36 ENERGY: MARKET, BY APPLICATION, 2021–2028 (USD MILLION)
           8.2.1 POWER GENERATION
                    8.2.1.1 Increasing demand for hydrogen to cope with load fluctuations
           8.2.2 CHP
                    8.2.2.1 Shift toward green hydrogen instead of coal for CHP plants
    8.3 MOBILITY 
           8.3.1 INCREASING GOVERNMENT INVESTMENTS TO SHIFT TOWARD CLEAN FUEL
                    TABLE 37 MOBILITY: MARKET, BY REGION, 2021–2028 (KW)
                    TABLE 38 MOBILITY: MARKET, BY REGION, 2021–2028 (USD MILLION)
    8.4 INDUSTRIAL 
           TABLE 39 INDUSTRIAL: ELECTROLYZERS MARKET, BY REGION, 2021–2028 (KW)
           TABLE 40 INDUSTRIAL: MARKET, BY REGION, 2021–2028 (USD MILLION)
           TABLE 41 INDUSTRIAL: MARKET, BY APPLICATION, 2021–2028 (KW)
           TABLE 42 INDUSTRIAL: MARKET, BY APPLICATION, 2021–2028 (USD MILLION)
           8.4.1 CHEMICAL
                    8.4.1.1 Increasing demand for clean energy sources in chemical industry
           8.4.2 INDUSTRIES
                    8.4.2.1 Growing demand for clean energy
    8.5 GRID INJECTION 
           8.5.1 INCREASED PENETRATION OF RENEWABLES IN ENERGY SYSTEMS
                    TABLE 43 GRID INJECTION: ELECTROLYZERS MARKET, BY REGION, 2021–2028 (KW)
                    TABLE 44 GRID INJECTION: MARKET, BY REGION, 2021–2028 (USD MILLION)
 
9 ELECTROLYZERS MARKET, BY REGION (Page No. - 89)
    9.1 INTRODUCTION 
           FIGURE 32 REST OF THE WORLD ACCOUNTED FOR LARGEST SHARE OF MARKET IN 2022
           TABLE 45 ELECTROLYZERS MARKET, BY REGION, 2021–2028 (KW)
           TABLE 46 MARKET, BY REGION, 2021–2028 (USD MILLION)
    9.2 EUROPE 
           FIGURE 33 EUROPE: ELECTROLYZERS MARKET SNAPSHOT
           9.2.1 EUROPE: RECESSION IMPACT
           9.2.2 EUROPE: ELECTROLYZERS PROJECT LIST
                    TABLE 47 EUROPE: ELECTROLYZERS PROJECT LIST
           9.2.3 BY TECHNOLOGY
                    TABLE 48 EUROPE: ELECTROLYZERS MARKET, BY TECHNOLOGY, 2021–2028 (USD MILLION)
           9.2.4 BY APPLICATION
                    TABLE 49 EUROPE: MARKET, BY APPLICATION, 2021–2028 (USD MILLION)
           9.2.5 BY COUNTRY
                    TABLE 50 EUROPE: MARKET, BY COUNTRY, 2021–2028 (KW)
                    TABLE 51 EUROPE: MARKET, BY COUNTRY, 2021–2028 (USD MILLION)
                    9.2.5.1 Germany
                               9.2.5.1.1 Ongoing large-scale green hydrogen projects
                               TABLE 52 GERMANY: MARKET, BY APPLICATION, 2021–2028 (USD MILLION)
                    9.2.5.2 UK
                               9.2.5.2.1 Rise in electrolyzer manufacturing capacities
                               TABLE 53 UK: ELECTROLYZERS MARKET, BY APPLICATION, 2021–2028 (USD MILLION)
                    9.2.5.3 France
                               9.2.5.3.1 Government support and focus on research activities
                               TABLE 54 FRANCE: MARKET, BY APPLICATION, 2021–2028 (USD MILLION)
                    9.2.5.4 Denmark
                               9.2.5.4.1 Efforts to decarbonize mobility sector
                               TABLE 55 DENMARK: MARKET, BY APPLICATION, 2021–2028 (USD MILLION)
                    9.2.5.5 Austria
                               9.2.5.5.1 Focus on decarbonizing steel and chemical industries
                               TABLE 56 AUSTRIA: ELECTROLYZERS MARKET, BY APPLICATION, 2021–2028 (USD MILLION)
                    9.2.5.6 Netherlands
                               9.2.5.6.1 Highest subsidies per gigawatt of electrolyzer capacity
                               TABLE 57 NETHERLANDS: MARKET, BY APPLICATION, 2021–2028 (USD MILLION)
                    9.2.5.7 Norway
                               9.2.5.7.1 Accelerated development of large electrolyzer manufacturing for industrial applications
                               TABLE 58 NORWAY: MARKET, BY APPLICATION, 2021–2028 (USD MILLION)
                    9.2.5.8 Rest of Europe
                               TABLE 59 REST OF EUROPE: MARKET, BY APPLICATION, 2021–2028 (USD MILLION)
    9.3 NORTH AMERICA 
           FIGURE 34 NORTH AMERICA: ELECTROLYZERS MARKET SNAPSHOT
           9.3.1 NORTH AMERICA: RECESSION IMPACT
           9.3.2 NORTH AMERICA: ELECTROLYZERS PROJECT LIST
                    TABLE 60 NORTH AMERICA: ELECTROLYZERS PROJECT LIST
           9.3.3 BY TECHNOLOGY
                    TABLE 61 NORTH AMERICA: MARKET, BY TECHNOLOGY, 2021–2028 (USD MILLION)
           9.3.4 BY APPLICATION
                    TABLE 62 NORTH AMERICA: MARKET, BY APPLICATION, 2021–2028 (USD MILLION)
           9.3.5 BY COUNTRY
                    TABLE 63 NORTH AMERICA: MARKET, BY COUNTRY, 2021–2028 (KW)
                    TABLE 64 NORTH AMERICA: MARKET, BY COUNTRY, 2021–2028 (USD MILLION)
                    9.3.5.1 US
                               9.3.5.1.1 National hydrogen strategy to support market growth
                               TABLE 65 US: ELECTROLYZERS MARKET, BY APPLICATION, 2021–2028 (USD MILLION)
                    9.3.5.2 Canada
                               9.3.5.2.1 Presence of hydro-powered electrolyzer facilities
                               TABLE 66 CANADA: MARKET, BY APPLICATION, 2021–2028 (USD MILLION)
    9.4 ASIA PACIFIC 
           9.4.1 ASIA PACIFIC: RECESSION IMPACT
           9.4.2 ASIA PACIFIC: ELECTROLYZERS PROJECT LIST
                    TABLE 67 ASIA PACIFIC: ELECTROLYZERS PROJECT LIST
           9.4.3 BY TECHNOLOGY
                    TABLE 68 ASIA PACIFIC: ELECTROLYZERS MARKET, BY TECHNOLOGY, 2021–2028 (USD MILLION)
           9.4.4 BY APPLICATION
                    TABLE 69 ASIA PACIFIC: MARKET, BY APPLICATION, 2021–2028 (USD MILLION)
           9.4.5 BY COUNTRY
                    TABLE 70 ASIA PACIFIC: MARKET, BY COUNTRY, 2021–2028 (KW)
                    TABLE 71 ASIA PACIFIC: MARKET, BY COUNTRY, 2021–2028 (USD MILLION)
                    9.4.5.1 China
                               9.4.5.1.1 Construction of world’s largest electrolysis plants and lower cost/kW
                               TABLE 72 CHINA: ELECTROLYZERS MARKET, BY APPLICATION, 2021–2028 (USD MILLION)
                    9.4.5.2 Japan
                               9.4.5.2.1 Upcoming hydrogen refueling stations and hydrogen vehicles
                               TABLE 73 JAPAN: MARKET, BY APPLICATION, 2021–2028 (USD MILLION)
                    9.4.5.3 Australia
                               9.4.5.3.1 Maximum number of hydrogen projects under pipeline
                               TABLE 74 AUSTRALIA: MARKET, BY APPLICATION, 2021–2028 (USD MILLION)
                    9.4.5.4 Rest of Asia Pacific
                               TABLE 75 REST OF ASIA PACIFIC: ELECTROLYZERS MARKET, BY APPLICATION, 2021–2028 (USD MILLION)
    9.5 REST OF THE WORLD 
           9.5.1 REST OF THE WORLD: RECESSION IMPACT
           9.5.2 REST OF THE WORLD: ELECTROLYZERS PROJECT LIST
                    TABLE 76 REST OF THE WORLD: ELECTROLYZERS PROJECT LIST
           9.5.3 BY TECHNOLOGY
                    TABLE 77 REST OF THE WORLD: ELECTROLYZERS MARKET, BY TECHNOLOGY, 2021–2028 (USD MILLION)
           9.5.4 BY APPLICATION
                    TABLE 78 REST OF THE WORLD: MARKET, BY APPLICATION, 2021–2028 (USD MILLION)
           9.5.5 BY COUNTRY
                    TABLE 79 REST OF THE WORLD: MARKET, BY REGION, 2021–2028 (KW)
                    TABLE 80 REST OF THE WORLD: MARKET, BY REGION, 2021–2028 (USD MILLION)
                    9.5.5.1 Egypt
                               TABLE 81 EGYPT: ELECTROLYZERS MARKET, BY APPLICATION, 2021–2028 (USD MILLION)
                    9.5.5.2 Saudi Arabia
                               TABLE 82 SAUDI ARABIA: MARKET, BY APPLICATION, 2021–2028 (USD MILLION)
                    9.5.5.3 Other countries
                               TABLE 83 OTHER COUNTRIES: MARKET, BY APPLICATION, 2021–2028 (USD MILLION)
 
10 COMPETITIVE LANDSCAPE (Page No. - 124)
     10.1 OVERVIEW 
               FIGURE 35 KEY DEVELOPMENTS IN ELECTROLYZER MARKET, 2019–2023
     10.2 MARKET SHARE ANALYSIS OF KEY PLAYERS, 2021 
               TABLE 84 ELECTROLYZERS MARKET: DEGREE OF COMPETITION
               FIGURE 36 MARKET: DEGREE OF COMPETITION
               FIGURE 37 ELECTROLYZERS MARKET SHARE ANALYSIS OF TOP PLAYERS, 2021
     10.3 MARKET EVALUATION FRAMEWORK 
               TABLE 85 MARKET EVALUATION FRAMEWORK, 2019–2023
     10.4 SEGMENTAL REVENUE ANALYSIS OF TOP MARKET PLAYERS 
               FIGURE 38 SEGMENTAL REVENUE ANALYSIS, 2017–2022
     10.5 RECENT DEVELOPMENTS 
             10.5.1 DEALS
                       TABLE 86 ELECTROLYZERS MARKET: DEALS, 2019–2023
             10.5.2 PRODUCT LAUNCHES
                       TABLE 87 MARKET: PRODUCT LAUNCHES, 2019–2023
             10.5.3 OTHERS
                       TABLE 88 MARKET: OTHERS, 2019–2023
     10.6 KEY COMPANY EVALUATION QUADRANT, 2022 
             10.6.1 STARS
             10.6.2 EMERGING LEADERS
             10.6.3 PERVASIVE PLAYERS
             10.6.4 PARTICIPANTS
                       FIGURE 39 ELECTROLYZERS MARKET: KEY COMPANY EVALUATION QUADRANT, 2021
     10.7 COMPANY PRODUCT FOOTPRINT ANALYSIS 
               TABLE 89 TECHNOLOGY FOOTPRINT: KEY PLAYERS
               TABLE 90 APPLICATION FOOTPRINT: KEY PLAYERS
               TABLE 91 POWER RATING FOOTPRINT: KEY PLAYERS
               TABLE 92 REGION FOOTPRINT: KEY PLAYERS
     10.8 START-UPS/SMES EVALUATION QUADRANT, 2022 
             10.8.1 PROGRESSIVE COMPANIES
             10.8.2 RESPONSIVE COMPANIES
             10.8.3 DYNAMIC COMPANIES
             10.8.4 STARTING BLOCKS
                       FIGURE 40 MARKET: START-UPS/SMES EVALUATION QUADRANT, 2021
     10.9 COMPETITIVE BENCHMARKING 
               TABLE 93 ELECTROLYZERS MARKET: DETAILED LIST OF KEY START-UPS/SMES
               TABLE 94 TECHNOLOGY FOOTPRINT: START-UPS
               TABLE 95 APPLICATION FOOTPRINT: START-UPS
               TABLE 96 POWER RATING FOOTPRINT: START-UPS
               TABLE 97 REGION FOOTPRINT: START-UPS
 
11 COMPANY PROFILES (Page No. - 140)
(Business Overview, Products/Services/Solutions Offered, Recent Developments, and MnM View (Key strengths/Right to Win, Strategic Choices Made, and Weaknesses and Competitive Threats))*
     11.1 KEY PLAYERS 
             11.1.1 NEL ASA
                       TABLE 98 NEL ASA: BUSINESS OVERVIEW
                       FIGURE 41 NEL ASA: COMPANY SNAPSHOT
                       TABLE 99 NEL ASA: PRODUCT LAUNCHES
                       TABLE 100 NEL ASA: DEALS
                       TABLE 101 NEL ASA: OTHERS
             11.1.2 SIEMENS ENERGY
                       TABLE 102 SIEMENS ENERGY: BUSINESS OVERVIEW
                       FIGURE 42 SIEMENS ENERGY: COMPANY SNAPSHOT
                       TABLE 103 SIEMENS ENERGY: DEALS
                       TABLE 104 SIEMENS ENERGY: OTHERS
             11.1.3 PLUG POWER INC.
                       TABLE 105 PLUG POWER INC.: BUSINESS OVERVIEW
                       FIGURE 43 PLUG POWER INC.: COMPANY SNAPSHOT
                       TABLE 106 PLUG POWER INC.: DEALS
                       TABLE 107 PLUG POWER INC.: OTHERS
             11.1.4 ENAPTER S.R.L.
                       TABLE 108 ENAPTER S.R.L.: BUSINESS OVERVIEW
                       FIGURE 44 ENAPTER S.R.L.: COMPANY SNAPSHOT
                       TABLE 109 ENAPTER S.R.L.: PRODUCT LAUNCH
                       TABLE 110 ENAPTER S.R.L.: DEALS
                       TABLE 111 ENAPTER S.R.L.: OTHERS
             11.1.5 CUMMINS INC.
                       TABLE 112 CUMMINS INC.: BUSINESS OVERVIEW
                       FIGURE 45 CUMMINS INC.: COMPANY SNAPSHOT
                       TABLE 113 CUMMINS INC.: DEALS
                       TABLE 114 CUMMINS INC.: OTHERS
             11.1.6 ITM POWER PLC
                       TABLE 115 ITM POWER PLC: BUSINESS OVERVIEW
                       FIGURE 46 ITM POWER PLC: COMPANY SNAPSHOT
                       TABLE 116 ITM POWER PLC: DEALS
                       TABLE 117 ITM POWER PLC: OTHERS
             11.1.7 MCPHY ENERGY S.A.
                       TABLE 118 MCPHY ENERGY S.A.: BUSINESS OVERVIEW
                       FIGURE 47 MCPHY ENERGY S.A.: COMPANY SNAPSHOT
                       TABLE 119 MCPHY ENERGY S.A.: DEALS
                       TABLE 120 MCPHY ENERGY S.A.: OTHERS
             11.1.8 PERIC HYDROGEN TECHNOLOGIES CO., LTD
                       TABLE 121 PERIC HYDROGEN TECHNOLOGIES CO., LTD: BUSINESS OVERVIEW
                       TABLE 122 PERIC HYDROGEN TECHNOLOGIES CO., LTD.: DEALS
             11.1.9 BEIJING SINOHY ENERGY CO., LTD
                       TABLE 123 BEIJING SINOHY ENERGY CO., LTD.: BUSINESS OVERVIEW
                       TABLE 124 BEIJING SINOHY ENERGY CO., LTD.: DEALS
             11.1.10 LONGI
                       TABLE 125 LONGI: BUSINESS OVERVIEW
                       FIGURE 48 LONGI: COMPANY SNAPSHOT
                       TABLE 126 LONGI: DEALS
                       TABLE 127 LONGI: OTHERS
             11.1.11 COCKERILL JINGLI HYDROGEN
                       TABLE 128 COCKERILL JINGLI HYDROGEN: BUSINESS OVERVIEW
             11.1.12 H2E POWER
                       TABLE 129 H2E POWER: BUSINESS OVERVIEW
                       TABLE 130 H2E POWER: DEALS
             11.1.13 H-TEC SYSTEMS GMBH
                       TABLE 131 H-TEC SYSTEMS GMBH: BUSINESS OVERVIEW
                       TABLE 132 H-TEC SYSTEMS GMBH: PRODUCT LAUNCH
                       TABLE 133 H-TEC SYSTEMS GMBH: DEALS
                       TABLE 134 H-TEC SYSTEMS GMBH: OTHERS
             11.1.14 THYSSENKRUPP NUCERA
                       TABLE 135 THYSSENKRUPP NUCERA: BUSINESS OVERVIEW
                       TABLE 136 THYSSENKRUPP NUCERA: DEALS
             11.1.15 SUNFIRE GMBH
                       TABLE 137 SUNFIRE GMBH: BUSINESS OVERVIEW
                       TABLE 138 SUNFIRE GMBH: DEALS
                       TABLE 139 SUNFIRE GMBH: OTHERS
     11.2 OTHER COMPANIES 
             11.2.1 NEXT HYDROGEN
             11.2.2 ASAHI KASEI CORPORATION.
             11.2.3 BLOOM ENERGY
             11.2.4 OXEON ENERGY, LLC.
             11.2.5 GREEN HYDROGEN SYSTEMS
             11.2.6 ERRE DUE S.P.A.
             11.2.7 HYDROGENPRO
             11.2.8 IGAS ENERGY GMBH
             11.2.9 TOPSOE
*Details on Business Overview, Products/Services/Solutions Offered, Recent Developments, and MnM View (Key strengths/Right to Win, Strategic Choices Made, and Weaknesses and Competitive Threats) might not be captured in case of unlisted companies.
 
12 APPENDIX (Page No. - 199)
     12.1 INSIGHTS FROM INDUSTRY EXPERTS 
     12.2 DISCUSSION GUIDE 
     12.3 KNOWLEDGESTORE: MARKETSANDMARKETS' SUBSCRIPTION PORTAL 
     12.4 CUSTOMIZATION OPTIONS 
     12.5 RELATED REPORTS 
     12.6 AUTHOR DETAILS 

This study involved four major activities in estimating the current market size of the electrolyzers market. Exhaustive secondary research was done to collect information on the market, the peer market, and the parent market. The next step was to validate these findings, assumptions, and market sizing with industry experts across the value chain through rigorous primary research. Both top-down and bottom-up approaches were used to estimate the total market size. The market breakdown and data triangulation techniques were employed to estimate the market size of the segments and the corresponding subsegments.

Secondary Research

This research study involved the use of extensive secondary sources, directories, and databases such as industry publications, several newspaper articles, Statista Industry Journal, and UNESCO Institute of Statistics to identify and collect information useful for a technical, market-oriented, and commercial study of the utility communication market. The other secondary sources included annual reports, press releases & investor presentations of companies, white papers, certified publications, articles by recognized authors, manufacturer associations, trade directories, and databases.

Primary Research

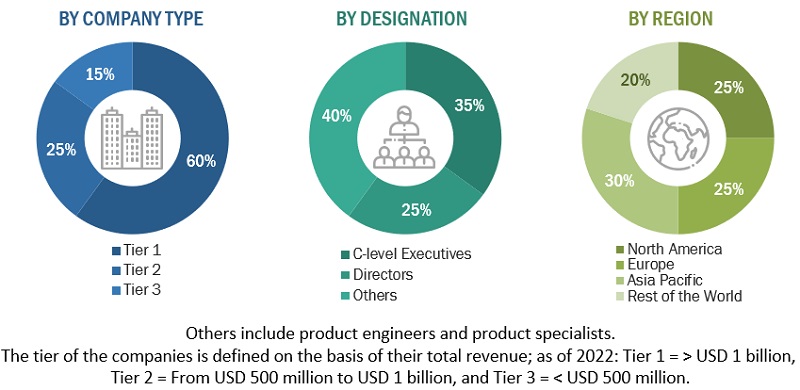
Primary sources included several industry experts from core and related industries, preferred suppliers, manufacturers, service providers, technology developers, and organizations related to all the segments of the electrolyzer industry. In-depth interviews were conducted with various primary respondents, including key industry participants, C-level executives, directors of the key market players, and industry consultants, among other experts, to obtain and verify qualitative and quantitative information, as well as to assess the prospects of the market. The breakdown of primary respondents is given below:
Electrolyzers Market Size, and Share

To know about the assumptions considered for the study, download the pdf brochure

Market Size Estimation

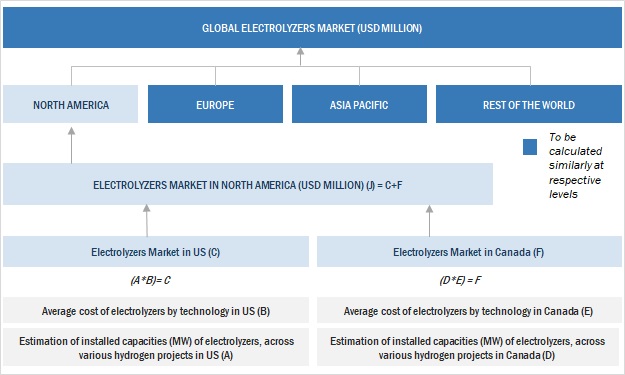
Both top-down and bottom-up approaches have been used to estimate and validate the size of the global electrolyzers market and its dependent submarkets. These methods were also extensively used to estimate the size of various subsegments in the market. The research methodology used to estimate the market size includes the following:

  • The key players in the industry and market have been identified through extensive secondary research, and their market shares in the respective regions have been determined through both primary and secondary research.
  • The industry’s supply chain and market size, in terms of value, have been determined through primary and secondary research processes.
  • All percentage shares, splits, and breakdowns have been determined using secondary sources and verified through primary sources.

Global Electrolyzers Market Size: Bottom-Up Approach
Electrolyzers Market Size, and Share

To know about the assumptions considered for the study, Request for Free Sample Report

Data Triangulation

After arriving at the overall market size—using the market size estimation processes as explained above—the market was split into several segments and subsegments. To complete the entire market engineering process and arrive at the exact statistics of each market segment and subsegment, the data triangulation, and market breakdown procedures were employed, wherever applicable. The data was triangulated by studying various factors and trends from both the demand and supply sides in the electrolyzer market.

Objectives of the Study

  • To forecast and describe the electrolyzers market size, by technology, application, and region, in terms of value
  • To provide detailed information regarding the major drivers, restraints, opportunities, and challenges influencing the growth of the market
  • To estimate the size of the market in terms of value
  • To strategically analyze micro markets with respect to individual growth trends, prospects, future expansions, and contributions to the overall market
  • To provide post-pandemic estimation for the market and analyze the impact of the pandemic on the overall market and value chain
  • To forecast the growth of the market with respect to four major regions, namely, Europe, Asia Pacific, North America, and Rest of the World
  • To analyze market opportunities for stakeholders and the competitive landscape for market leaders
  • To strategically profile key players and comprehensively analyze their respective market shares and core competencies
  • To analyze competitive developments such as investments & expansions, contracts & agreements, and joint ventures & collaborations in the electrolyzers market

Available Customizations:

With the given market data, MarketsandMarkets offers customizations according to your specific needs. The following customization options are available for the report:

Company Information

  • Product Matrix, which provides a detailed comparison of the product portfolio of each company

Company Information

  • Detailed analysis and profiling of additional market players 
Custom Market Research Services

We will customize the research for you, in case the report listed above does not meet with your exact requirements. Our custom research will comprehensively cover the business information you require to help you arrive at strategic and profitable business decisions.

Request Customization

Instant Answers with GPT - Ask Now!

Ask real questions. Get complete answers !
Report Code
EP 8577
Published ON
Feb, 2023
Choose License Type
BUY NOW
  • SHARE
X
Request Customization
Speak to Analyst
Speak to Analyst
OR FACE-TO-FACE MEETING
PERSONALIZE THIS RESEARCH
  • Triangulate with your Own Data
  • Get Data as per your Format and Definition
  • Gain a Deeper Dive on a Specific Application, Geography, Customer or Competitor
  • Any level of Personalization
REQUEST A FREE CUSTOMIZATION
LET US HELP YOU!
  • What are the Known and Unknown Adjacencies Impacting the Electrolyzers Market
  • What will your New Revenue Sources be?
  • Who will be your Top Customer; what will make them switch?
  • Defend your Market Share or Win Competitors
  • Get a Scorecard for Target Partners
CUSTOMIZED WORKSHOP REQUEST
+1-888-600-6441
  • Call Us
  • +1-888-600-6441 (Corporate office hours)
  • +1-888-600-6441 (US/Can toll free)
  • +44-800-368-9399 (UK office hours)
CONNECT WITH US
ABOUT TRUST ONLINE
©2023 MarketsandMarkets Research Private Ltd. All rights reserved
DMCA.com Protection Status Website Feedback