
Feed Phosphates Market by Type (Dicalcium, Monocalcium, Mono-dicalcium, Defluorinated, and Tricalcium), Livestock (Ruminants, Swine, Poultry, and Aquaculture), Form (Powder and Granule), and Region - Global Forecast to 2028
Market Segmentation
| Report Metrics | Details |
|
Market size available for years |
2018 - 2024 |
|
CAGR % |
3.7 |
Top 10 companies in Feed Phosphates Market


Speak to Analyst to get the Global Forecasts Data up to 2028
[159 Pages Report] Feed phosphates are defined as inorganic salts of phosphoric acid that are extracted from the phosphate rock. These phosphates are an essential nutrient in animal diets, ensuring optimal growth, improving gut functionality, fertility, and aiding bone development. Feed phosphates are often provided to animals in conjunction with calcium and magnesium, which further aid the growth and development of animals.
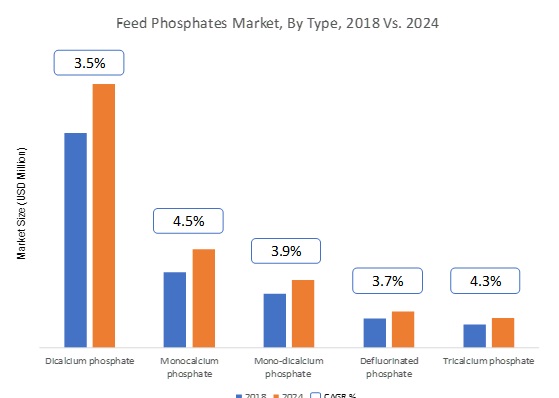
Feed phosphates are used as supplements for the diets of livestock, such as poultry, swine, cattle, and aquatic animals. They help animals attain faster growth, including weight gain. Feed phosphates optimize the nutritional value of feed and further enhance the quality of meat and dairy. For instance, optimized tenderness in meat, high selenium content in eggs, and high calcium content in milk are some examples of consumer-driven beneficial modifications in livestock products, which are brought about by the addition of feed phosphates. The major types of feed phosphates used are dicalcium phosphate (DCP) and monocalcium phosphate (MCP), which hold a majority of the market share. Other types of feed phosphates include mono-dicalcium phosphate, tricalcium phosphate, and defluorinated phosphate.
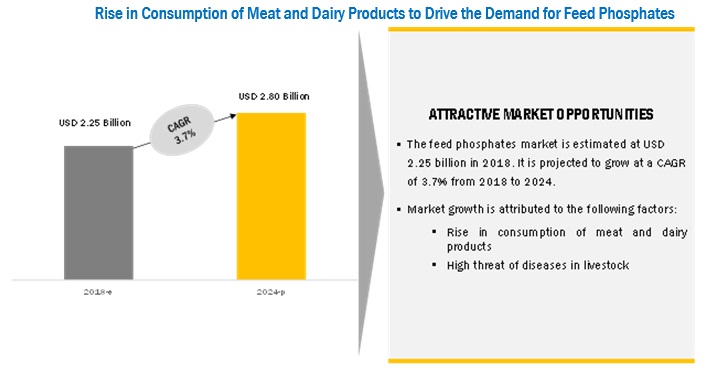
The feed phosphates market is projected to grow at a CAGR of 3.7% during the forecast period (2018–2024), to reach a value of USD 2.80 billion by 2024. Amongst various feed phosphate types, monocalcium feed phosphate is expected to grow at the highest rate during the forecast period. The purified form of monocalcium phosphate is obtained by the reaction of calcium hydroxide with wet process phosphoric acid. Highly soluble and easy to handle, it can be used in mixed feed and minerals. Its usage in feed enhances the reproduction cycle of animals, in addition to the prevention of abnormal development of bones. Furthermore, MCP has the highest digestible phosphorus content of ~80%, which is the major reason why many feed manufacturers and producers are beginning to switch from DCP to MCP. The high solubility and optimal phosphorus concentration of MCP offer increased flexibility in dietary formulations.
Monocalcium phosphate projected to be the fastest-growing type market for feed phosphates from 2018 to 2024
The monocalcium phosphate segment is projected to grow at the highest CAGR during the forecast period. Monocalcium phosphate has the highest digestible phosphorus content, which is the main reason why many feed manufacturers and producers are beginning to switch from DCP to MCP. The high solubility and optimal phosphorus concentration of MCP also offer increased flexibility in dietary formulations.
The poultry segment is projected to be the fastest-growing for feed phosphates from 2018 to 2024.
The feed phosphates market, by livestock, is estimated to be dominated by the poultry segment in 2018. It is also projected to be the fastest growing through 2024. On a global level, the total poultry production has been increasing; with such growth in poultry production and consumption, it has become important for meat producers to focus more on quality. Poultry requires relatively large amounts of calcium and phosphorus for normal growth and skeletal development, which gives a boost to the feed phosphates consumption.
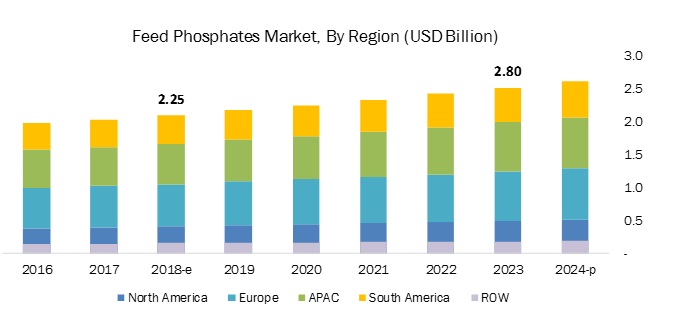
Europe is set to lead the feed phosphate market with the largest share in 2018.
The European market is estimated to be the largest in 2018. The market in the region is driven by the consumption of feed phosphates, as this is a major livestock producer. Meat stands as one of the important segments of the European agricultural sector. The policies formed by the EU encourage animal producers to use healthy and nutrient-rich feed additives and balance their impact of production on the environment thus driving the growth of the feed phosphates market. The South American market is projected to grow at the highest CAGR from 2018 to 2024. The annual livestock production in this region has increased, subsequently driving the demand for compound feed. The rapid expansion of the livestock industry in the region has resulted in a steady import of feed phosphates. Several product developments by market players in the region, along with the increased use of compound feed, are expected to drive the market for feed phosphates.
Market Dynamics
Driver: High threat of diseases in livestock
The outbreak of diseases such as avian flu, BSE (bovine spongiform encephalopathy), and SARS (severe acute respiratory syndrome) not only affect livestock breeding and the economy, but also pose a serious threat to human health. The emergence of swine diarrhea in the US caused significant losses to swine farmers. Moreover, countries such as China, India, and Indonesia are constantly facing outbreaks of avian flu and swine flu, due to the hot and humid climatic conditions. Meat vendors, meat processors, wholesalers, retailers, and ultimately livestock growers suffer financial losses, due to the culling of disease-affected animals, which further lead to a drop in animal productivity. The usage of feed phosphates in such cases proved to be an effective medium to reduce such outbreaks by improving animal health with the provision of necessary nutrients. Calcium and phosphorus are two important macro-minerals required for the proper performance, growth, health, and production of livestock.
Restraint: Phytase – High Cost of Phosphates Driving the Demand for Substitutes
The high cost of phosphate salts, such as monocalcium and dicalcium phosphates, has led to the increase in the usage of substitutes such as phytase, which is lower in cost and can be used as a means of controlling the overall feed cost. According to Danisco Animal Nutrition (UK), the feed division of E. I. du Pont de Nemours and Company (US), phytase is included in more than 90% of poultry diets and about 70% of swine diets. According to the same source, phytase has helped the feed industry to reduce feed input and nutritional costs by USD 2 billion per annum.
Apart from being comparatively cost-effective, the usage of phytase in feed has many advantages and fulfils various functionalities of feed phosphates, such as enhancing digestive processes, improving bone health, accentuating body weight, and breaking down indigestible phytic acid (found in grains and oilseeds), thus aiding the release of digestible phosphorus, calcium, and other nutrients that help the growth of animals. Further, phytase promotes higher feed intake when compared to feed phosphates, which help in the physical development of animals, leading to better performance.
Therefore, the market for feed phosphates is expected to experience a moderate growth rate, owing to a number of innovations that are expected to aid market production and supply. However, diversions in the consumption and usage of feed phosphates due to the advent of substitutes, such as phytase, are expected to disrupt the market growth during the forecast period.
Opportunity: Phosphorous Recovery from Fly Ash – Sustainable Sourcing of Phosphorous
Most companies in the feed phosphates market have similar kinds of products and use the same kind of production process to produce feed phosphate from phosphate rock, which is a finite resource. However, to ensure a sustainable supply of good quality phosphates for the feed industry, market players need to invest in their R&D and come up with innovative production processes and alternative sources of phosphorus. In recent years, there has been a significant number of innovations in phosphorus recovery technology. Various methods can be applied for phosphorus recovery, including chemical precipitation, biological phosphorus removal, crystallization, and novel chemical precipitation approach, the latest among them being the wet-chemical process using fly ash.
A number of efforts are undertaken to recycle the phosphorus contained in wastewater, sewage sludge as well as from the fly ash of incinerated sewage sludge. Such innovations in production processes and newer raw materials are likely to reduce the dependence on phosphate rock, thereby reducing feed phosphate prices. For instance, EcoPhos (Belgium) developed a wet-chemical process to recover phosphorus from fly ash. The company invested about USD 90 million to build a new animal feed-grade DCP production plant with an annual capacity of 220 KT. This plant incorporates the new process to treat ~50 to 60,000 MT of fly ash
Challenge: Toxicity of feed phosphates
Despite feed phosphates being used as a key component to maintain animal health and productivity, their usage above certain limits could be toxic to animals. For instance, excessive intake of phosphorus can interfere with both calcium and magnesium absorption. Excessive calcium intake by consuming dicalcium phosphate, monocalcium phosphate, mono-dicalcium phosphate, and tricalcium phosphate can lead to osteopetrosis, vertebral ankyloses, and degenerative osteoarthritis in cattle. It also results in reduced feed intake, resulting in lower milk yields in cattle. However, because mineral deficiencies in animals are more common occurrences in comparison to toxicities, there is a general tendency to easily exceed minimum animal requirements. In such cases, it becomes imperative to determine if dietary mineral concentrations exceed the maximum tolerance levels of the cattle. Mineral toxicities, which could be a result of excessive consumption of feed or water, may then have significant degrading effects on animal health and performance.
Get online access to the report on the World's First Market Intelligence Cloud
- Easy to Download Historical Data & Forecast Numbers
- Company Analysis Dashboard for high growth potential opportunities
- Research Analyst Access for customization & queries
- Competitor Analysis with Interactive dashboard
- Latest News, Updates & Trend analysis
Request Sample Scope of the Report
Get online access to the report on the World's First Market Intelligence Cloud
- Easy to Download Historical Data & Forecast Numbers
- Company Analysis Dashboard for high growth potential opportunities
- Research Analyst Access for customization & queries
- Competitor Analysis with Interactive dashboard
- Latest News, Updates & Trend analysis

|
Report Metric |
Details |
|
Market size available for years |
2016–2024 |
|
Base year considered |
2017 |
|
Forecast period |
2018–2024 |
|
Forecast units |
Million (USD) |
|
Segments covered |
Type (Dicalcium phosphate, monocalcium phosphate, mono-dicalcium phosphate, defluorinated phosphate, tricalcium phosphate), Livestock (Poultry, swine, ruminants, and aquaculture), Form, and Region |
|
Geographies covered |
North America, Europe, APAC, RoW, and South America |
|
Companies covered |
The Mosaic Company (US), Phosphea (France), Nutrien Ltd. (Canada), OCP Group (Morocco), Yara International ASA (Norway), EuroChem Group AG (Switzerland), PhosAgro (Russia), Ecophos Group (Belgium), Fosfitalia Group (Italy), J. R. Simplot Company (US), Quimpac S.A. (Peru), Sichuan Lomon Corporation (China), Sinochem Yunlong Co., Ltd. (China), Wengfu Group (China), Rotem Turkey (Turkey) |
The research report categorizes the feed phosphate market to forecast the revenues and analyze the trends in each of the following sub-segments:
Based on type, the market has been segmented as follows:
- Dicalcium phosphates
- Monocalcium phosphates
- Mono-dicalcium phosphate
- Tricalcium phosphate
- Defluorinated phosphate
- Others (sodium phosphate, ammonium phosphate, and magnesium phosphate)
Based on livestock, the market has been segmented as follows:
- Poultry
- Swine
- Ruminants
- Aquaculture
- Others (pets and equine)
Based on form, the market has been segmented as follows:
- Powder
- Granule
Based on region, the market has been segmented as follows:
- North America
- Europe
- Asia Pacific
- South America
- RoW (the Middle East, and Africa)
Key Market Players
The Mosaic Company (US), Phosphea (France), Nutrien Ltd. (Canada), OCP Group (Morocco), Yara International ASA (Norway), EuroChem Group AG (Switzerland), PhosAgro (Russia), Ecophos Group (Belgium), Fosfitalia Group (Italy), J. R. Simplot Company (US), Quimpac S.A. (Peru), Sichuan Lomon Corporation (China), Sinochem Yunlong Co., Ltd. (China), Wengfu Group (China), Rotem Turkey (Turkey).
Recent Developments
- In March 2018, The Mosaic Company acquired the Vale Fertilizantes (a Brazilian fertilizer company that has five phosphate mines), thereby enhancing the company’s market access in the Brazilian feed phosphates market.
- In January 2018, Agrium (Canada) and Potash Corporation of Saskatchewan Inc. (Canada), merged together to form a new company by the name of Nutrien Ltd.; this helped in synergizing the assets of both the companies.
- In November 2017, EuroChem Group AG announced the official inauguration of its new subsidiary in Bulgaria, known as EuroChem Agro Bulgaria. This move was expected to expand its distribution footprint in the country and more widely in the south of Eastern Europe.
- In October 2014, Ecophos Group signed an MoU with the authority of the Grand Port Maritime de Dunkerque (France) to build a new dicalcium feed phosphate production plant in France as part of its development strategy in Europe.
- In November 2017, after the acquisition of Vale Fertilizantes (Brazil), The Mosaic Company also acquired Vale’s 45% ownership of the Miski Mayo (Peru), a phosphate mining company, in which it already had 30% ownership, making it the majority owner and operating partner of the joint venture with Mitsu (Japan).
- In October 2016, Ecophos Group signed a joint venture agreement with the Evergrow (Egypt), a specialty fertilizer and acid manufacturing company, to build a 110 KT/year dicalcium phosphate (DCP) factory to produce animal feed in Sadat City (Egypt). This joint venture was expected to serve the local and regional demand for feed phosphates.
Critical questions the report answers:
- Where will all these developments take the industry in the long term?
- What are the upcoming trends for the feed phosphates market?
- Which segment provides the most opportunity for growth?
- Who are the leading vendors operating in this market?
- What are the opportunities for new market entrants?
To speak to our analyst for a discussion on the above findings, click Speak to Analyst
The feed phosphates market was valued at USD 2.18 billion in 2017; this is projected to reach 2.80 billion by 2024, at a CAGR of 3.7% during the forecast period. The rise in consumption of meat & dairy products and high threat of diseases in livestock are the factors driving this market.
The periodization considered for the study is as follows:
- Base year: 2017
- Forecast period: 2018 to 2024
The objectives of the report
- Determining and projecting the size of the feed phosphate market with respect to type, livestock, form, and regional markets, over a six-year period ranging from 2018 to 2024
- Identifying attractive opportunities in the market by determining the largest and fastest-growing segments across regions
- To provide detailed information about the key factors influencing the growth of the market (drivers, restraints, opportunities, and industry-specific challenges)
- To analyze micromarkets with respect to individual growth trends, future prospects, and their contribution to the total market
- Identifying and profiling key players in the feed phosphates market
-
Providing a comparative analysis of market leaders on the basis of the following:
- Product offerings
- Business strategies
- Strengths, weaknesses, opportunities, and threats
- Key financials
- Understanding the competitive landscape and identifying major growth strategies adopted by players across the key regions
- Analyzing the supply chain, products, and regulatory frameworks across regions and their impact on the prominent market players
- Providing insights on key innovations and investments in the feed phosphate market
Research Methodology:
- The key regions were identified, along with countries contributing the maximum share
- Secondary research was conducted to find the value of feed phosphates for regions such as North America, Europe, Asia Pacific, South America, and RoW
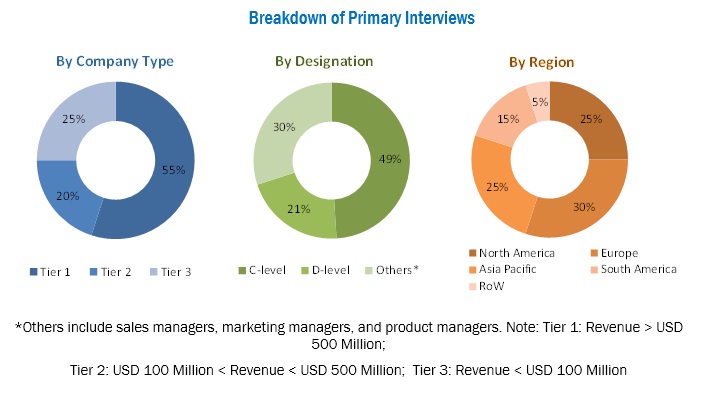
- The key players were identified through secondary sources such as the Food and Agriculture Organization (FAO), the US Department of Agriculture (USDA), International Monetary Fund (IMF), World Bank, and Organisation for Economic Co-operation and Development (OECD), while their market share in the respective regions were determined through both, primary and secondary research processes. The research methodology included the study of annual and financial reports of top market players, as well as interviews with industry experts (such as CEOs, VPs, directors, and marketing executives) for key insights (both quantitative and qualitative) for the feed phosphates market.
To know about the assumptions considered for the study, download the pdf brochure
The various contributors involved in the value chain of the feed phosphates market include raw material suppliers, R&D institutes, feed phosphate manufacturing companies [such as The Mosaic Company (US), Phosphea (France), Nutrien Ltd. (Canada), OCP Group (Morocco), Yara International ASA (Norway)], feed phosphate distributors, livestock producers, feed manufacturers, and government bodies & regulatory associations [such as the US Department of Agriculture (USDA), the Food and Drug Administration (FDA), and the European Food Safety Authority (EFSA)].
Target Audience
The stakeholders for the report are as follows:
- Feed manufacturers, processors, traders, and distributors
- Animal husbandry companies
- Large-scale ranches and poultry farms
- R&D institutes
- Regulatory bodies
- Organizations such as the International Feed Industry Federation (IFIF)
- Associations and industry bodies such as The Association of American Feed Control Officials (AAFCO)
- Government agencies and NGOs
- Food safety agencies
- Financial institutions, importers, and exporters of feed phosphate ingredients and sources
- Feed & feed additive manufacturers
- Trade associations and industry bodies
- Importers and exporters of feed and feed additives
Available Customizations
With the given market data, MarketsandMarkets offers customizations according to the company’s specific scientific needs.
The following customization options are available for the report:
Product Analysis
- Product matrix, which gives a detailed comparison of product portfolio of each company
Geographic Analysis
- Further breakdown of the Rest of Asia Pacific feed phosphate market, by key country
- Further breakdown of the Rest of Europe feed phosphates market, by key country
Company Information
- · Detailed analyses and profiling of additional market players (up to five)
Table of Contents
1 Introduction (Page No. - 15)
1.1 Objectives of the Study
1.2 Market Definition
1.3 Study Scope
1.3.1 Markets Covered
1.3.2 Geographic Segmentation
1.4 Periodization Considered
1.5 Currency Considered
1.6 Units Considered
1.7 Stakeholders
2 Research Methodology (Page No. - 20)
2.1 Research Data
2.1.1 Secondary Data
2.1.1.1 Key Data From Secondary Sources
2.1.2 Primary Data
2.1.2.1 Key Data From Primary Sources
2.1.2.2 Breakdown of Primaries
2.2 Market Size Estimation
2.3 Data Triangulation
2.4 Research Assumptions & Limitations
3 Executive Summary (Page No. - 28)
4 Premium Insights (Page No. - 32)
4.1 Attractive Opportunities in the Market
4.2 Market, By Key Country
4.3 Asia Pacific: Feed Phosphate Market, By Type & Key Country
4.4 Market, By Form & Region
4.5 Market, By Livestock & Region
5 Market Overview (Page No. - 35)
5.1 Introduction
5.2 Market Dynamics
5.3 Drivers
5.3.1 Rise in Consumption of Meat and Dairy Products
5.3.2 High Threat of Diseases in Livestock
5.4 Restraints
5.4.1 Fluctuating Prices of Phosphate
5.4.2 Increase in Usage of Substitutes Such as Phytase
5.5 Opportunities
5.5.1 Innovation in Technology, New Raw Materials, and Production Process
5.6 Challenges
5.6.1 Toxicity of Feed Phosphates
5.7 Value Chain Analysis
5.8 Regulatory Framework
5.9 US
5.10 European Union
5.11 China
5.12 Japan
5.13 India
6 Feed Phosphates Market, By Type (Page No. - 44)
6.1 Introduction
6.2 Dicalcium Phosphate
6.3 Monocalcium Phosphate
6.4 Mono-Dicalcium Phosphate
6.5 Defluorinated Phosphate
6.6 Tricalcium Phosphate
6.7 Others
7 Feed Phosphate Market, By Livestock (Page No. - 54)
7.1 Introduction
7.2 Poultry
7.3 Swine
7.4 Ruminants
7.5 Aquaculture
7.6 Others
8 Feed Phosphates Market, By Form (Page No. - 65)
8.1 Introduction
8.2 Powder
8.3 Granule
9 Feed Phosphate Market, By Region (Page No. - 70)
9.1 Introduction
9.2 Europe
9.2.1 France
9.2.2 Germany
9.2.3 Spain
9.2.4 Russia
9.2.5 UK
9.2.6 Italy
9.2.7 Rest of Europe
9.3 Asia Pacific
9.3.1 China
9.3.2 India
9.3.3 Japan
9.3.4 Australia
9.3.5 Rest of Asia Pacific
9.4 South America
9.4.1 Brazil
9.4.2 Argentina
9.4.3 Rest of South America
9.5 North America
9.5.1 US
9.5.2 Mexico
9.5.3 Canada
9.6 Rest of the World (RoW)
9.6.1 Middle East
9.6.2 Africa
10 Competitive Landscape (Page No. - 123)
10.1 Overview
10.2 Competitive Scenario
10.3 Market Share Analysis
10.4 Mergers & Acquisitions
10.5 Expansions
10.6 Joint Ventures & Agreements
11 Company Profiles (Page No. - 127)
(Business Overview, Products Offered, Recent Developments, SWOT Analysis, MnM View)*
11.1 The Mosaic Company
11.2 Nutrien Ltd.
11.3 OCP Group
11.4 Yara International ASA
11.5 Eurochem Group AG
11.6 Phosagro
11.7 Phosphea
11.8 Ecophos Group
11.9 Fosfitalia Group
11.10 J.R. Simplot Company
11.11 Quimpac S.A.
11.12 Sichuan Lomon Corporation
11.13 Sinochem Yunlong Co., Ltd.
11.14 Wengfu Group
11.15 Rotem Turkey
“ * The companies listed are a representative sample of the market’s ecosystem and in no particular order”
*Details on Business Overview, Products Offered, Recent Developments, SWOT Analysis, MnM View Might Not Be Captured in Case of Unlisted Companies.
12 Appendix (Page No. - 152)
12.1 Discussion Guide
12.2 Knowledge Store: Marketsandmarkets’ Subscription Portal
12.3 Introducing RT: Real-Time Market Intelligence
12.4 Available Customizations
12.5 Related Reports
12.6 Author Details
List of Tables (126 Tables)
Table 1 US Dollar Exchange Rate Considered for the Study, 2015–2017
Table 2 Market Snapshot, By Volume, 2018 vs 2024
Table 3 Per Capita Consumption of Meat and Milk & Dairy Products, 1997–2030
Table 4 Feed Phosphate Market Size, By Type, 2016–2024 (USD Million)
Table 5 Feed Phosphates Market Size, By Type, 2016–2024 (KT)
Table 6 Dicalcium Phosphate Market Size, By Region, 2016–2024 (USD Million)
Table 7 Dicalcium Phosphate Market Size, By Region, 2016–2024 (KT)
Table 8 Monocalcium Phosphate Market Size, By Region, 2016–2024 (USD Million)
Table 9 Monocalcium Phosphate Market Size, By Region, 2016–2024 (KT)
Table 10 Mono-Dicalcium Phosphate Market Size, By Region, 2016–2024 (USD Million)
Table 11 Mono-Dicalcium Phosphate Market Size, By Region, 2016–2024 (KT)
Table 12 Defluorinated Phosphate Market Size, By Region, 2016–2024 (USD Million)
Table 13 Defluorinated Phosphate Market Size, By Region, 2016–2024 (KT)
Table 14 Tricalcium Phosphate Market Size, By Region, 2016–2024 (USD Million)
Table 15 Tricalcium Phosphate Market Size, By Region, 2016–2024 (KT)
Table 16 Other Feed Phosphates Market Size, By Region, 2016–2024 (USD Million)
Table 17 Other Feed Phosphates Market Size, By Region, 2016–2024 (KT)
Table 18 Feed Phosphates Market Size, By Livestock, 2016–2024 (USD Million)
Table 19 Market Size, By Livestock, 2016–2024 (KT)
Table 20 Poultry: Feed Phosphates Market Size, By Region, 2016–2024 (USD Million)
Table 21 Poultry: Market Size, By Region, 2016–2024 (KT)
Table 22 Poultry: Market Size, By Type, 2016-2024 (USD Million)
Table 23 Poultry: Market Size, By Type, 2016-2024 (KT)
Table 24 Swine: Feed Phosphate Market Size, By Region, 2016–2024 (USD Million)
Table 25 Swine: Market Size, By Region, 2016–2024 (KT)
Table 26 Swine: Market Size, By Type, 2016-2024 (USD Million)
Table 27 Swine: Market Size, By Type, 2016-2024 (KT)
Table 28 Ruminants: Feed Phosphates Market Size, By Region, 2016–2024 (USD Million)
Table 29 Ruminants: Market Size, By Region, 2016–2024 (KT)
Table 30 Ruminants: Market Size, By Type, 2016-2024 (USD Million)
Table 31 Ruminants: Market Size, By Type, 2016-2024 (KT)
Table 32 Aquaculture: Market Size, By Region, 2016–2024 (USD Million)
Table 33 Aquaculture: Market Size, By Region, 2016–2024 (KT)
Table 34 Other Livestock: Market Size, By Region, 2016–2024 (USD Million)
Table 35 Other Livestock: Market Size, By Region, 2016–2024 (KT)
Table 36 Feed Phosphate Market Size, By Form, 2016–2024 (USD Million)
Table 37 Market Size, By Form, 2016–2024 (KT)
Table 38 Powdered Feed Phosphates Market Size, By Region, 2016–2024 (USD Million)
Table 39 Powdered Feed Phosphate Market Size, By Region, 2016–2024 (KT)
Table 40 Granular Feed Phosphates Market Size, By Region, 2016–2024 (USD Million)
Table 41 Granular Feed Phosphate Market Size, By Region, 2016–2024 (KT)
Table 42 Feed Phosphates Market Size, By Region, 2016–2024 (USD Million)
Table 43 Market Size, By Region, 2016–2024 (KT)
Table 44 Europe: Feed Phosphates Market Size, By Country, 2016–2024 (USD Million)
Table 45 Europe: Market Size, By Country, 2016–2024 (KT)
Table 46 Europe: Market Size, By Type, 2016–2024 (USD Million)
Table 47 Europe: Market Size, By Type, 2016–2024 (KT)
Table 48 Europe: Feed Phosphates Market Size, By Livestock, 2016–2024 (USD Million)
Table 49 Europe: Market Size, By Livestock, 2016–2024 (KT)
Table 50 Europe: Market Size, By Form, 2018-2024 (USD Million)
Table 51 Europe: Feed Phosphates Market Size, By Form, 2016–2024 (KT)
Table 52 France: Market Size, By Type, 2016–2024 (USD Million)
Table 53 France: Market Size, By Type, 2016–2024 (KT)
Table 54 Germany: Market Size, By Type, 2016–2024 (USD Million)
Table 55 Germany: Market Size, By Type, 2016–2024 (KT)
Table 56 Spain: Feed Phosphates Market Size, By Type, 2016–2024 (USD Million))
Table 57 Spain: Market Size, By Type, 2016–2024 (KT)
Table 58 Russia: Market Size, By Type, 2016–2024 (USD Million)
Table 59 Russia: Market Size, By Type, 2016–2024 (KT)
Table 60 UK: Feed Phosphates Market Size, By Type, 2016–2024 (USD Million)
Table 61 UK: Market Size, By Type, 2016–2024 (KT)
Table 62 Italy: Market Size, By Type, 2016–2024 (USD Million)
Table 63 Italy: Market Size, By Type, 2016–2024 (KT)
Table 64 Rest of Europe: Market Size, By Type, 2016–2024 (USD Million)
Table 65 Rest of Europe: Market Size, By Type, 2016–2024 (KT)
Table 66 Asia Pacific: Feed Phosphate Market Size, By Country, 2016–2024 (USD Million)
Table 67 Asia Pacific: Market Size, By Country, 2016–2024 (KT)
Table 68 Asia Pacific: Market Size, By Type, 2016–2024 (USD Million)
Table 69 Asia Pacific: Market Size, By Type, 2016–2024 (KT)
Table 70 Asia Pacific: Market Size, By Livestock, 2016–2024 (USD Million)
Table 71 Asia Pacific: Market Size, By Livestock, 2018-2024 (KT)
Table 72 Asia Pacific: Market Size, By Form, 2016–2024 (USD Million)
Table 73 Asia Pacific: Feed Phosphates Market Size, By Form, 2018-2024 (KT)
Table 74 China: Market Size, By Type, 2016–2024 (USD Million)
Table 75 China: Market Size, By Type, 2016–2024 (KT)
Table 76 India: Market Size, By Type, 2016–2024 (USD Million)
Table 77 India: Market Size, By Type, 2016–2024 (KT)
Table 78 Japan: Market Size, By Type, 2016–2024 (USD Million)
Table 79 Japan: Market Size, By Type, 2016–2024 (KT)
Table 80 Australia: Feed Phosphates Market Size, By Type, 2016–2024 (USD Million)
Table 81 Australia: Market Size, By Type, 2016–2024 (KT)
Table 82 Rest of Asia Pacific: Market Size, By Type, 2016–2024 (USD Million)
Table 83 Rest of Asia Pacific: Market Size, By Type, 2016–2024 (KT)
Table 84 South America: Feed Phosphate Market Size, By Country, 2016–2024 (USD Million)
Table 85 South America: Market Size, By Country, 2016–2024 (KT)
Table 86 South America: Market Size, By Type, 2016–2024 (USD Million)
Table 87 South America: Market Size, By Type, 2016–2024 (KT)
Table 88 South America: Market Size, By Livestock, 2016–2024 (USD Million)
Table 89 South America: Market Size, By Livestock, 2016–2024 (KT)
Table 90 South America: Market Size, By Form, 2016–2024 (USD Million)
Table 91 South America: Market Size, By Form, 2016–2024 (KT)
Table 92 Brazil: Feed Phosphates Market Size, By Type, 2016–2024 (USD Million)
Table 93 Brazil: Market Size, By Type, 2016–2024 (KT)
Table 94 Argentina: Market Size, By Type, 2016–2024 (USD Million)
Table 95 Argentina: Market Size, By Type, 2016–2024 (KT)
Table 96 Rest of South America: Market Size, By Type, 2016–2024 (USD Million)
Table 97 Rest of South America: Market Size, By Type, 2016–2024 (KT)
Table 98 North America: Feed Phosphate Market Size, By Country, 2016–2024 (USD Million)
Table 99 North America: Market Size, By Country, 2016–2024 (KT)
Table 100 North America: Market Size, By Type, 2016–2024 (USD Million)
Table 101 North America: Market Size, By Type, 2016–2024 (KT)
Table 102 North America: Market Size, By Livestock, 2016–2024 (USD Million)
Table 103 North America: Market Size, By Livestock, 2016–2024 (KT)
Table 104 North America: Market Size, By Form, 2016–2024 (USD Million)
Table 105 North America: Market Size, By Form, 2016–2024 (KT)
Table 106 US: Feed Phosphates Market Size, By Type, 2016–2024 (USD Million)
Table 107 US: Market Size, By Type, 2016–2024 (KT)
Table 108 Mexico: Market Size, By Type, 2016–2024 (USD Million)
Table 109 Mexico: Market Size, By Type, 2016–2024 (KT)
Table 110 Canada: Market Size, By Type, 2016–2024 (USD Million)
Table 111 Canada: Market Size, By Type, 2016–2024 (KT)
Table 112 RoW: Feed Phosphates Market Size, By Region, 2016–2024 (USD Million)
Table 113 RoW: Market Size, By Region, 2016–2024 (KT)
Table 114 RoW: Market Size, By Type, 2016–2024 (USD Million)
Table 115 RoW: Market Size, By Type, 2016–2024 (KT)
Table 116 RoW: Market Size, By Livestock, 2016–2024 (USD Million)
Table 117 RoW: Market Size, By Livestock, 2016–2024 (KT)
Table 118 RoW: Market Size, By Form, 2016–2024 (USD Million)
Table 119 RoW: Market Size, By Form, 2016–2024 (KT)
Table 120 Middle East: Feed Phosphates Market Size, By Type, 2016–2024 (USD Million)
Table 121 Middle East: Market Size, By Type, 2016–2024 (KT)
Table 122 Africa: Feed Phosphates Market Size, By Type, 2016–2024 (USD Million)
Table 123 Africa: Market Size, By Type, 2016–2024 (KT)
Table 124 Mergers & Acquisitions, 2013–2018
Table 125 Expansions, 2013–2018
Table 126 Joint Ventures & Agreements, 2013–2018
List of Figures (37 Figures)
Figure 1 Market Snapshot
Figure 2 Market, By Region
Figure 3 Market: Research Design
Figure 4 Market Size Estimation Methodology: Bottom-Up Approach
Figure 5 Market Size Estimation Methodology: Top-Down Approach
Figure 6 Data Triangulation
Figure 7 Research Assumptions
Figure 8 Research Limitations
Figure 9 Feed Phosphates Market Size, By Type, 2018 vs 2024 (USD Million)
Figure 10 Market Size, By Form, 2018 vs 2024 (USD Million)
Figure 11 Market Size, By Livestock, 2018 vs 2024 (USD Million)
Figure 12 Market Share (Value), By Region, 2017
Figure 13 Rise in Consumption of Meat and Dairy Products to Drive the Demand for Feed Phosphates
Figure 14 Brazil is Projected to Be the Fastest-Growing Market for Feed Phosphates Between 2018 and 2024
Figure 15 Dicalcium Phosphate Accounted for the Largest Share of the Asia Pacific Market
Figure 16 Asia Pacific to Dominate the Feed Phosphates Market Across All Forms Through 2024, in Terms of Value
Figure 17 Poultry to Be the Fastest-Growing Segment During the Forecast Period
Figure 18 Market Drivers, Restraints, Opportunities, and Challenges
Figure 19 Global Meat Consumption Estimates, 2015–2024 (KT CWE)
Figure 20 Global Milk Production, 2013–2016 (MT)
Figure 21 Phosphate Rock Prices (USD/MT)
Figure 22 Feed Phosphate: Value Chain
Figure 23 Feed Phosphate Market Share, By Type, 2018 vs 2024 (USD Million)
Figure 24 Market Share, By Livestock, 2018 vs 2024 (Value)
Figure 25 Market Share (Value), By Form, 2018 vs 2024
Figure 26 Geographical Snapshot, 2018-2024
Figure 27 Asia Pacific: Feed Phosphates Market Snapshot
Figure 28 South America: Feed Phosphates Market Snapshot
Figure 29 Key Developments By Leading Players in the Feed Phosphates Market, 2013–2018
Figure 30 Number of Developments Between 2014 & 2017
Figure 31 Market Share of Players in the Feed Phosphates Market
Figure 32 The Mosaic Company: Company Snapshot
Figure 33 Nutrien Ltd.: Company Snapshot
Figure 34 OCP Group: Company Snapshot
Figure 35 Yara International ASA: Company Snapshot
Figure 36 Eurochem Group AG: Company Snapshot
Figure 37 Phosagro: Company Snapshot


Growth opportunities and latent adjacency in Feed Phosphates Market