Graphic Film Market by Polymer (PVC, PP, PE), Film Type (Opaque, Reflective, Transparent, Translucent), End Use (Promotional & Advertisement, Industrial, Automotive), Printing Technology (Digital, Rotogravure), and Region - Forecast to 2022


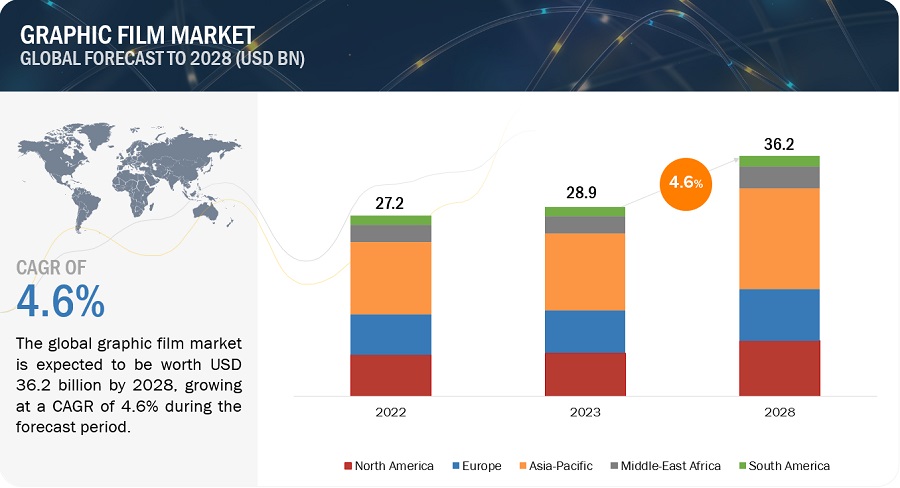
[181 Pages Report] The market for graphic film is projected to grow from USD 23.05 Billion in 2016 to USD 31.10 Billion by 2022, at a compound annual growth rate (CAGR) of 5.17% from 2017 to 2022. The base year considered for the study is 2016 and the market size is projected from 2017 to 2022.
The key objective of the global graphic film report is to provide companies with a summary of the latest trends and lucrative business expansion opportunities for laminated films, graphic films, printing manufacturers, suppliers, and distributors. The report also demonstrates the key business strategies and principles adopted by the key players around the world. The segments considered for this report are based on film type, polymer, end use, printing technology, and region.
The research methodology used to forecast the market size focused on the bottom-up approach. The total market size of graphic film was calculated based on the share of the various film types and polymers derived. Providing weightage for the share and calculation was done on the basis of extensive primary interviews and secondary research from a variety of sources such as the Association for Packaging and Processing Technologies, Foil & Specialty Effects Association (FSEA), the Association of International Metallizers, Coaters, and Laminators, and the Chemical Fabrics & Film Association. Primary research in this report includes extensive interviews with key people such as CEOs, VPs, directors, and executives. After arriving at the overall market size, the total market was split into several segments and subsegments. Data triangulation and market breakdown procedures were employed to complete the overall market engineering process and arrive at the exact statistics for all segments and subsegments. The breakdown of profiles of primary sources is depicted in the figure below.
To know about the assumptions considered for the study, download the pdf brochure
The global market for graphic film is dominated by large players such as Avery Dennison Corporation (US), 3M Company (US), E. I. du Pont de Nemours and Company (US), CCL Industries, Inc. (Canada), Amcor Limited (Australia), Constantia Flexibles Group (Austria), DUNMORE Corporation (US), and Hexis S.A. (France).
Target audience
- Laminated graphic film manufacturers
- OEMs
- Manufacturing organizations
- Automotive manufacturers
- Construction organizations
Get online access to the report on the World's First Market Intelligence Cloud
Request Sample Scope of the Report

This research report segments graphic film into the following submarkets:
By Polymer:
- PVC
- PP
- PE
- Others
By End Use:
- Promotional & advertisement
- Automotive
- Industrial
- Others
By Film Type:
- Reflective
- Opaque
- Transparent
- Translucent
By Printing Technology:
- Rotogravure
- Flexography
- Offset
- Digital
By Region:
- North America
- Europe
- Asia
- Middle East & Africa
- South America
Available Customizations
With the given market data, MarketsandMarkets offers customizations according to client-specific needs. The following customization options are available for the report:
Product Analysis
- Product Matrix, which gives a detailed comparison of markets for different recycled product types
Geographic Analysis
- Further analysis of the graphic film market for additional countries
Company Information
- Detailed analysis and profiling of additional market players (up to five)
MarketsandMarkets projects that the graphic film market will grow from USD 24.17 Billion in 2017 to USD 31.10 Billion by 2022, at a compound annual growth rate (CAGR) of 5.17% from 2017 to 2022. Rise in population, increase in in disposable income levels, growth in construction, automotive, promotional & advertisement, and retail industries, and favorable trends in the e-commerce industry are expected to drive the market.
This market is segmented on the basis of polymer, film type, end use, printing technology, and region. In terms of end use, the promotional & advertisement segment accounted for the largest share. Graphic film are used in a variety of applications such as promotional banners, advertisement pamphlets, and anti-graffiti applications; it thus accounts for the largest market share. On the basis of film type, the opaque segment accounted for the largest share. These films are preferred due to their ease of use, light weight, excellent printability, and high durability.
In terms of polymer, the PVC segment accounted for the largest share, and is also projected to grow at the highest CAGR during the forecast period. The growth has been witnessed owing to its properties such as recyclability, cost-effectiveness, excellent printability, and high durability.
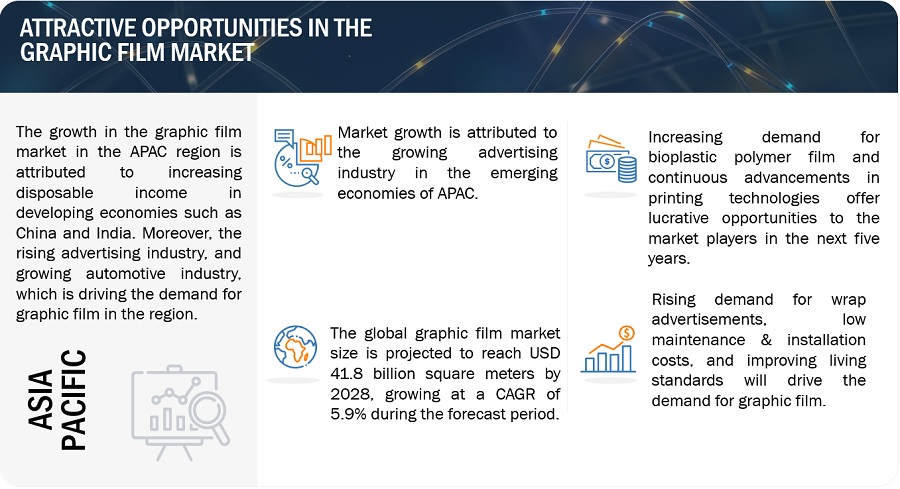
In terms of region, Asia Pacific accounted for the largest share in 2016. Asia Pacific is a developed market due to the rise in population, rapid urbanization, and increase in disposable income capability. China accounted for the largest country-level market for graphic film, globally. The growth can be attributed to high technological development, high disposable income, and good construction & automotive industrial scenarios.
Laminated graphic film mediums are light-weight and cost-effective for promotional activities. However, fluctuation in prices of raw materials and unorganized market structure serve as potential restraints in the graphic film market.
Strategies such as mergers & acquisitions and agreements & expansions were largely adopted by most of the players in this market. The global market for graphic film is dominated by large players such as Avery Dennison Corporation (U.S.), 3M Company (U.S.), E. I. du Pont de Nemours and Company (U.S.), CCL Industries, Inc. (Canada), Amcor Limited (Australia), Constantia Flexibles Group (Austria), Hexis S.A. (U.S.), and DUNMORE Corporation (U.S.)
To speak to our analyst for a discussion on the above findings, click Speak to Analyst
Table of Contents
1 Introduction (Page No. - 19)
1.1 Objectives of the Study
1.2 Market Definition
1.3 Market Scope
1.3.1 Years Considered
1.4 Currency Considered
1.5 Unit Considered
1.6 Stakeholders
2 Research Methodology (Page No. - 23)
2.1 Research Data
2.1.1 Secondary Data
2.1.1.1 Key Data From Secondary Sources
2.1.2 Primary Data
2.1.2.1 Key Data From Primary Sources
2.1.2.2 Key Industry Insights
2.1.2.3 Breakdown of Primary Interviews
2.2 Market Size Estimation
2.3 Data Triangulation
2.4 Market Share Estimation
2.5 Market Assumptions & Limitations
2.5.1 Assumptions
2.5.2 Limitations
3 Executive Summary (Page No. - 32)
3.1 Graphic Film Market
3.2 Promotional & Advertisement Segment Projected to Dominate the Market
3.3 Asia Pacific Region Projected to Dominate the Market
3.4 Asia Pacific Market Projected to Grow at the Highest Rate
4 Premium Insights (Page No. - 36)
4.1 Attractive Opportunities in the Graphic Film Market
4.2 China Estimated to Hold the Largest Market Share in the Asia Pacific Region in 2016
4.3 Asia-Pacific Estimated to Dominate the Graphic Film Market in 2016, in Terms of Volume
4.4 Graphic Film Market, By End Use, 2017 vs 2022
4.5 Asia-Pacific Graphic Film Market to Grow at the Highest Rate in 2017
5 Market Overview (Page No. - 41)
5.1 Introduction
5.2 Market Dynamics
5.2.1 Drivers
5.2.1.1 Growth in the Construction Industry and Improvements in the Standard of Living
5.2.1.2 Low Installation and Maintenance Costs
5.2.1.3 Growth in Demand for Wrap Advertisement
5.2.2 Restraints
5.2.2.1 Fluctuations in Raw Material Prices
5.2.3 Opportunities
5.2.3.1 Continuous Improvement in Digital Printing Techniques
5.2.3.2 Increase in Demand for Bioplastic Polymers
6 Graphic Film Market, By Polymer (Page No. - 45)
6.1 Introduction
6.2 Polypropylene (PP)
6.3 Polyethylene (PE)
6.4 Polyvinyl Chloride (PVC)
6.5 Others
7 Graphic Film Market, By Film Type (Page No. - 50)
7.1 Introduction
7.2 Opaque Films
7.3 Reflective Films
7.4 Transparent Films
7.5 Translucent Films
8 Graphic Film Market, By End Use (Page No. - 55)
8.1 Introduction
8.2 Automotive
8.3 Promotional & Advertisement
8.4 Industrial
8.5 Others
9 Graphic Film Market, By Printing Technology (Page No. - 59)
9.1 Introduction
9.1.1 Graphic Film Market, By Printing Technology
9.2 Flexography
9.3 Rotogravure
9.4 Offset
9.5 Digital
10 Graphic Film Market, By Region (Page No. - 63)
10.1 Introduction
10.2 Europe
10.2.1 Europe: Graphic Film Market, By Country
10.2.2 Europe: By Market, By Polymer
10.2.3 Europe: By Market, By End Use
10.2.4 Europe: By Market, By Film Type
10.2.5 Germany
10.2.5.1 Germany: Graphic Film Market, By Polymer
10.2.5.2 Germany: By Market, By End Use
10.2.5.3 Germany: By Market, By Film Type
10.2.6 France
10.2.6.1 France: Graphic Film Market, By Polymer
10.2.6.2 France: By Market, By End Use
10.2.6.3 France: By Market, By Film Type
10.2.7 UK
10.2.7.1 UK: Graphic Film Market, By Polymer
10.2.7.2 UK: By Market, By End Use
10.2.7.3 UK: By Market, By Film Type
10.2.8 Italy
10.2.8.1 Italy: Graphic Film Market, By Polymer
10.2.8.2 Italy: By Market, By End Use
10.2.8.3 Italy: By Market, By Film Type
10.2.9 Russia
10.2.9.1 Russia: Economic Indicators
10.2.9.2 Russia: Graphic Film Market, By Polymer
10.2.9.3 Russia: By Market, By End Use
10.2.9.4 Russia: By Market, By Film Type
10.2.10 Rest of Europe
10.2.10.1 Rest of Europe: Graphic Film Market, By Polymer
10.2.10.2 Rest of Europe: By Market, By End Use
10.2.10.3 Rest of Europe: By Market, By Film Type
10.3 Asia Pacific
10.3.1 Asia Pacific: Graphic Film Market, By Country
10.3.2 Asia Pacific: By Market, By Polymer
10.3.3 Asia Pacific: By Market, By End Use
10.3.4 Asia Pacific: By Market, By Film Type
10.3.5 China
10.3.5.1 China: Graphic Film Market, By Polymer
10.3.5.2 China: By Market, By End Use
10.3.5.3 China: By Market, By Film Type
10.3.6 India
10.3.6.1 India: Graphic Film Market, By Polymer
10.3.6.2 India: By Market, By End Use
10.3.6.3 India: By Market, By Film Type
10.3.7 Japan
10.3.7.1 Japan: Graphic Film Market, By Polymer
10.3.7.2 Japan: By Market, By End Use
10.3.7.3 Japan: By Market, By Film Type
10.3.8 South Korea
10.3.8.1 South Korea: Graphic Film Market, By Polymer
10.3.8.2 South Korea: By Market, By End Use
10.3.8.3 South Korea: By Market, By Film Type
10.3.9 Australia
10.3.9.1 Australia: Graphic Film Market, By Polymer
10.3.9.2 Australia: By Market, By End Use
10.3.9.3 Australia: By Market, By Film Type
10.3.10 Rest of Asia Pacific
10.3.10.1 Rest of Asia Pacific: Graphic Film Market, By Polymer
10.3.10.2 Rest of Asia Pacific: By Market, By End Use
10.3.10.3 Rest of Asia Pacific: By Market, By Film Type
10.4 North America
10.4.1 North America: Graphic Film Market, By Country
10.4.2 North America: By Market, By Polymer
10.4.3 North America: By Market, By End Use
10.4.4 North America: By Market, By Film Type
10.4.5 US
10.4.5.1 US: Graphic Film Market, By Polymer
10.4.5.2 US: By Market, By End Use
10.4.5.3 US: By Market, By Film Type
10.4.6 Canada
10.4.6.1 Canada: Graphic Film Market, By Polymer
10.4.6.2 Canada: By Market, By End Use
10.4.6.3 Canada: By Market, By Film Type
10.4.7 Mexico
10.4.7.1 Mexico: Graphic Film Market, By Polymer
10.4.7.2 Mexico: By Market, By End Use
10.4.7.3 Mexico: By Market, By Film Type
10.5 Middle East & Africa
10.5.1 Middle East & Africa: Graphic Film Market, By Country
10.5.2 Middle East & Africa: By Market, By Polymer
10.5.3 Middle East & Africa: By Market, By End Use
10.5.4 Middle East & Africa: By Market, By Film Type
10.5.5 South Africa
10.5.5.1 South Africa: Graphic Film Market, By Polymer
10.5.5.2 South Africa: By Market, By End Use
10.5.5.3 South Africa: By Market, By Film Type
10.5.6 UAE
10.5.6.1 UAE: Graphic Film Market, By Polymer
10.5.6.2 UAE: By Market, By End Use
10.5.6.3 UAE: By Market, By Film Type
10.5.7 Turkey
10.5.7.1 Turkey: Graphic Film Market, By Polymer
10.5.7.2 Turkey: By Market, By End Use
10.5.7.3 Turkey: By Market, By Film Type
10.5.8 Rest of Middle East & Africa
10.5.8.1 Rest of Middle East & Africa: Graphic Film Market, By Polymer
10.5.8.2 Rest of Middle East & Africa: By Market, By End Use
10.5.8.3 Rest of Middle East & Africa: By Market, By Film Type
10.6 South America
10.6.1 South America: Graphic Film Market, By Country
10.6.2 South America: By Market, By Polymer
10.6.3 South America: By Market, By End Use
10.6.4 South America: By Market, By Film Type
10.6.5 Brazil
10.6.5.1 Brazil: Graphic Film Market, By Polymer
10.6.5.2 Brazil: By Market, By End Use
10.6.5.3 Brazil: By Market, By Film Type
10.6.6 Argentina
10.6.6.1 Argentina: Graphic Film Market, By Polymer
10.6.6.2 Argentina: By Market, By End Use
10.6.6.3 Argentina: By Market, By Film Type
10.6.7 Rest of South America
10.6.7.1 Rest of South America: Graphic Film Market, By Polymer
10.6.7.2 Rest of South America: By Market, By End Use
10.6.7.3 Rest of South America: By Market, By Film Type
11 Competitive Landscape (Page No. - 145)
11.1 Introduction
11.2 Competitive Leadership Mapping, 2016
11.2.1 Innovators
11.2.2 Visionary Leaders
11.2.3 Emerging Companies
11.3 CompetiTVe Benchmarking
11.3.1 Strength of Product Portfolio (For All 25 Players)
11.3.2 Business Strategy Excellence (For All 25 Players)
12 Company Profiles (Page No. - 149)
12.1 3M Company
12.1.1 Business Overview
12.1.2 Strength of Product Portfolio
12.1.3 Products Offered
12.1.4 Business Strategy Excellence
12.1.5 Recent Developments
12.2 E.I. Du Pont De Nemours and Company
12.2.1 Business Overview
12.2.2 Strength of Product Portfolio
12.2.3 Products Offered
12.2.4 Business Strategy Excellence
12.3 Avery Dennison Corporation
12.3.1 Business Overview
12.3.2 Strength of Product Portfolio
12.3.3 Products Offered
12.3.4 Business Strategy Excellence
12.3.5 Recent Developments
12.4 CCL Industries Inc.
12.4.1 Business Overview
12.4.2 Strength of Product Portfolio
12.4.3 Products Offered
12.4.4 Business Strategy Excellence
12.4.5 Recent Developments
12.5 Constantia Flexibles Group
12.5.1 Business Overview
12.5.2 Strength of Product Portfolio
12.5.3 Products Offered
12.5.4 Business Strategy Excellence
12.5.5 Recent Developments
12.6 Hexis S.A.
12.6.1 Business Overview
12.6.2 Strength of Product Portfolio
12.6.3 Products Offered
12.6.4 Business Strategy Excellence
12.7 Dunmore Corporation
12.7.1 Business Overview
12.7.2 Strength of Product Portfolio
12.7.3 Products Offered
12.7.4 Business Strategy Excellence
12.7.5 Recent Developments
12.8 Drytac Corporation
12.8.1 Business Overview
12.8.2 Strength of Product Portfolio
12.8.3 Strength of Product Portfolio
12.8.4 Business Strategy Excellence
12.9 Kay Premium Marking Films Ltd.
12.9.1 Business Overview
12.9.2 Strength of Product Portfolio
12.9.3 Products Offered
12.9.4 Business Strategy Excellence
12.10 Achilles USA, Inc.
12.10.1 Business Overview
12.10.2 Strength of Product Portfolio
12.10.3 Products Offered
12.10.4 Business Strategy Excellence
13 Appendix (Page No. - 174)
13.1 Discussion Guide
13.2 Knowledge Store: Marketsandmarkets Subscription Portal
13.3 Introducing RT: Real-Time Market Intelligence
13.4 Available Customizations
13.5 Related Reports
13.6 Author Details
List of Tables (192 Tables)
Table 1 GDP Contribution of the Construction Industry, (USD Million) By Region (20102015)
Table 2 Household Disposable Income, Net Annual Growth Rate (20102015)
Table 3 CPM of Outdoor Advertisement
Table 4 Bioplastic vs Conventional Petro-Based Plastic
Table 5 Graphic Film Market Size, By Polymer, 20152022 (USD Million)
Table 6 Graphic Film Market Size, By Polymer, 20152022 (Million Square Meter)
Table 7 PP Properties
Table 8 PE Properties
Table 9 PVC Properties
Table 10 Graphic Film Market Size, By Film Type, 20152022 (USD Million)
Table 11 Graphic Film Market Size, By Film Type, 20152022 (Million Square Meter)
Table 12 Characteristics of Opaque Films
Table 13 Characteristics of Reflective Films
Table 14 Characteristics of Translucent Films
Table 15 Graphic Film Market Size, By End Use, 20152022 (USD Million)
Table 16 Graphic Film Market Size, By End Use, 20152022 (Million Square Meter)
Table 17 Graphic Film Market Size, By Printing Technology, 20152022 (USD Million)
Table 18 Graphic Film Market Size, By Printing Technology, 20152022 (Million Square Meter)
Table 19 Graphic Film Market Size, By Region, 20152022 (USD Million)
Table 20 Graphic Film Market Size, By Region, 20152022 (Million Square Meter)
Table 21 Europe: Graphic Film Market Size, By Country, 20152022 (USD Million)
Table 22 Europe: By Market Size, By Country, 20152022 (Million Square Meter)
Table 23 Europe: By Market Size, By Polymer, 20152022 (USD Million)
Table 24 Europe: By Market Size, By Polymer, 20152022 (Million Square Meter)
Table 25 Europe: By Market Size, By End Use, 20152022 (USD Million)
Table 26 Europe: By Market Size, By End Use, 20152022 (Million Square Meter)
Table 27 Europe: By Market Size, By Film Type, 20152022 (USD Million)
Table 28 Europe: By Market Size, By Film Type, 20152022 (Million Square Meter)
Table 29 Germany: Graphic Film Market Size, By Polymer, 20152022 (USD Million)
Table 30 Germany: By Market Size, By Polymer, 20152022 (Million Square Meter)
Table 31 Germany: By Market Size, By End Use, 20152022 (USD Million)
Table 32 Germany: By Market Size, By End Use, 20152022 (Million Square Meter)
Table 33 Germany: By Market Size, By Film Type, 20152022 (USD Million)
Table 34 Germany: By Market Size, By Film Type, 20152022 (Million Square Meter)
Table 35 France: Graphic Film Market Size, By Polymer, 20152022 (USD Million)
Table 36 France: By Market Size, By Polymer, 20152022 (Million Square Meter)
Table 37 France: By Market Size, By End Use, 20152022 (USD Million)
Table 38 France: By Market Size, By End Use, 20152022 (Million Square Meter)
Table 39 France: By Market Size, By Film Type, 20152022 (USD Million)
Table 40 France: By Market Size, By Film Type, 20152022 (Million Square Meter)
Table 41 UK: Graphic Film Market Size, By Polymer, 20152022 (USD Million)
Table 42 UK: By Market Size, By Polymer, 20152022 (Million Square Meter)
Table 43 UK: By Market Size, By End Use, 20152022 (USD Million)
Table 44 UK: By Market Size, By End Use, 20152022 (Million Square Meter)
Table 45 UK: By Market Size, By Film Type, 20152022 (USD Million)
Table 46 UK: By Market Size, By Film Type, 20152022 (Million Square Meter)
Table 47 Italy: Graphic Film Market Size, By Polymer, 20152022 (USD Million)
Table 48 Italy: By Market Size, By Polymer, 20152022 (Million Square Meter)
Table 49 Italy: By Market Size, By End Use, 20152022 (USD Million)
Table 50 Italy: By Market Size, By End Use, 20152022 (Million Square Meter)
Table 51 Italy: By Market Size, By Film Type, 20152022 (USD Million)
Table 52 Italy: By Market Size, By Film Type, 20152022 (Million Square Meter)
Table 53 Russia: Graphic Film Market Size, By Polymer, 20152022 (USD Million)
Table 54 Russia: By Market Size, By Polymer, 20152022 (Million Square Meter)
Table 55 Russia: By Market Size, By End Use, 20152022 (USD Million)
Table 56 Russia: By Market Size, By End Use, 20152022 (Million Square Meter)
Table 57 Russia: By Market Size, By Film Type, 20152022 (USD Million)
Table 58 Russia: By Market Size, By Film Type, 20152022 (Million Square Meter)
Table 59 Rest of Europe: Graphic Film Market Size, By Polymer, 20152022 (USD Million)
Table 60 Rest of Europe: By Market Size, By Polymer, 20152022 (Million Square Meter)
Table 61 Rest of Europe: By Market Size, By End Use, 20152022 (USD Million)
Table 62 Rest of Europe: By Market Size, By End Use, 20152022 (Million Square Meter)
Table 63 Rest of Europe: By Market Size, By Film Type, 20152022 (USD Million)
Table 64 Rest of Europe: By Market Size, By Film Type, 20152022 (Million Square Meter)
Table 65 Asia Pacific: Graphic Film Market Size, By Country, 20152022 (USD Million)
Table 66 Asia Pacific: By Market Size, By Country, 20152022 (Million Square Meter)
Table 67 Asia Pacific: By Market Size, By Polymer, 20152022 (USD Million)
Table 68 Asia Pacific: By Market Size, By Polymer, 20152022 (Million Square Meter)
Table 69 Asia Pacific: By Market Size, By End Use, 20152022 (USD Million)
Table 70 Asia Pacific: By Market Size, By End Use, 20152022 (Million Square Meter)
Table 71 Asia Pacific: By Market Size, By Film Type, 20152022 (USD Million)
Table 72 Asia Pacific: By Market Size, By Film Type, 20152022 (Million Square Meter)
Table 73 China: Graphic Film Market Size, By Polymer, 20152022 (USD Million)
Table 74 China: By Market Size, By Polymer, 20152022 (Million Square Meter)
Table 75 China: By Market Size, By End Use, 20152022 (USD Million)
Table 76 China: By Market Size, By End Use, 20152022 (Million Square Meter)
Table 77 China: By Market Size, By Film Type, 20152022 (USD Million)
Table 78 China: By Market Size, By Film Type, 20152022 (Million Square Meter)
Table 79 India: Graphic Film Market Size, By Polymer, 20152022 (USD Million)
Table 80 India: By Market Size, By Polymer, 20152022 (Million Square Meter)
Table 81 India: By Market Size, By End Use, 20152022 (USD Million)
Table 82 India: By Market Size, By End Use, 20152022 (Million Square Meter)
Table 83 India: By Market Size, By Film Type, 20152022 (USD Million)
Table 84 India: By Market Size, By Film Type, 20152022 (Million Square Meter)
Table 85 Japan: Graphic Film Market Size, By Polymer, 20152022 (USD Million)
Table 86 Japan: By Market Size, By Polymer, 20152022 (Million Square Meter)
Table 87 Japan: By Market Size, By End Use, 20152022 (USD Million)
Table 88 Japan: By Market Size, By End Use, 20152022 (Million Square Meter)
Table 89 Japan: By Market Size, By Film Type, 20152022 (USD Million)
Table 90 Japan: By Market Size, By Film Type, 20152022 (Million Square Meter)
Table 91 South Korea: Graphic Film Market Size, By Polymer, 20152022 (USD Million)
Table 92 South Korea: By Market Size, By Polymer, 20152022 (Million Square Meter)
Table 93 South Korea: By Market Size, By End Use, 20152022 (USD Million)
Table 94 South Korea: By Market Size, By End Use, 20152022 (Million Square Meter)
Table 95 South Korea: By Market Size, By Film Type, 20152022 (USD Million)
Table 96 South Korea: By Market Size, By Film Type, 20152022 (Million Square Meter)
Table 97 Australia: Graphic Film Market Size, By Polymer, 20152022 (USD Million)
Table 98 Australia: By Market Size, By Polymer, 20152022 (Million Square Meter)
Table 99 Australia: By Market Size, By End Use, 20152022 (USD Million)
Table 100 Australia: By Market Size, By End Use, 20152022 (Million Square Meter)
Table 101 Australia: By Market Size, By Film Type, 20152022 (USD Million)
Table 102 Australia: By Market Size, By Film Type, 20152022 (Million Square Meter)
Table 103 Rest of Asia Pacific: Graphic Film Market Size, By Polymer, 20152022 (USD Million)
Table 104 Rest of Asia Pacific: By Market Size, By Polymer, 20152022 (Million Square Meter)
Table 105 Rest of Asia Pacific: By Market Size, By End Use, 20152022 (USD Million)
Table 106 Rest of Asia Pacific: By Market Size, By End Use, 20152022 (Million Square Meter)
Table 107 Rest of Asia Pacific: By Market Size, By Film Type, 20152022 (USD Million)
Table 108 Rest of Asia Pacific: By Market Size, By Film Type, 20152022 (Million Square Meter)
Table 109 North America: Graphic Film Market Size, By Country, 20152022 (USD Million)
Table 110 North America: By Market Size, By Country, 20172022 (Million Square Meter)
Table 111 North America: By Market Size, By Polymer, 20152022 (USD Million)
Table 112 North America: By Market Size, By Polymer, 20152022 (Million Square Meter)
Table 113 North America: By Market Size, By End Use, 20152022 (USD Million)
Table 114 North America: By Market Size, By End Use, 20152022 (Million Square Meter)
Table 115 North America: By Market Size, By Film Type, 20152022 (USD Million)
Table 116 North America: By Market Size, By Film Type, 20152022 (Million Square Meter)
Table 117 US: Graphic Film Market Size, By Polymer, 20152022 (USD Million)
Table 118 US: By Market Size, By Polymer, 20152022 (Million Square Meter)
Table 119 US: By Market Size, By End Use, 20152022 (USD Million)
Table 120 US: By Market Size, By End Use, 20152022 (Million Square Meter)
Table 121 US: By Market Size, By Film Type, 20152022 (USD Million)
Table 122 US: By Market Size, By Film Type, 20152022 (Million Square Meter)
Table 123 Canada: Graphic Film Market Size, By Polymer, 20152022 (USD Million)
Table 124 Canada: By Market Size, By Polymer, 20152022 (Million Square Meter)
Table 125 Canada: By Market Size, By End Use, 20152022 (USD Million)
Table 126 Canada: By Market Size, By End Use, 20152022 (Million Square Meter)
Table 127 Canada: By Market Size, By Film Type, 20152022 (USD Million)
Table 128 Canada: By Market Size, By Film Type, 20152022 (Million Square Meter)
Table 129 Mexico: Graphic Film Market Size, By Polymer, 20152022 (USD Million)
Table 130 Mexico: By Market Size, By Polymer, 20152022 (Million Square Meter)
Table 131 Mexico: By Market Size, End Use, 20152022 (USD Million)
Table 132 Mexico: By Market Size, By End Use, 20152022 (Million Square Meter)
Table 133 Mexico: By Market Size, By Film Type, 20152022 (USD Million)
Table 134 Mexico: By Market Size, By Film Type, 20152022 (Million Square Meter)
Table 135 Middle East & Africa: Graphic Film Market Size, By Country, 20152022 (USD Million)
Table 136 Middle East & Africa: By Market Size, By Country, 20152022 (Million Square Meter)
Table 137 Middle East & Africa: By Market Size, By Polymer, 20152022 (USD Million)
Table 138 Middle East & Africa: By Market Size, By Polymer, 20152022 (Million Square Meter)
Table 139 Middle East & Africa: By Market Size, By End Use, 20152022 (USD Million)
Table 140 Middle East & Africa: By Market Size, By End Use, 20152022 (Million Square Meter)
Table 141 Middle East & Africa: By Market Size, By Film Type, 20152022 (USD Million)
Table 142 Middle East & Africa: By Market Size, By Film Type, 20152022 (Million Square Meter)
Table 143 South Africa: Graphic Film Market Size, By Polymer, 20152022 (USD Million)
Table 144 South Africa: By Market Size, By Polymer, 20152022 (Million Square Meter)
Table 145 South Africa: By Market Size, By End Use, 20152022 (USD Million)
Table 146 South Africa: By Market Size, By End Use, 20152022 (Million Square Meter)
Table 147 South Africa: By Market Size, By Film Type, 20152022 (USD Million)
Table 148 South Africa: By Market Size, By Film Type, 20152022 (Million Square Meter)
Table 149 UAE: Graphic Film Market Size, By Polymer, 20152022 (USD Million)
Table 150 UAE: By Market Size, By Polymer, 20152022 (Million Square Meter)
Table 151 UAE: By Market Size, By End Use, 20152022 (USD Million)
Table 152 UAE: By Market Size, By Film Type, 20152022 (Million Square Meter)
Table 153 UAE: By Market Size, By Film Type, 20152022 (Million Square Meter)
Table 154 UAE: By Market Size, By Film Type, 20152022 (Million Square Meter)
Table 155 Turkey: Graphic Film Market Size, Graphic Film vvPolymer, 20152022 (USD Million)
Table 156 Turkey: By Market Size, Graphic Film Market Polymer, 20152022 (Million Square Meter)
Table 157 Turkey: By Market Size, Graphic Film Market End Use, 20152022 (USD Million)
Table 158 Turkey: By Market Size, Graphic Film Market End Use, 20152022 (Million Square Meter)
Table 159 Turkey: By Market Size, Graphic Film Market Type, 20152022 (USD Million)
Table 160 Turkey: By Market Size, Graphic Film Market Type, 20152022 (Million Square Meter)
Table 161 Rest of Middle East & Africa: Graphic Film Market Size, By Polymer, 20152022 (USD Million)
Table 162 Rest of Middle East & Africa: Graphic Film Market Size, By Polymer, 20152022 (Million Square Meter)
Table 163 Rest of Middle East & Africa: Graphic Film Market Size, By End Use, 20152022 (USD Million)
Table 164 Rest of Middle East & Africa: Graphic Film Market Size, By End Use, 20152022 (Million Square Meter)
Table 165 Rest of Middle East & Africa: Graphic Film Market Size, By Film Type, 20152022 (USD Million)
Table 166 Rest of Middle East & Africa: Graphic Film Market Size, By Film Type, 20152022 (Million Square Meter)
Table 167 South America: Graphic Film Market Size, By Country, 20152022 (USD Million)
Table 168 South America: Graphic Film Market Size, By Country, 20152022 (Million Square Meter)
Table 169 South America: Graphic Film Market Size, By Polymer, 20152022 (USD Million)
Table 170 South America: Graphic Film Market Size, By Polymer, 20152022 (Million Square Meter)
Table 171 South America: Graphic Film Market Size, By End Use, 20152022 (USD Million)
Table 172 South America: Graphic Film Market Size, By End Use, 20152022 (Million Square Meter)
Table 173 South America: Graphic Film Market Size, By Film Type, 20152022 (USD Million)
Table 174 South America: Graphic Film Market Size, By Film Type, 20152022 (Million Square Meter)
Table 175 Brazil: Graphic Film Market Size, By Polymer, 20152022 (USD Million)
Table 176 Brazil: Graphic Film Market Size, By Polymer, 20152022 (Million Square Meter)
Table 177 Brazil: Graphic Film Market Size, By End Use, 20152022 (USD Million)
Table 178 Brazil: Graphic Film Market Size, By End Use, 20152022 (Million Square Meter)
Table 179 Brazil: Graphic Film Market Size, By Film Type, 20152022 (USD Million)
Table 180 Brazil: Graphic Film Market Size, By Film Type, 20152022 (Million Square Meter)
Table 181 Argentina: Graphic Film Market Size, By Polymer, 20152022 (USD Million)
Table 182 Argentina: Graphic Film Market Size, By Polymer, 20152022 (Million Square Meter)
Table 183 Argentina: Graphic Film Market Size, By End Use, 20152022 (USD Million)
Table 184 Argentina: Graphic Film Market Size, By End Use, 20152022 (Million Square Meter)
Table 185 Argentina: Graphic Film Market Size, By Film Type, 20152022 (USD Million)
Table 186 Argentina: Graphic Film Market Size, By Film Type, 20152022 (Million Square Meter)
Table 187 Rest of South America: Graphic Film Market Size, By Polymer, 20152022 (USD Million)
Table 188 Rest of South America: Graphic Film Market Size, By Polymer, 20152022 (Million Square Meter)
Table 189 Rest of South America: Graphic Film Market Size, By End Use, 20152022 (USD Million)
Table 190 Rest of South America: Graphic Film Market Size, By End Use, 20152022 (Million Square Meter)
Table 191 Rest of South America: Graphic Film Market Size, By Film Type, 20152022 (USD Million)
Table 192 Rest of South America: Graphic Film Market Size, By Film Type, 20152022 (Million Square Meter)
List of Figures (29 Figures)
Figure 1 Graphic Film Market: Research Design
Figure 2 Market Size Estimation Methodology: Bottom-Up Approach
Figure 3 Market Size Estimation Methodology: Top-Down Approach
Figure 4 Graphic Film Market : Data Triangulation
Figure 5 Opaque Film Type Projected to Grow at the Highest CAGR Due to Rise in Demand From End Users
Figure 6 Graphic Film Market, By End Use (2017 vs 2022)
Figure 7 Graphic Film Market, By Region, (USD Billion) (2017 vs 2022)
Figure 8 Asia Pacific to Be the Fastest-Growing Region-Level Market, in Terms of Value
Figure 9 Emerging Economies Offer Excellent Opportunities in the Graphic Film Market
Figure 10 Opaque Segment, By Film Type, Estimated to Hold the Largest Market Share in the Asia-Pacific Region in 2016
Figure 11 China Projected to Be the Fastest-Growing Country-Level Market for Graphic Film
Figure 12 Promotional & Advertisement Segment Expected to Grow at the Highest Rate From 2017 to 2022
Figure 13 Asia Pacific Projected to Dominate the Market
Figure 14 Drivers, Opportunities, and Restraints in Laminated Graphic Films Market
Figure 15 Graphic Film Market Size, By Polymer, 20172022 (USD Million)
Figure 16 Graphic Film Market Size, By Film Type, 2017 vs 2022 (USD Million)
Figure 17 Graphic Film Market Size, By End Use, 2017 vs 2022 (USD Million)
Figure 18 Graphic Film Market, By Printing Technology, 2017 vs 2022 (USD Million)
Figure 19 Graphic Film Market Snapshot: China Projected to Be the Fastest-Growing Market (20172022)
Figure 20 Region Snapshot: Asia Pacific
Figure 21 Indian Automotive Industry, 20112015 (USD Billion)
Figure 22 North America: Graphic Film Market Snapshot
Figure 23 South African Automotive Market in 2015
Figure 24 Competitive Leadership Mapping, 2016
Figure 25 3M Company: Company Snapshot
Figure 26 E. I. Du Pont De Nemours and Company: Company Snapshot
Figure 27 Avery Dennison Corporation: Company Snapshot
Figure 28 CCL Industries Inc.: Company Snapshot
Figure 29 Constantia Flexibles Group: Company Snapshot


Growth opportunities and latent adjacency in Graphic Film Market