Security Solutions Market by Offering (Products (Fire Protection, Video Surveillance, Access Control) and Services (System Integration, Remote Monitoring, Fire Protection, VSaaS, ACaaS)), Vertical, and Geography - Global Forecast to 2024


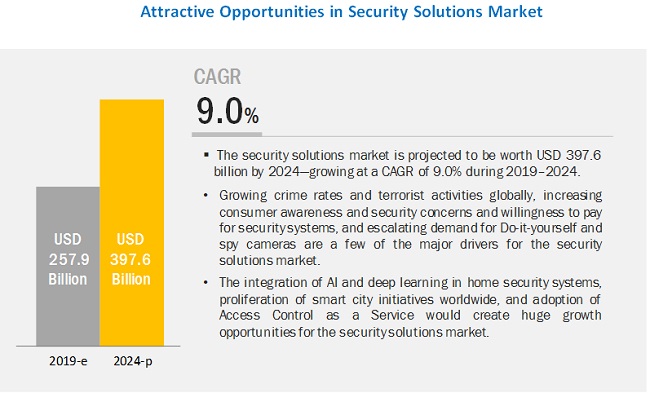
Security solutions market is projected to reach USD 397.6 billion by 2024, growing at a CAGR of 9.0% during the forecast period. Key factors contributing to the growth of the security solutions market include growing crime rates and terrorist activities globally, increasing consumer awareness and security concerns and willingness to pay for security systems, rapid development in wireless technologies for fire detection, and escalating demand for do-it-yourself and spy cameras.
“The security solutions market for commercial vertical to hold the largest share of the market during the forecast period”
The security solutions market for the commercial vertical is expected to continue to account for the largest size during the forecast period. This is due to the increasing incidences of robbery and theft. To protect commercial assets, property owners are buying security systems. Also, robbery and information security are major concerns nowadays. Corporates are investing millions of dollars in security technology with the intention of increasing security, protecting people and assets, and solving security issues.
“The security solutions services market for access control services to grow at the second highest CAGR during the forecast period”
The security solutions services market for access control services to grow at the second highest CAGR during the forecast period. This due to increased demand for ACaaS from businesses with multiple locations to centralize their operations. Furthermore, the large-scale adoption of Internet of Things (IoT) and increased usage of advance virtualization and cloud computing platforms is expected to propel the growth of the access control services.
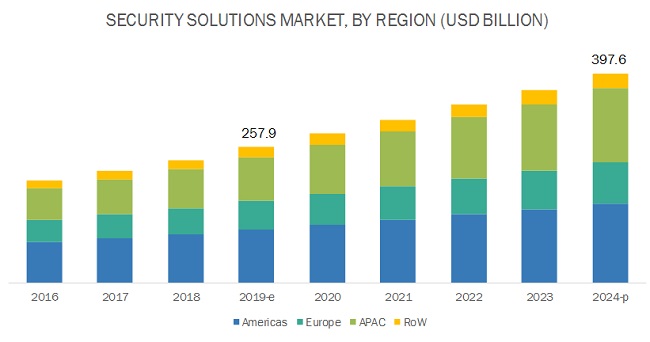
“Security solutions market in Americas is expected to hold the largest share during the forecast period”
The Americas is expected to hold the largest share of the security solutions market during the forecast period. The Americas is one of the early adopters of security technologies such as access control, video surveillance, and fire protection system, among others. The region is at the forefront of implementing access control systems for improving safety measures and security. Secondly, due to the mandatory fire protection and safety regulations in the Americas, most of the building structures are fixed with fire protection systems. Furthermore, the Americas is a pioneer in the adoption of video surveillance in public safety.
Key Market Players
ADT (US), Honeywell International Inc. (US), Johnson Controls (US), Robert Bosch (Germany), Hikvision (China), Dahua Technology Co., Ltd (China), Axis Communications AB (Sweden), SECOM CO. LTD (Japan), United Technologies (US), ASSA ABLOY (Sweden) are among a few major players in the security solutions market.
Johnson Controls (US) is one of the leading providers of integrated infrastructure and next-generation systems for smart cities and communities. Johnson Controls’ Building Technologies & Solutions segment sells its integrated control systems, security systems, fire-detection systems, equipment and services primarily through the company’s extensive global network of sales and service offices, with operations in approximately 70 countries. To grow in the security solutions market the company has majorly adopted the strategy of product launches. For instance, in August 2019, Johnson Controls launched Tyco Cloud, a new cloud-based security suite developed to help customers move costly and complex security infrastructure for access control and video surveillance to the cloud.
Security Solution Market Report Scope :
|
Report Metric |
Details |
|
Estimated Market Size |
USD 257.9 Billion |
| Projected Market Size | USD 397.6 billion |
| Growth Rate | 9.0% CAGR |
|
Base year |
2018 |
|
Forecast period |
2019–2024 |
|
Units |
Value (USD) |
|
Segments covered |
|
|
Geographic regions covered |
|
| Top Companies in North America |
|
|
Companies covered |
|
| Largest Growing Region | Americas |
| Largest Market Share Segment | Access control services |
| Largest Application Market Share | Commercial vertical |
This report categorizes the security solutions market based on offering, vertical, and geography.
Security solutions Market, by Offering
-
Products
-
Fire Protection Systems
- Fire Detection Systems
- Fire Suppression Systems
- Fire Sprinkler Systems
- Fire Analysis Systems
- Fire Response Systems
-
Video Surveillance Systems
-
Hardware
- Cameras
- Monitors
- Storage Devices
- Other Accessories
-
Software
- Video Analytics
- Video Management Software
-
Hardware
-
Access Control Systems
-
Hardware
- Card-based readers
- Biometric readers
- Multitechnology readers
- Controllers
- Others (RFID tags, keypads, door sets, and servers)
-
Software
- Entrance Control Systems
- Intruder Alarms
- Thermal Cameras
-
Hardware
-
Services
- Security Systems Integration
- Remote Monitoring Services
-
Fire Protection Services
- Engineering Services
- Installation and Design Services
- Maintenance Services
- Managed Services
- Other Services (Tenancy and Refurbishment Upgrade Services)
-
Video Surveillance Services
- Video Surveillance as a Service (VSaaS)
- Installation and Maintenance
-
Access Control Services
- Installation and Integration
- Support and Maintenance
- Access Control as a Service (ACaaS)
-
Fire Protection Systems
Security solutions Market, by Vertical
- Commercial
- Residential
- Government
- Transportation
- Retail
- Banking & Finance
- Education
- Industrial
- Energy and Utility
- Sports and Leisure
- Healthcare
- Military & Defense
Security solutions Market, by Geography
- Americas
- Europe
- APAC
- RoW
Key Questions Addressed in the Report
- What are the major verticals where security solutions are in great demand?
- Which security products will have the highest growth and largest market share during the forecast period?
- Which security services will have the highest CAGR of the market during the forecast period?
- Which region would lead the global security solutions market during the forecast period?
- What are the strategies followed by security solutions hardware manufacturers and software and service providers to stay ahead in the market?
- What are the major drivers, restraints, opportunities, and challenges for the security solutions market?
To speak to our analyst for a discussion on the above findings, click Speak to Analyst
TABLE OF CONTENTS
1 INTRODUCTION (Page No. - 19)
1.1 STUDY OBJECTIVES
1.2 MARKET DEFINITION AND SCOPE
1.2.1 INCLUSIONS AND EXCLUSIONS
1.3 STUDY SCOPE
1.3.1 MARKETS COVERED
1.3.2 GEOGRAPHIC SCOPE
1.3.3 YEARS CONSIDERED
1.4 CURRENCY
1.5 STAKEHOLDERS
2 RESEARCH METHODOLOGY (Page No. - 23)
2.1 RESEARCH DATA
2.1.1 SECONDARY DATA
2.1.1.1 Major secondary sources
2.1.1.2 Key data from secondary sources
2.1.2 PRIMARY DATA
2.1.2.1 Primary interviews with experts
2.1.2.2 Key data from primary sources
2.1.2.3 Breakdown of primaries
2.1.3 SECONDARY AND PRIMARY RESEARCH
2.2 MARKET SIZE ESTIMATION
2.2.1 BOTTOM-UP APPROACH
2.2.1.1 Approach for capturing market size by bottom-up approach (demand side)
2.2.2 TOP-DOWN APPROACH
2.2.2.1 Approach for capturing market size by top-down approach (supply side)
2.3 MARKET BREAKDOWN AND DATA TRIANGULATION
2.4 RESEARCH ASSUMPTIONS
3 EXECUTIVE SUMMARY (Page No. - 32)
4 PREMIUM INSIGHTS (Page No. - 38)
4.1 ATTRACTIVE OPPORTUNITIES IN SECURITY SOLUTIONS MARKET
4.2 SECURITY SOLUTIONS PRODUCT MARKET IN APAC, BY VERTICAL AND COUNTRY
4.3 SECURITY SOLUTIONS MARKET, BY OFFERING
4.4 SECURITY SOLUTIONS MARKET FOR VIDEO SURVEILLANCE SYSTEMS, BY OFFERING
4.5 GEOGRAPHIC ANALYSIS OF SECURITY SOLUTIONS MARKET
5 MARKET OVERVIEW (Page No. - 41)
5.1 INTRODUCTION
5.2 MARKET DYNAMICS
5.2.1 DRIVERS
5.2.1.1 Growing crime rates and terrorist activities globally
5.2.1.2 Increasing consumer awareness and security concerns and willingness to pay for security systems
5.2.1.3 Surging demand for deployment of wireless technology in security systems
5.2.1.4 Ongoing development in wireless fire detection systems
5.2.1.5 Escalating demand for do-it-yourself and spy cameras
5.2.2 RESTRAINTS
5.2.2.1 High installation, operational, and maintenance costs
5.2.3 OPPORTUNITIES
5.2.3.1 Integration of AI and deep learning in home security systems
5.2.3.2 Proliferation of smart city initiatives worldwide
5.2.3.3 Adoption of Access Control as a Service
5.2.3.4 Implementation of mobile-based access control
5.2.3.5 Inclination toward Video Surveillance as a Service
5.2.3.6 Technological advancements in Big Data, video analytics, IoT, and cloud-based services
5.2.4 CHALLENGES
5.2.4.1 Complexity of security systems
5.2.4.2 Security concerns related to unauthorized access and data breach in access control environment
5.2.4.3 Requirement for high-capacity storage systems and higher bandwidth
5.2.4.4 Amalgamation of user interfaces with fire protection solutions
5.3 VALUE CHAIN ANALYSIS
6 SECURITY SOLUTIONS MARKET, BY OFFERING (Page No. - 53)
6.1 INTRODUCTION
6.2 SECURITY PRODUCTS
6.2.1 FIRE PROTECTION SYSTEMS
6.2.1.1 Fire detection systems
6.2.1.1.1 Flame detectors
6.2.1.1.1.1 Growing usage of flame detectors in indoor applications across verticals has boosted growth of this market.
6.2.1.1.2 Smoke detectors
6.2.1.1.2.1 Growing residential sector demands photoelectric smoke detectors
6.2.1.1.3 Heat detectors
6.2.1.1.3.1 Heat detectors are best suited for fire detection in small confined spaces where rapidly growing and high-heat-output fires may be expected
6.2.1.2 Fire suppression systems
6.2.1.2.1 Fire suppression systems expected to hold largest share during forecast period
6.2.1.3 Fire sprinkler systems
6.2.1.3.1 Fire sprinkler systems are increasingly being used in smart buildings and homes
6.2.1.4 Fire analysis systems
6.2.1.4.1 Fire mapping and analysis software
6.2.1.4.1.1 Fire mapping and analysis software helps decision makers to efficiently and quickly make decisions during fire-related situations
6.2.1.4.2 Fire modeling and simulation software
6.2.1.4.2.1 Fire modeling and simulation software is used by agencies to train firefighters
6.2.1.5 Fire response systems
6.2.1.5.1 Fire response systems to hold second-largest size of fire protection systems market during forecast period
6.2.2 VIDEO SURVEILLANCE SYSTEMS
6.2.2.1 Hardware
6.2.2.1.1 Cameras
6.2.2.1.1.1 IP cameras are expected to continue to dominate video surveillance camera market
6.2.2.1.2 Monitors
6.2.2.1.2.1 Growing use of LCD and LED monitors in video surveillance systems
6.2.2.1.3 Storage devices
6.2.2.1.3.1 Market for storage devices is expected to grow at highest CAGR during forecast period
6.2.2.1.4 Other Accessories
6.2.2.2 Software
6.2.2.2.1 Video analytics
6.2.2.2.1.1 Video analytics market expected to grow at higher CAGR during forecast period
6.2.2.2.2 Video management software
6.2.2.2.2.1 Video management software expected to hold larger share during forecast period
6.2.3 ACCESS CONTROL SYSTEMS
6.2.3.1 Hardware
6.2.3.1.1 Card-based readers
6.2.3.1.1.1 Magnetic stripe readers
6.2.3.1.1.2 Proximity card readers
6.2.3.1.1.3 Smart card readers
6.2.3.1.2 Biometric readers
6.2.3.1.2.1 Fingerprint recognition
6.2.3.1.2.2 Palm recognition
6.2.3.1.2.3 Iris recognition
6.2.3.1.2.4 Facial recognition
6.2.3.1.2.5 Voice recognition
6.2.3.1.3 Multitechnology readers
6.2.3.1.4 Electronic locks
6.2.3.1.4.1 Electromagnetic locks
6.2.3.1.4.2 Electric strike locks
6.2.3.1.4.3 Smart locks
6.2.3.1.5 Controllers
6.2.3.1.6 Others
6.2.3.2 Software
6.2.4 ENTRANCE CONTROL SYSTEMS
6.2.4.1 Market for entrance control systems for pedestrians in APAC to grow at highest CAGR during forecast period
6.2.5 INTRUDER ALARMS
6.2.5.1 Rising number of burglaries and crimes has increased demand for intruder alarms
6.2.6 THERMAL CAMERAS
6.2.6.1 Thermal cameras are being implemented by American government and law enforcement agencies in many public places, such as airports, malls, railway stations, and tunnels, for public security
6.3 SERVICES
6.3.1 SECURITY SYSTEMS INTEGRATION
6.3.1.1 Security system integration services to occupy largest share of security solutions market during forecast period
6.3.2 REMOTE MONITORING SERVICES
6.3.2.1 Remote monitoring services to witness highest growth in Europe
6.3.3 FIRE PROTECTION SERVICES
6.3.3.1 Engineering services
6.3.3.1.1 Need for guidelines on fire safety measures and ways to prevent fire accidents drives demand for engineering services
6.3.3.2 Installation and design services
6.3.3.2.1 Growing commercial and industrial verticals boost requirements for installation and design services
6.3.3.3 Maintenance services
6.3.3.3.1 Necessity of timely maintenance and inspection of fire protection systems surge demand for maintenance services
6.3.3.4 Managed services
6.3.3.4.1 Managed services ensure security of business information and smooth functioning of business operations
6.3.3.5 Other services
6.3.4 VIDEO SURVEILLANCE SERVICES
6.3.4.1 Video Surveillance as a Service
6.3.4.1.1 Remote management of recording, storing, viewing, and monitoring surveillance videos from other locations driving demand for Video Surveillance as a Service
6.3.4.2 Installation and maintenance
6.3.4.2.1 Inspection, repair, and planned maintenance of video surveillance systems surge demand for installation and maintenance services
6.3.5 ACCESS CONTROL SERVICES
6.3.5.1 Installation and integration
6.3.5.1.1 Growing implementation of security solutions to increase demand for installation and integration services
6.3.5.2 Support and maintenance
6.3.5.2.1 Periodical upgrading of access control software and hardware to drive demand for installation and integration services
6.3.5.3 Access control as a Service
6.3.5.3.1 Rising use of mobile devices as authentication checkpoints and increasing number of connected devices driving demand for Access Control as a Service
7 SECURITY SOLUTIONS MARKET, BY VERTICAL (Page No. - 85)
7.1 INTRODUCTION
7.2 COMMERCIAL
7.2.1 INSTALLATION OF SECURITY SYSTEMS MINIMIZES RISK OF ANY SECURITY BREACH IN DATA CENTERS, BANKING BUILDINGS, AND HOSPITALITY CENTERS AMONG OTHERS
7.3 RESIDENTIAL
7.3.1 SECURITY SOLUTIONS MARKET FOR RESIDENTIAL VERTICAL TO GROW AT HIGHEST CAGR DURING FORECAST PERIOD
7.4 GOVERNMENT
7.4.1 DEMAND FOR FIRE PROTECTION SERVICES AND ACCESS CONTROL SYSTEMS FROM GOVERNMENT-OWNED BUSINESSES AND VARIOUS GOVERNMENT INSTITUTIONS DRIVES MARKET GROWTH
7.5 TRANSPORTATION
7.5.1 TRANSPORTATION REQUIRES SECURITY SYSTEMS DUE TO LIFE SAFETY AND SECURITY CHALLENGES FACED BY THIS SECTOR
7.6 RETAIL
7.6.1 RISE IN NUMBER OF RETAIL SHOPS AND MALLS IN URBAN AREAS DRIVES MARKET GROWTH
7.7 BANKING & FINANCE
7.7.1 NEED FOR HIGH SECURITY IN BANKING SECTOR TO BOOST MARKET DURING FORECAST PERIOD
7.8 EDUCATION
7.8.1 INSTALLATION OF FIRE PROTECTION SYSTEMS MINIMIZES RISK OF ANY FIRE HAZARD IN EDUCATIONAL OR ACADEMIC BUILDINGS
7.9 INDUSTRIAL
7.9.1 INDUSTRIAL VERTICAL IS ADOPTING SECURITY SOLUTIONS TO PROVIDE SECURE ENVIRONMENT
7.10 ENERGY AND UTILITY
7.10.1 INCREASED NEED FOR ENERGY GENERATION PROVES TO BE GREAT OPPORTUNITY FOR FIRE PROTECTION PROVIDERS
7.11 SPORTS AND LEISURE
7.11.1 INCREASING THREAT OF TERRORISM AT STADIUMS AND PLAYGROUNDS BOOSTS GROWTH OF MARKET FOR SPORTS AND LEISURE VERTICAL
7.12 HEALTHCARE
7.12.1 HEALTHCARE VERTICAL HAS SIGNIFICANT GROWTH OPPORTUNITY FOR BIOMETRICS TECHNOLOGY
7.13 MILITARY & DEFENSE
7.13.1 NEED FOR HIGH SECURE ENVIRONMENT DRIVES DEMAND FOR SECURITY SOLUTIONS IN MILITARY & DEFENSE VERTICAL
8 SECURITY SOLUTIONS MARKET, BY GEOGRAPHY (Page No. - 107)
8.1 INTRODUCTION
8.2 AMERICAS
8.2.1 US
8.2.1.1 US is leading provider of access control systems and video surveillance systems
8.2.2 CANADA
8.2.2.1 Adoption of access control systems in Canada is driven by high demand for security in industrial and government verticals
8.2.3 MEXICO
8.2.3.1 Public and private institutions in Mexico are installing and integrating security systems, including access control systems
8.2.4 BRAZIL
8.2.4.1 Brazil holds potential market opportunities for security solutions in residential vertical
8.2.5 REST OF AMERICAS
8.3 EUROPE
8.3.1 GERMANY
8.3.1.1 German enterprises and businesses are at forefront for deploying different types of biometric access control systems
8.3.2 UK
8.3.2.1 City surveillance is major application area in UK security solutions market
8.3.3 FRANCE
8.3.3.1 Rise in terror attacks has led to increase in deployment of security solutions in France
8.3.4 ITALY
8.3.4.1 Enhancing homeland security and combating illegal immigration are major opportunities for security solutions market in Italy
8.3.5 RUSSIA
8.3.5.1 Crime and terrorism leading to high demand for security solutions in Russia
8.3.6 REST OF EUROPE
8.4 APAC
8.4.1 CHINA
8.4.1.1 China is coming up with strict laws and regulations for mandatory installations of fire protection systems in buildings
8.4.2 JAPAN
8.4.2.1 Japan is vibrant market for biometric-based access control systems
8.4.3 SOUTH KOREA
8.4.3.1 South Korea presents enormous opportunities for video surveillance system manufacturers and distributors
8.4.4 INDIA
8.4.4.1 To combat threat of terrorist attacks and other security breaches, there is high demand for advanced security products
8.4.5 REST OF APAC
8.5 ROW
8.5.1 MIDDLE EAST
8.5.1.1 Growing number of residential projects in Middle Eastern countries expected to drive security solutions market in this region
8.5.2 AFRICA
8.5.2.1 Increasing investments in transportation vertical and growth in government spending to strengthen border security are driving security solutions market in Africa
9 COMPETITIVE LANDSCAPE (Page No. - 133)
9.1 OVERVIEW
9.2 MARKET PLAYER RANKING ANALYSIS
9.3 COMPETITIVE LEADERSHIP MAPPING
9.3.1 VISIONARY LEADERS
9.3.2 INNOVATORS
9.3.3 DYNAMIC DIFFERENTIATORS
9.3.4 EMERGING COMPANIES
9.4 STRENGTH OF PRODUCT PORTFOLIO
9.5 BUSINESS STRATEGY EXCELLENCE
9.6 COMPETITIVE SCENARIO
9.6.1 PRODUCT LAUNCHES, PRODUCT DEVELOPMENTS, AND EXPANSIONS
9.6.2 AGREEMENTS, ACQUISITIONS, COLLABORATIONS, AND PARTNERSHIPS
10 COMPANY PROFILES (Page No. - 141)
10.1 INTRODUCTION
10.2 KEY PLAYERS
(Business Overview, Products /Services/Solutions Offered, Recent Developments, SWOT Analysis, and MnM View)*
10.2.1 JOHNSON CONTROLS
10.2.2 HONEYWELL INTERNATIONAL INC
10.2.3 ROBERT BOSCH
10.2.4 ADT
10.2.5 HIKVISION
10.2.6 DAHUA TECHNOLOGY CO., LTD
10.2.7 AXIS COMMUNICATIONS AB
10.2.8 SECOM CO., LTD
10.2.9 UNITED TECHNOLOGIES
10.2.10 ASSA ABLOY
*Details on Business Overview, Products /Services/Solutions Offered, Recent Developments, SWOT Analysis, and MnM View might not be captured in case of unlisted companies.
10.3 RIGHT TO WIN
10.4 OTHER KEY PLAYERS
10.4.1 SIEMENS
10.4.2 HALMA
10.4.3 HOCHIKI CORPORATION
10.4.4 DORMAKABA HOLDING AG
10.4.5 FLIR SYSTEMS, INC.
10.4.6 ALLEGION PLC
10.4.7 NORTEK SECURITY AND CONTROL
10.4.8 GODREJ & BOYCE MFG. CO. LTD.
10.4.9 ALARM.COM
10.4.10 AVIGILON
10.4.11 DALLMEIER ELECTRONIC GMBH & CO.KG
10.4.12 STANLEY CONVERGENT SECURITY SOLUTIONS, INC.
10.4.13 GUNNEBO AB
10.4.14 CONTROL4 CORPORATION
10.4.15 MINIMAX VIKING
11 APPENDIX (Page No. - 178)
11.1 DISCUSSION GUIDE
11.2 KNOWLEDGE STORE: MARKETSANDMARKETS’ SUBSCRIPTION PORTAL
11.3 AVAILABLE CUSTOMIZATIONS
11.4 RELATED REPORTS
11.5 AUTHOR DETAILS
LIST OF TABLES (103 TABLES)
TABLE 1 TOP 10 COUNTRIES WITH HIGHEST NUMBER OF TERROR ATTACKS AND FATALITIES, 2018
TABLE 2 SECURITY SOLUTIONS MARKET, BY OFFERING, 2016–2024 (USD MILLION)
TABLE 3 SECURITY SOLUTIONS MARKET, BY PRODUCT, 2016–2024 (USD MILLION)
TABLE 4 SECURITY SOLUTIONS MARKET FOR FIRE PROTECTION SYSTEMS, BY TYPE, 2016–2024 (USD MILLION)
TABLE 5 FIRE PROTECTION SYSTEMS MARKET FOR FIRE DETECTION, BY TYPE, 2016–2024 (USD MILLION)
TABLE 6 FIRE PROTECTION SYSTEMS MARKET FOR FIRE SPRINKLERS, BY TYPE, 2016–2024 (USD MILLION)
TABLE 7 FIRE PROTECTION SYSTEMS MARKET, BY REGION, 2016–2024 (USD MILLION)
TABLE 8 VIDEO SURVEILLANCE SYSTEMS MARKET, BY OFFERING, 2016–2024 (USD MILLION)
TABLE 9 VIDEO SURVEILLANCE HARDWARE MARKET, BY TYPE, 2016–2024 (USD MILLION)
TABLE 10 VIDEO SURVEILLANCE CAMERA MARKET, BY TYPE, 2016–2024 (USD MILLION)
TABLE 11 VIDEO SURVEILLANCE CAMERA MARKET, BY CONNECTIVITY, 2016–2024 (USD MILLION)
TABLE 12 VIDEO SURVEILLANCE SOFTWARE MARKET, BY TYPE, 2016–2024 (USD MILLION)
TABLE 13 VIDEO SURVEILLANCE SYSTEMS MARKET, BY REGION, 2016–2024 (USD MILLION)
TABLE 14 ACCESS CONTROL SYSTEMS MARKET, BY OFFERING, 2016–2024 (USD MILLION)
TABLE 15 ACCESS CONTROL HARDWARE MARKET, BY PRODUCT, 2016–2024 (USD MILLION)
TABLE 16 ACCESS CONTROL SYSTEMS MARKET FOR CARD-BASED READERS, BY TYPE, 2016–2024 (USD MILLION)
TABLE 17 ACCESS CONTROL SYSTEMS MARKET FOR SMARTCARDS AND READERS, BY TYPE, 2016–2024 (USD MILLION)
TABLE 18 ACCESS CONTROL SYSTEMS MARKET FOR BIOMETRIC READERS, BY TYPE, 2016–2024 (USD MILLION)
TABLE 19 ACCESS CONTROL SYSTEMS MARKET FOR ELECTRONIC LOCKS, BY TYPE, 2016–2024 (USD MILLION)
TABLE 20 ACCESS CONTROL SYSTEMS MARKET FOR CONTROLLERS, BY TYPE, 2016–2024 (USD MILLION)
TABLE 21 ACCESS CONTROL SOFTWARE MARKET, BY TYPE, 2016–2024 (USD MILLION)
TABLE 22 ACCESS CONTROL SYSTEMS MARKET, BY REGION, 2016–2024 (USD MILLION)
TABLE 23 ENTRANCE CONTROL SYSTEMS MARKET, BY REGION, 2016–2024 (USD MILLION)
TABLE 24 INTRUDER ALARMS SYSTEMS MARKET, BY REGION, 2016–2024 (USD MILLION)
TABLE 25 THERMAL CAMERAS MARKET, BY REGION, 2016–2024 (USD MILLION)
TABLE 26 SECURITY SOLUTIONS MARKET, BY SERVICE, 2016–2024 (USD MILLION)
TABLE 27 SECURITY SYSTEMS INTEGRATION SERVICES MARKET, BY REGION, 2016–2024 (USD MILLION)
TABLE 28 REMOTE MONITORING SERVICES MARKET, BY REGION, 2016–2024 (USD MILLION)
TABLE 29 FIRE PROTECTION SERVICES MARKET, BY TYPE, 2016–2024 (USD MILLION)
TABLE 30 FIRE PROTECTION SERVICES MARKET, BY REGION, 2016–2024 (USD MILLION)
TABLE 31 VIDEO SURVEILLANCE SERVICES MARKET, BY TYPE, 2016–2024 (USD MILLION)
TABLE 32 VIDEO SURVEILLANCE SERVICES MARKET, BY REGION, 2016–2024 (USD MILLION)
TABLE 33 ACCESS CONTROL SERVICES MARKET, BY TYPE, 2016–2024 (USD MILLION)
TABLE 34 ACCESS CONTROL AS A SERVICE MARKET, BY TYPE, 2016–2024 (USD MILLION)
TABLE 35 ACCESS CONTROL SERVICES MARKET, BY REGION, 2016–2024 (USD MILLION)
TABLE 36 SECURITY SOLUTIONS MARKET, BY VERTICAL, 2016–2024 (USD MILLION)
TABLE 37 SECURITY SOLUTIONS MARKET FOR PRODUCTS, BY VERTICAL, 2016–2024 (USD MILLION)
TABLE 38 SECURITY SOLUTIONS MARKET FOR SERVICES, BY VERTICAL, 2016–2024 (USD MILLION)
TABLE 39 SECURITY SOLUTIONS MARKET FOR COMMERCIAL VERTICAL, BY OFFERING, 2016–2024 (USD MILLION)
TABLE 40 SECURITY SOLUTIONS PRODUCT MARKET FOR COMMERCIAL VERTICAL, BY REGION, 2016–2024 (USD MILLION)
TABLE 41 SECURITY SOLUTIONS SERVICES MARKET FOR COMMERCIAL VERTICAL, BY REGION, 2016–2024 (USD MILLION)
TABLE 42 SECURITY SOLUTIONS MARKET FOR RESIDENTIAL VERTICAL, BY OFFERING, 2016–2024 (USD MILLION)
TABLE 43 SECURITY SOLUTIONS PRODUCT MARKET FOR RESIDENTIAL VERTICAL, BY REGION, 2016–2024 (USD MILLION)
TABLE 44 SECURITY SOLUTIONS SERVICES MARKET FOR RESIDENTIAL VERTICAL, BY REGION, 2016–2024 (USD MILLION)
TABLE 45 SECURITY SOLUTIONS MARKET FOR GOVERNMENT VERTICAL, BY OFFERING, 2016–2024 (USD MILLION)
TABLE 46 SECURITY SOLUTIONS PRODUCT MARKET FOR GOVERNMENT VERTICAL, BY REGION, 2016–2024 (USD MILLION)
TABLE 47 SECURITY SOLUTIONS SERVICES MARKET FOR GOVERNMENT VERTICAL, BY REGION, 2016–2024 (USD MILLION)
TABLE 48 SECURITY SOLUTIONS MARKET FOR TRANSPORTATION, BY OFFERING, 2016–2024 (USD MILLION)
TABLE 49 SECURITY SOLUTIONS PRODUCT MARKET FOR TRANSPORTATION, BY REGION, 2016–2024 (USD MILLION)
TABLE 50 SECURITY SOLUTIONS SERVICES MARKET FOR TRANSPORTATION, BY REGION, 2016–2024 (USD MILLION)
TABLE 51 SECURITY SOLUTIONS MARKET FOR RETAIL, BY OFFERING, 2016–2024 (USD MILLION)
TABLE 52 SECURITY SOLUTIONS PRODUCT MARKET FOR RETAIL, BY REGION, 2016–2024 (USD MILLION)
TABLE 53 SECURITY SOLUTIONS SERVICES MARKET FOR RETAIL, BY REGION, 2016–2024 (USD MILLION)
TABLE 54 SECURITY SOLUTIONS MARKET FOR BANKING & FINANCE, BY OFFERING, 2016–2024 (USD MILLION)
TABLE 55 SECURITY SOLUTIONS PRODUCT MARKET FOR BANKING & FINANCE, BY REGION, 2016–2024 (USD MILLION)
TABLE 56 SECURITY SOLUTIONS SERVICES MARKET FOR BANKING & FINANCE, BY REGION, 2016–2024 (USD MILLION)
TABLE 57 SECURITY SOLUTIONS MARKET FOR EDUCATION VERTICAL, BY OFFERING, 2016–2024 (USD MILLION)
TABLE 58 SECURITY SOLUTIONS PRODUCT MARKET FOR EDUCATION VERTICAL, BY REGION, 2016–2024 (USD MILLION)
TABLE 59 SECURITY SOLUTIONS SERVICES MARKET FOR EDUCATION VERTICAL, BY REGION, 2016–2024 (USD MILLION)
TABLE 60 SECURITY SOLUTIONS MARKET FOR INDUSTRIAL VERTICAL, BY OFFERING, 2016–2024 (USD MILLION)
TABLE 61 SECURITY SOLUTIONS PRODUCT MARKET FOR INDUSTRIAL VERTICAL, BY REGION, 2016–2024 (USD MILLION)
TABLE 62 SECURITY SOLUTIONS SERVICES MARKET FOR INDUSTRIAL VERTICAL, BY REGION, 2016–2024 (USD MILLION)
TABLE 63 SECURITY SOLUTIONS MARKET FOR ENERGY AND UTILITY VERTICAL, BY OFFERING, 2016–2024 (USD MILLION)
TABLE 64 SECURITY SOLUTIONS PRODUCT MARKET FOR ENERGY AND UTILITY VERTICAL, BY REGION, 2016–2024 (USD MILLION)
TABLE 65 SECURITY SOLUTIONS SERVICES MARKET FOR ENERGY AND UTILITY VERTICAL, BY REGION, 2016–2024 (USD MILLION)
TABLE 66 SECURITY SOLUTIONS MARKET FOR SPORTS AND LEISURE VERTICAL, BY OFFERING, 2016–2024 (USD MILLION)
TABLE 67 SECURITY SOLUTIONS PRODUCT MARKET FOR SPORTS AND LEISURE VERTICAL, BY REGION, 2016–2024 (USD MILLION)
TABLE 68 SECURITY SOLUTIONS SERVICES MARKET FOR SPORTS AND LEISURE VERTICAL, BY REGION, 2016–2024 (USD MILLION)
TABLE 69 SECURITY SOLUTIONS MARKET FOR HEALTHCARE VERTICAL, BY OFFERING, 2016–2024 (USD MILLION)
TABLE 70 SECURITY SOLUTIONS PRODUCT MARKET FOR HEALTHCARE VERTICAL, BY REGION, 2016–2024 (USD MILLION)
TABLE 71 SECURITY SOLUTIONS SERVICES MARKET FOR HEALTHCARE VERTICAL, BY REGION, 2016–2024 (USD MILLION)
TABLE 72 SECURITY SOLUTIONS MARKET FOR MILITARY & DEFENSE VERTICAL, BY OFFERING, 2016–2024 (USD MILLION)
TABLE 73 SECURITY SOLUTIONS PRODUCT MARKET FOR MILITARY & DEFENSE VERTICAL, BY REGION, 2016–2024 (USD MILLION)
TABLE 74 SECURITY SOLUTIONS SERVICES MARKET FOR MILITARY & DEFENSE VERTICAL, BY REGION, 2016–2024 (USD MILLION)
TABLE 75 SECURITY SOLUTIONS MARKET, BY REGION, 2016–2024 (USD MILLION)
TABLE 76 SECURITY SOLUTIONS PRODUCT MARKET, BY REGION, 2016–2024 (USD MILLION)
TABLE 77 SECURITY SOLUTIONS SERVICES MARKET, BY REGION, 2016–2024 (USD MILLION)
TABLE 78 SECURITY SOLUTIONS MARKET IN AMERICAS, BY OFFERING, 2016–2024 (USD MILLION)
TABLE 79 SECURITY SOLUTIONS PRODUCT MARKET IN AMERICAS, BY VERTICAL, 2016–2024 (USD MILLION)
TABLE 80 SECURITY SOLUTIONS SERVICES MARKET IN AMERICAS, BY VERTICAL, 2016–2024 (USD MILLION)
TABLE 81 SECURITY SOLUTIONS MARKET IN AMERICAS, BY PRODUCT, 2016–2024 (USD MILLION)
TABLE 82 SECURITY SOLUTIONS MARKET IN AMERICAS, BY SERVICE, 2016–2024 (USD MILLION)
TABLE 83 SECURITY SOLUTIONS MARKET IN AMERICAS, BY COUNTRY, 2016–2024 (USD MILLION)
TABLE 84 SECURITY SOLUTIONS MARKET IN EUROPE, BY OFFERING, 2016–2024 (USD MILLION)
TABLE 85 SECURITY SOLUTIONS PRODUCT MARKET IN EUROPE, BY VERTICAL, 2016–2024 (USD MILLION)
TABLE 86 SECURITY SOLUTIONS SERVICES MARKET IN EUROPE, BY VERTICAL, 2016–2024 (USD MILLION)
TABLE 87 SECURITY SOLUTIONS MARKET IN EUROPE, BY PRODUCT, 2016–2024 (USD MILLION)
TABLE 88 SECURITY SOLUTIONS MARKET IN EUROPE, BY SERVICE, 2016–2024 (USD MILLION)
TABLE 89 SECURITY SOLUTIONS MARKET IN EUROPE, BY COUNTRY, 2016–2024 (USD MILLION)
TABLE 90 SECURITY SOLUTIONS MARKET IN APAC, BY OFFERING, 2016–2024 (USD MILLION)
TABLE 91 SECURITY SOLUTIONS PRODUCT MARKET IN APAC, BY VERTICAL, 2016–2024 (USD MILLION)
TABLE 92 SECURITY SOLUTIONS SERVICES MARKET IN APAC, VERTICAL, 2016–2024 (USD MILLION)
TABLE 93 SECURITY SOLUTIONS MARKET IN APAC, BY PRODUCT, 2016–2024 (USD MILLION)
TABLE 94 SECURITY SOLUTIONS MARKET IN APAC, BY SERVICE, 2016–2024 (USD MILLION)
TABLE 95 SECURITY SOLUTIONS MARKET IN APAC, BY COUNTRY, 2016–2024 (USD MILLION)
TABLE 96 SECURITY SOLUTIONS MARKET IN ROW, BY OFFERING, 2016–2024 (USD MILLION)
TABLE 97 SECURITY SOLUTIONS PRODUCT MARKET IN ROW, BY VERTICAL, 2016–2024 (USD MILLION)
TABLE 98 SECURITY SOLUTIONS SERVICES MARKET IN ROW, BY VERTICAL, 2016–2024 (USD MILLION)
TABLE 99 SECURITY SOLUTIONS MARKET IN ROW, BY PRODUCT, 2016–2024 (USD MILLION)
TABLE 100 SECURITY SOLUTIONS MARKET IN ROW, BY SERVICE, 2016–2024 (USD MILLION)
TABLE 101 SECURITY SOLUTIONS MARKET IN ROW, BY OFFERING, 2016–2024 (USD MILLION)
TABLE 102 10 MOST RECENT PRODUCT LAUNCHES, PRODUCT DEVELOPMENTS, AND EXPANSIONS IN SECURITY SOLUTIONS MARKET
TABLE 103 5 MOST RECENT AGREEMENTS, ACQUISITIONS, COLLABORATIONS, AND PARTNERSHIPS IN SECURITY SOLUTIONS MARKET
LIST OF FIGURES (41 FIGURES)
FIGURE 1 SECURITY SOLUTIONS MARKET: RESEARCH DESIGN
FIGURE 2 PROCESS FLOW
FIGURE 3 MARKET SIZE ESTIMATION METHODOLOGY: BOTTOM-UP APPROACH
FIGURE 4 MARKET SIZE ESTIMATION METHODOLOGY: TOP-DOWN APPROACH
FIGURE 5 MARKET BREAKDOWN AND DATA TRIANGULATION
FIGURE 6 ASSUMPTIONS FOR RESEARCH STUDY
FIGURE 7 MARKET FOR SECURITY PRODUCTS EXPECTED TO GROW AT HIGHER CAGR DURING FORECAST PERIOD
FIGURE 8 SECURITY SOLUTIONS PRODUCT MARKET FOR VIDEO SURVEILLANCE SYSTEMS TO GROW AT HIGHEST CAGR DURING FORECAST PERIOD
FIGURE 9 SECURITY SOLUTIONS SERVICES MARKET FOR VIDEO SURVEILLANCE SERVICES TO GROW AT HIGHEST CAGR DURING FORECAST PERIOD
FIGURE 10 SECURITY SOLUTIONS MARKET FOR COMMERCIAL VERTICAL TO HOLD LARGEST MARKET SIZE DURING FORECAST PERIOD
FIGURE 11 SECURITY SOLUTIONS MARKET IN APAC TO GROW AT HIGHEST CAGR DURING FORECAST PERIOD
FIGURE 12 GROWING CRIME RATES AND TERRORIST ACTIVITIES GLOBALLY ARE DRIVING SECURITY SOLUTIONS MARKET GROWTH
FIGURE 13 TRANSPORTATION VERTICAL TO HOLD LARGEST SHARE OF SECURITY SOLUTIONS PRODUCT MARKET IN APAC IN 2019
FIGURE 14 SERVICES TO HOLD LARGER SIZE OF SECURITY SOLUTIONS MARKET DURING FORECAST PERIOD
FIGURE 15 VIDEO SURVEILLANCE SYSTEMS MARKET FOR SOFTWARE EXPECTED TO GROW AT HIGHER CAGR FROM 2019 TO 2024
FIGURE 16 US TO BE LARGEST SHAREHOLDER IN SECURITY SOLUTIONS MARKET IN 2019
FIGURE 17 SECURITY SOLUTIONS MARKET: DRIVERS, RESTRAINTS, OPPORTUNITIES, AND CHALLENGES
FIGURE 18 SECURITY SOLUTIONS MARKET DRIVERS AND THEIR IMPACT
FIGURE 19 SECURITY SOLUTIONS MARKET RESTRAINT AND ITS IMPACT
FIGURE 20 SECURITY SOLUTIONS MARKET OPPORTUNITIES AND THEIR IMPACT
FIGURE 21 SECURITY SOLUTIONS MARKET CHALLENGES AND THEIR IMPACT
FIGURE 22 VALUE CHAIN ANALYSIS: SECURITY SOLUTIONS MARKET
FIGURE 23 MARKET FOR SECURITY PRODUCTS EXPECTED TO GROW AT A HIGHER CAGR DURING FORECAST PERIOD
FIGURE 24 MARKET FOR VIDEO SURVEILLANCE SYSTEMS TO GROW AT HIGHEST CAGR DURING FORECAST PERIOD
FIGURE 25 SECURITY SOLUTIONS MARKET FOR RESIDENTIAL SEGMENT IS EXPECTED TO GROW AT HIGHEST CAGR DURING FORECAST PERIOD
FIGURE 26 COUNTRIES IN APAC EXPECTED TO WITNESS SIGNIFICANT GROWTH IN SECURITY SOLUTIONS MARKET DURING FORECAST PERIOD
FIGURE 27 AMERICAS: SECURITY SOLUTIONS MARKET SNAPSHOT
FIGURE 28 EUROPE: SECURITY SOLUTIONS MARKET SNAPSHOT
FIGURE 29 APAC: SECURITY SOLUTIONS MARKET SNAPSHOT
FIGURE 30 STRATEGIES ADOPTED BY SECURITY SOLUTIONS MARKET PLAYERS FROM JANUARY 2018 TO NOVEMBER 2019
FIGURE 31 TOP 5 PLAYERS IN SECURITY SOLUTIONS MARKET, 2018
FIGURE 32 SECURITY SOLUTIONS MARKET (GLOBAL) COMPETITIVE LEADERSHIP MAPPING, 2018
FIGURE 33 JOHNSON CONTROLS: COMPANY SNAPSHOT
FIGURE 34 HONEYWELL INTERNATIONAL INC: COMPANY SNAPSHOT
FIGURE 35 ROBERT BOSCH: COMPANY SNAPSHOT
FIGURE 36 ADT: COMPANY SNAPSHOT
FIGURE 37 HIKVISION: COMPANY SNAPSHOT
FIGURE 38 DAHUA TECHNOLOGY CO., LTD : COMPANY SNAPSHOT
FIGURE 39 SECOM CO.,LTD: COMPANY SNAPSHOT
FIGURE 40 UNITED TECHNOLOGIES: COMPANY SNAPSHOT
FIGURE 41 ASSA ABLOY: COMPANY SNAPSHOT
The study involved 4 major activities in estimating the size of the security solutions market. Exhaustive secondary research has been done to collect information on the security solutions market. Validation of these findings, assumptions, and sizing with industry experts across value chain through primary research has been the next step. Both top-down and bottom-up approaches have been employed to estimate the complete market size. After that, market breakdown and data triangulation have been used to estimate the market size of segments and subsegments.
Secondary Research
In the secondary research, various secondary sources have been referred to for identifying and collecting information important for this study. Secondary sources include corporate filings (such as annual reports, investor presentations, and financial statements); trade, business, and professional associations; white papers, security–related journals, and certified publications; articles from recognized authors; gold and silver standard websites; directories; and databases. Few examples of secondary sources are Federal Aviation Administration (FAA), VideoSurveillance.com, Electronic Security Association (ESA), Security Magazine, and National Fire Protection Association (NFPA).
Primary Research
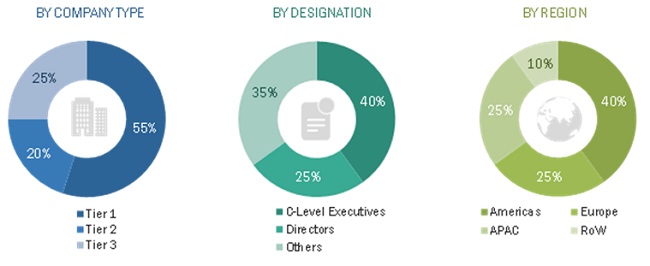
In the primary research, various primary sources from both the supply and demand sides have been interviewed to obtain the qualitative and quantitative information for this report. Primary sources from the supply side include industry experts such as CEOs, VPs, marketing directors, technology and innovation directors, and related key executives from major companies and organizations operating in the security solutions market. Following is the breakdown of primary respondents.
To know about the assumptions considered for the study, download the pdf brochure
Market Size Estimation
Both top-down and bottom-up approaches have been used to estimate and validate the size of the security solutions market and its subsegments. The research methodology used to estimate the market size includes the following:
- Key players in the market have been identified through extensive secondary research
- The industry’s supply chain and market size, in terms of value, have been determined through primary and secondary research processes
- All percentage shares, splits, and breakdowns have been determined using secondary sources and verified through primary sources
Data Triangulation
After arriving at the overall market size—using the estimation processes explained above—the market has been split into several segments and subsegments. To complete the overall market engineering process and arrive at the exact statistics of each market segment and subsegment, data triangulation and market breakdown procedures have been employed, wherever applicable. The data has been triangulated by studying various factors and trends in both demand and supply sides of the security solutions market.
Report Objectives
- To define and forecast the security solutions market, in terms of value, segmented by offering, vertical, and geography
- To forecast the market size, in terms of value, for various segments with respect to four main regions: the Americas, Europe, Asia Pacific (APAC), and the Rest of the World (RoW)
- To strategically analyze micromarkets1 with respect to their individual growth trends, prospects, and contributions to the overall security solutions market
- To provide detailed information regarding the major factors (drivers, restraints, opportunities, and challenges) influencing the growth of the security solutions market
- To analyze opportunities in the market for various stakeholders by identifying high-growth segments of the security solutions market
- To study allied industry segments and perform a value chain analysis of security solutions
- To map competitive intelligence based on company profiles, key player strategies, and key developments
- To strategically profile key players and comprehensively analyze their market ranking and core competencies2
- To track and analyze competitive developments such as contracts, agreements, partnerships, joint ventures, acquisitions, expansions, product launches/developments, and research and development (R&D) activities in the security solutions market
Available Customizations
Along with the market data, MarketsandMarkets offers customizations according to a company’s specific needs. The following customization options are available for the report:
Company Information
- Detailed analysis and profiling of additional market players (up to 5)


Growth opportunities and latent adjacency in Security Solutions Market