HVDC Transmission Market by Component (Converter Stations, Transmission Cables, and Others), Project Type (Point-to-Point, Back-to-Back, and Multi-Terminal), Technology (CCC, VSC, and lCC), Application, and Geography - Global Forecast to 2024


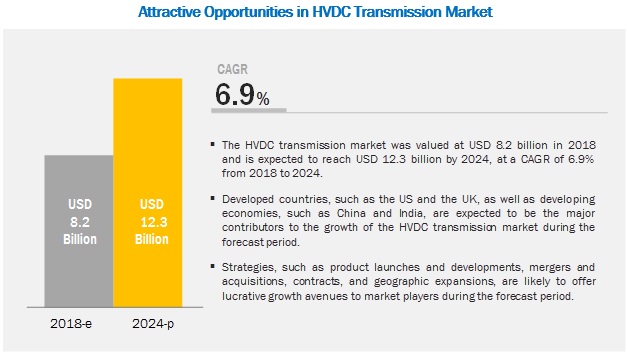
HVDC transmission market report share is projected to reach USD 12.3 billion by 2024 at a CAGR of 6.9% during 20182024. Major drivers for the markets growth are optimal solutions for long distance transmission, growing demand for VSC technology, shift toward renewable energy, and supportive government policies and initiatives for HVDC transmission.
Infeed Urban Areas application expected to witness highest CAGR in HVDC transmission market during forecast period
HVDC systems are ideal for feeding electricity into densely populated urban centers, where the density of required overhead wires could cause significant obstructions. Despite being more expensive, underground power lines utilization is increasing in urban areas. Nowadays, residential and commercial developments have underground utility infrastructure, often ordered by law for aesthetic reasons.
HVDC transmission Market for VSC-based technology to grow at highest CAGR during 20182024
VSC technology converts AC voltage to DC voltage by using insulated gate bipolar transistors (IGBTs) and pulse width modulation (PWM), or through switching in and out of smaller DC capacitors. There are 2 types of voltage converters: voltage inverters and voltage rectifiers. The main function of a VSC-HVDC system is to transmit constant DC power from a rectifier to an inverter. The switching off capability means that VSC converters do not require a synchronous voltage for commutation. Thus, VSC converters are considered a controllable voltage source system for HVDC transmission.
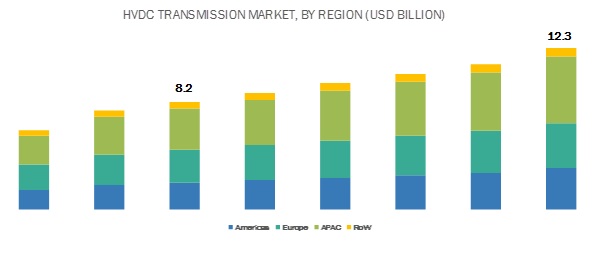
APAC expected to account for largest market share during forecast period
The HVDC transmission market in APAC is presently witnessing an exponential growth in terms of power consumption. The development of power infrastructure in this region offers many growth opportunities for market players. China is investing heavily in renewable energy and implementing latest UHVDC technology for power transmission. For instance, 2 of the worlds most powerful and longest HVDC power transmission highways, each with a nominal rating of 3,000 MW, are currently being installed in China. These factors are projected to fuel the HVDC market in APAC in the coming years.
Key players in the HVDC transmission market include ABB (Switzerland), Siemens (Germany), General Electric (US), Hitachi (Japan), Mitsubishi Electric (Japan), Nexans (France), NKT A/S (Denmark), NR Electric (China), C-EPRI Electric Power Engineering (China), and Prysmian Group (Italy). ABB is a key player in the global HVDC market. The company pioneered the HVDC technology more than 60 years ago and has bagged over 110 HVDC projects, representing over 120,000 MW of total installed capacity and accounting for around half of the globally installed HVDC base.
HVDC Transmission Market Report Scope
|
Report Attributes |
Details |
|
Market Size Value in 2018 |
USD 8.2 Billion |
| Revenue Forecast in 2024 | USD 12.3 Billion |
| Growth Rate | 6.9% |
| Base Year Considered | 2017 |
| Historical Data Available for Years | 20152024 |
|
Forecast Period |
20182024 |
|
Segments Covered |
|
|
Region Covered |
|
| Market Leaders |
|
| Top Companies in North America |
|
| Largest Growing Region | Asia Pacific |
| Largest Market Share Segment | Bulk power transmission Segment |
| Highest CAGR Segment | VSC-based technology Segment |
| Largest Application Market Share | Infeed Urban Areas Application |
This research report categorizes the HVDC transmission based on component, technology, project type, application, and region.
By Component:
- Converter Stations
- Transmission Cables
- Others
By Technology:
- Capacitor Commutated Converter (CCC) based
- Voltage Source Converter (VSC) based
- Line Commutated Converter (LCC) based
By Project Type:
- Point-to-Point
- Back-to-Back
- Multi-terminal
By Application:
- Bulk Power Transmission
- Interconnecting Grids
- Infeed Urban Areas
By Geography:
- Americas
- Europe
- Asia Pacific (APAC)
- Rest of the World (RoW)
Recent Developments
- ABB launched the ABB Ability at the 2018 Hanover Fair, in Germany. ABB Ability is claimed to be the worlds first integrated solution for digitally enabled power transformers.
- Siemens developed, manufactured, and tested a ± 1,100 kilovolts (kV), 587.1 megavolt amperes (MVA) HVDC transformer in Nuremberg, Germany.
- NR Electric launched a ±535kV/3000MW VSC-HVDC converter valve. The type test is fully compliant with IEC 62501 (2014 Edition). The converter valve withstood a 37.3kA short-circuit current and completed wet DC withstand voltage test at 1 tower.
Critical questions the report answers:
- Where will all these developments take the industry in mid to long term?
- What are the upcoming applications of HVDC transmission?
- How does the shifting focus toward renewable sector influence the HVDC transmissions market?
- What advanced technologies are expected to penetrate significantly into the HVDC transmissions market?
- What are the dynamics of the HVDC transmissions market?
- What are the regulations that are expected to have an impact on the HVDC transmissions market?
To speak to our analyst for a discussion on the above findings, click Speak to Analyst
Table of Content
1 Introduction
1.1 Study Objectives
1.2 Market Definition
1.3 Study Scope
1.3.1 Markets Covered
1.3.2 Geographic Scope
1.3.3 Years Considered
1.4 Currency
1.5 Limitations
1.6 Stakeholders
2 Research Methodology
2.1 Research Data
2.1.1 Secondary Data
2.1.1.1 Major Secondary Sources
2.1.1.2 Key Data From Secondary Sources
2.1.2 Primary Data
2.1.2.1 Primary Interviews With Experts
2.1.2.2 Breakdown of Primaries
2.1.2.3 Key Data From Primary Sources
2.1.3 Secondary and Primary Research
2.1.3.1 Key Industry Insights
2.2 Market Size Estimation
2.2.1 Bottom-Up Approach
2.2.1.1 Approach for Capturing Market Size By Bottom-Up Analysis
2.2.2 Top-Down Approach
2.2.2.1 Approach for Capturing Market Size By Top-Down Analysis(Supply Side)
2.3 Data Triangulation
2.4 Research Assumptions
3 Executive Summary
4 Premium Insights
5 Market Overview
5.1 Introduction
5.2 Market Dynamics
5.2.1 Drivers
5.2.2 Restraints
5.2.3 Opportunities
5.2.4 Challenges
6 Industry Trends
6.1 Value Chain Analysis
6.2 Regulatory Standards
6.3 Key Market Trends
6.4 Investements in Power Infrastructure Across Regions
6.5 AC Transmission vs DC Transmission
6.6 Reduction in Right-Of-Way
7 HVDC Transmission Market, By Component
7.1 Introduction
7.2 Converter Stations
7.2.1 Valves
7.2.2 Thyristor Valves
7.2.2.1 Insulated Gate Bipolar Transistors (IGBTS)
7.2.3 Transformers
7.2.4 Harmonic Filters
7.2.4.1 AC Filters
7.2.4.2 DC Filters
7.2.5 Circuit Breakers
7.2.6 Reactors
7.2.7 Surge Arresters
7.3 Transmission Cables
7.4 Others
8 HVDC Transmission Market, By Project Type
8.1 Introduction
8.2 Point-to-Point Transmission
8.2.1 Monopolar
8.2.2 Bipolar
8.3 Back-to-Back Stations
8.4 Multi-Terminal Systems
9 HVDC Transmission Market, By Technology
9.1 Introduction
9.2 Capacitor Commutated Converter (CCC)
9.3 Voltage Source Converter (VSC)
9.3.1 HVDC
9.3.2 Ultra-High Voltage Direct Current (UHVDC)
9.4 Line Commutated Converter (LCC), (Thyristor Based)
9.4.1 HVDC
9.4.2 UHVDC
10 HVDC Transmission Market, By Application
10.1 Introduction
10.2 Bulk Power Transmission
10.3 Interconnecting Grids
10.4 Infeed Urban Areas
11 HVDC Transmission Market, By Transmission Type
11.1 Introduction
11.2 Overhead
11.3 Submarine & Underground
12 Geographic Analysis
12.1 Introduction
12.2 Americas
12.2.1 North America
12.2.1.1 US
12.2.1.2 Canada
12.2.1.3 Mexico
12.2.2 South America
12.2.2.1 Brazil
12.2.2.2 Rest of South America
12.3 Europe
12.3.1 UK
12.3.2 Germany
12.3.3 Russia
12.3.4 France
12.3.5 Italy
12.3.6 Spain
12.3.7 Rest of Europe
12.4 APAC
12.4.1 China
12.4.2 Japan
12.4.3 India
12.4.4 Australia
12.4.5 South Korea
12.4.6 Rest of APAC
12.5 Rest of the World (RoW)
12.5.1 Middle East
12.5.1.1 UAE
12.5.1.2 Ksa
12.5.1.3 Rest of Middle East
12.5.2 Africa
12.5.2.1 South Africa
12.5.2.2 Rest of Africa
13 Competitive Landscape
13.1 Overview
13.2 Market Ranking of Players, 2019
13.3 Competitive Scenario
13.3.1 Product Launches/Product Developments/Technological Expansions
13.3.2 Partnerships, Collaborations, Joint Ventures, and Contracts
13.3.3 Geographic Expansion
13.4 Competitive Leadership Mapping
13.4.1 Visionary Leaders
13.4.2 Dynamic Differentiators
13.4.3 Innovators
13.4.4 Emerging Companies
14 Company Profile
14.1 Key Players
14.1.1 Abb
14.1.2 Siemens
14.1.3 General Electric
14.1.4 Hitachi
14.1.5 Mitsubishi Electric
14.1.6 Nexans
14.1.7 Nkt A/S
14.1.8 Nr Electric
14.1.9 C-Epri Electric Power Engineering
14.1.10 Prysmian Group
14.2 Other Important Players
14.2.1 Schneider Electric
14.2.2 Toshiba
14.2.3 Epcos
14.2.4 Aecom
14.2.5 Psc Group
14.3 Key Innovators
14.3.1 American Superconductor
14.3.2 Transgrid Solutions
14.3.3 Atco
14.3.4 Doble Engineering Company
14.3.5 HVDC Technologies
15 Appendix
List of Tables (91 Tables)
Table 1 HVDC Transmission Market: Regulatory Standards
Table 2 HVDC Transmission Market, By Component, 20152024 (USD Billion)
Table 3 HVDC Transmission Market for Valves, By Type, 20152024 (USD Billion)
Table 4 Market, By Converter Station, 20152024 (USD Billion)
Table 5 Market, By Project Type, 20152024 (USD Billion)
Table 6 Market for Point-to-Point Transmission ,By Technology, 20152024 (USD Billion)
Table 7 Market for Point-to-Point Transmissions ,By Application, 20152024 (USD Billion)
Table 8 Market for Point-to-Point Transmissions ,By Bulk Power Transmission Application, 20152024 (USD Billion)
Table 9 Market for Point-to-Point Transmissions ,By Region, 20152024 (USD Billion)
Table 10 Market for Point-to-Point Transmissions ,By Project Type, 20152024 (USD Billion)
Table 11 Market for Point-to-Point Monopolar Transmissions, By Technology, 20152024 (USD Billion)
Table 12 Market for Point-to-Point Bipolar Transmissions, By Technology, 20152024 (USD Billion)
Table 13 Market for Point-to-Point Monopolar Transmissions, By Application, 20152024 (USD Billion)
Table 14 Market for Point-to-Point Monopolar Transmissions, By Bulk Power Transmission Application ,20152024 (USD Billion)
Table 15 Market for Point-to-Point Bipolar Transmissions, By Application, 20152024 (USD Billion)
Table 16 Market for Point-to-Point Bipolar Transmission ,By Bulk Power Transmission Application, 20152024 (USD Billion)
Table 17 Market for Point-to-Point Monopolar Transmissions, By Region, 20152024 (USD Billion)
Table 18 Market for Point-to-Point Bipolar Transmissions, By Region, 20152024 (USD Billion)
Table 19 Market for Back-to-Back Transmissions ,By Technology, 20152024 (USD Billion)
Table 20 Market for Back-to-Back Transmissions ,By Application, 20152024 (USD Billion)
Table 21 Market for Back-to-Back Transmissions ,By Bulk Power Transmission Application, 20152024 (USD Billion)
Table 22 Market for Back-to-Back Transmissions ,By Region, 20152024 (USD Billion)
Table 23 Market for Multi-Terminal Transmissions ,By Technology, 20152024 (USD Billion)
Table 24 Market for Multi-Terminal Transmissions ,By Application, 20152024 (USD Billion)
Table 25 Market for Multi-Terminal Transmissions ,By Bulk Power Transmission Application, 20152024 (USD Billion)
Table 26 Market for Multi-Terminal Transmissions ,By Region, 20152024 (USD Billion)
Table 27 Market, By Technology, 20152024 (USD Billion)
Table 28 Market for CCC-Based Technology, By Project Type, 20152024 (USD Billion)
Table 29 Market for VSC, By Technology ,20152024 (USD Billion)
Table 30 Market for VSC-Based Technology, By Project Type, 20152024 (USD Billion)
Table 31 Market for VSC-Based Technology, By Point-to-Point Project Type, 20152024 (USD Billion)
Table 32 Market for LCC, By Technology, 20152024 (USD Billion)
Table 33 Market for LCC-Based Technology, By Project Type, 20152024 (USD Billion)
Table 34 Market for LCC-Based Technology, By Point-to-Point Project Type, 20152024 (USD Billion)
Table 35 Market, By Application, 20152024 (USD Billion)
Table 36 Market for Bulk Power Transmission, By Project Type, 20152024 (USD Billion)
Table 37 Market for Bulk Power Transmission ,By Point-to-Point Project Type, 20152024 (USD Billion)
Table 38 Market, By Bulk Power Transmission Applications, 20152024 (USD Billion)
Table 39 Market for Overhead Bulk Power Transmissions, By Project Type, 20152024 (USD Billion)
Table 40 Market for Submarine & Underground Bulk Power Transmissions, By Project Type, 20152024 (USD Billion)
Table 41 Market for Interconnecting Grids, By Project Type, 20152024 (USD Billion)
Table 42 Market for Interconnecting Grids ,By Point-to-Point Project Type, 20152024 (USD Billion)
Table 43 Market for Infeed Urban Areas, By Project Type, 20152024 (USD Billion)
Table 44 Market for Infeed Urban Areas, By Point-to-Point Project Type, 20152024 (USD Billion)
Table 45 Market, By Transmission Type, 20152024 (USD Billion)
Table 46 Market for Overhead Type , By Region, 20152024 (USD Billion)
Table 47 Market for Submarine & Underground, By Region, 20152024 (USD Billion)
Table 48 Market in Americas, By Transmission Type, 20152024 (USD Billion)
Table 49 Market in North America, By Transmission Type, 20152024 (USD Billion)
Table 50 Market in South America, By Transmission Type, 20152024 (USD Billion)
Table 51 Market, By Region, 20152024 (USD Billion)
Table 52 Market in Americas, By Region ,20152024 (USD Billion)
Table 53 Market in North America, By Country ,20152024 (USD Billion)
Table 54 Market in Us, By Component ,20152024 (USD Billion)
Table 55 Market in Canada, By Component ,20152024 (USD Billion)
Table 56 Market in Mexico, By Component ,20152024 (USD Billion)
Table 57 Market in South America, By Country ,20152024 (USD Billion)
Table 58 Market in Americas, By Project Type ,20152024 (USD Billion)
Table 59 Market in Americas, By Point-to-Point Project Type, 20152024 (USD Billion)
Table 60 Market in Europe, By Country ,20152024 (USD Billion)
Table 61 Market in UK, By Component ,20152024 (USD Billion)
Table 62 Market in Germany, By Component ,20152024 (USD Billion)
Table 63 Market in France, By Component ,20152024 (USD Billion)
Table 64 Market in Russia, By Component ,20152024 (USD Billion)
Table 65 Market in Italy, By Component ,20152024 (USD Billion)
Table 66 Market in Spain, By Component ,20152024 (USD Billion)
Table 67 Market Rest of Europe, By Component ,20152024 (USD Billion)
Table 68 Market in Europe, By Project Type ,20152024 (USD Billion)
Table 69 Market in Europe, By Point-to-Point Project Type, 20152024 (USD Billion)
Table 70 Market in APAC, By Country, 20152024 (USD Billion)
Table 71 Market in China, By Component ,20152024 (USD Billion)
Table 72 Market in Japan, By Component ,20152024 (USD Billion)
Table 73 Market in Australia, By Component ,20152024 (USD Billion)
Table 74 Market in India, By Component ,20152024 (USD Billion)
Table 75 Market in South Korea, By Component ,20152024 (USD Billion)
Table 76 Market in Rest of APAC, By Component ,20152024 (USD Billion)
Table 77 Market in APAC, By Project Type ,20152024 (USD Billion)
Table 78 Market in APAC, By Point-to-Point Project Type, 20152024 (USD Billion)
Table 79 Market in RoW, By Region, 20152024 (USD Billion)
Table 80 Market in RoW, By Project Type ,20152024 (USD Billion)
Table 81 Market in Middle East, By Country ,20152024 (USD Billion)
Table 82 Market in UAE, By Component ,20152024 (USD Billion)
Table 83 Market in Saudi Arabia, By Component ,20152024 (USD Billion)
Table 84 Market in Rest of Middle East, By Component ,20152024 (USD Billion)
Table 85 Market in Africa, By Country ,20152024 (USD Billion)
Table 86 Market in South Africa, By Component ,20152024 (USD Billion)
Table 87 Market in Rest of Africa, By Component ,20152024 (USD Billion)
Table 88 Market in RoW, By Point-to-Point Project Type, 20152024 (USD Billion)
Table 89 Product Launches/Product Developments/Technological Expansions, 20152018
Table 90 Partnerships, Collaborations, Joint Ventures, and Contracts ,20152018
Table 91 Geographic Expansion, 20162017
List of Figures (48 Figures)
Figure 1 HVDC Transmission Market: Research Design
Figure 2 Market Size Estimation Methodology: Bottom-Up Approach
Figure 3 Market Size Estimation Methodology: Top-Down Approach
Figure 4 Data Triangulation
Figure 5 HVDC Transmissions Market, 20152024 (USD Billion)
Figure 6 Converter Stations to Lead HVDC Transmissions Market During Forecast Period
Figure 7 VSC-Based Technology to Grow at Highest CAGR in HVDC Transmissions Market During Forecast Period
Figure 8 Point-To-Point Project Type to Lead HVDC Transmissions Market During Forecast Period
Figure 9 Bulk Power Transmission Application to Hold Largest Share in HVDC Transmissions Market During Forecast Period
Figure 10 APAC Held Largest Share of HVDC Transmissions Market in 2017
Figure 11 HVDC Transmissions Market in APAC to Grow at Highest CAGR During Forecast Period
Figure 12 LCC-Based Technology to Lead HVDC Transmissions Market During Forecast Period
Figure 13 Market for Point-To-Point Project Type to Surpass Market for Back-To-Back By 2018
Figure 14 China Held Largest Share of HVDC Transmissions Market in 2017
Figure 15 Rapid Adoption Rate for UHVDC Technology in China Expected to Spur Growth of HVDC Transmissions Market
Figure 16 Cost Comparison Between HVDC and HVAC Grids
Figure 17 VSC-Based HVDC Projects By ABB Ltd. and Siemens Ag, 20152017
Figure 18 Major Value is Added During Project Installation & Commissioning Phase
Figure 19 HVDC Transmissions Market, By Component
Figure 20 Converter Stations to Dominate HVDC Transmissions Market Throughout Forecast Period
Figure 21 HVDC Market, By Converter Station
Figure 22 Types of Valves
Figure 23 Types of Harmonic Filters
Figure 24 HVDC Transmission Market: By Project Type
Figure 25 Point-To-Point Project Type to Hold Largest Share of HVDC Transmission Market During Forecast Period
Figure 26 Point-To-Point Transmission: Sub-Segment
Figure 27 VSC-Based Technology to Hold Largest Share of HVDC Transmission Market for Back-To-Back Project Type During Forecast Period
Figure 28 HVDC Transmission Market: By Technology
Figure 29 VSC-Based Transmissions to Grow at Highest CAGR During Forecast Period
Figure 30 Point-To-Point Project Type to Hold Largest Share in VSC-Based Technology in HVDC Transmission Market During Forecast Period
Figure 31 HVDC Transmission Market: By Application
Figure 32 Bulk Power Transmission Applications to Hold Largest Share of HVDC Transmission Market During Forecast Period
Figure 33 Point-To-Point Projects for Infeed Urban Areas to Hold Largest Share of HVDC Transmissions Market During Forecast Period
Figure 34 HVDC Transmissions Market: By Geography
Figure 35 Geographic Snapshot: HVDC Transmissions Market
Figure 36 Americas: HVDC Transmissions Market Snapshot
Figure 37 Europe: HVDC Transmissions Market Snapshot
Figure 38 APAC: HVDC Transmissions Market Snapshot
Figure 39 Growth Strategies Adopted By Companies Over Past 4 Years (20152018)
Figure 40 Market Ranking for HVDC Transmissions Market, 2017
Figure 41 ABB: Company Snapshot
Figure 42 Siemens: Company Snapshot
Figure 43 General Electric: Company Snapshot
Figure 44 Hitachi: Company Snapshot
Figure 45 Mitsubishi Electric: Company Snapshot
Figure 46 Nexans: Company Snapshot
Figure 47 NKT A/S: Company Snapshot
Figure 48 Prysmian Group: Company Snapshot
The study involved 4 major activities for estimating the current size of the HVDC transmission market. Exhaustive secondary research was conducted to collect information on the market, including peer market and parent market. The findings, assumptions, and sizing were validated through discussions with industry experts across value chain through primary research. Both top-down and bottom-up approaches were employed to estimate the complete market size. Thereafter, market breakdown and data triangulation were performed to estimate the market size of segments and subsegments.
Secondary Research
In the secondary research process, various secondary sources have been referred to for identifying and collecting information important for this study. These secondary sources include National Electrical Manufacturers Association (NEMA), CIGRÉ (International Council on Large Electric Systems), Global Smart Grid Federation, American Wind Energy Association (AWEA), annual reports, press releases, and investor presentations of companies; white papers; and certified publications and articles from recognized authors, directories, and databases.
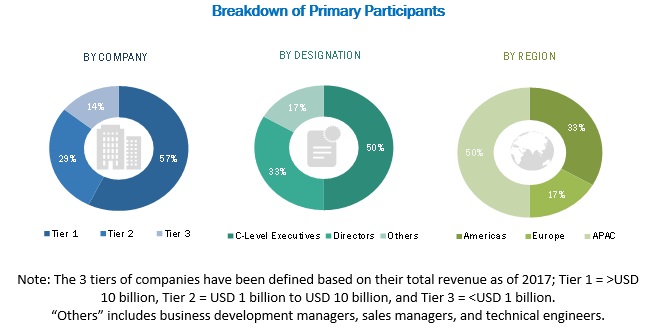
Primary Research
In the primary research process, various primary sources from both the supply and demand sides have been interviewed to obtain qualitative and quantitative information important for this report. The primary sources from the supply side include industry experts such as CEOs, VPs, marketing directors, technology and innovation directors, and related executives from key companies and organizations operating in the HVDC transmission market. After complete market engineering (including calculations regarding market statistics, breakdown, estimations, and forecasting as well as data triangulation), extensive primary research has been conducted to gather information as well as verify and validate the critical numbers arrived at.
To know about the assumptions considered for the study, download the pdf brochure
Market Size Estimation
In the complete market engineering process, both top-down and bottom-up approaches have been implemented, along with several data triangulation methods, to estimate and validate the size of the HVDC transmission market and other dependent submarkets listed in this report.
- The key players in the industry and markets have been identified through extensive secondary research
- The industrys supply chain and market size, in terms of value, have been determined through primary and secondary research processes
- All percentage shares, splits, and breakdowns have been determined using secondary sources and verified through primary sources
Data Triangulation
After arriving at the overall market size from the estimation process explained above, the overall market has been split into several segments and subsegments. To complete the overall market engineering process and arrive at the exact statistics for all segments and subsegments, the market breakdown and data triangulation procedures have been employed, wherever applicable. The data have been triangulated by studying various factors and trends identified from both demand and supply sides. Along with this, the market size has been validated using both top-down and bottom-up approaches.
The following are the major objectives of the study.
- To define, describe, and forecast the high voltage direct current (HVDC) transmission market based on component, technology, project type, application, and geography
- To forecast the sizes of market segments with respect to 4 regionsAmericas, Europe, Asia Pacific (APAC), and Rest of the World (RoW)
- To strategically analyze the micromarkets1 with respect to individual growth trends, prospects, and contribution to the overall HVDC transmission market
- To provide detailed information regarding the major factors (drivers, restraints, opportunities, and challenges) influencing the growth of the market
- To provide detailed analysis of the HVDC transmission markets value chain
- To analyze market opportunities for stakeholders and detail the competitive landscape of market leaders
- To strategically profile key players and comprehensively analyze their market ranking and core competencies2
- To analyze major growth strategies such as contracts, joint ventures, mergers and acquisitions, product launches and developments, and R&D implemented by HVDC transmission market players
Available Customizations:
Based on the given market data, MarketsandMarkets offers customizations in the reports as per the clients specific requirements. The available customization options are as follows:
Company Information
- Detailed analysis and profiling of additional market players on the basis of various blocks of the value chain


Growth opportunities and latent adjacency in HVDC Transmission Market
Can you provide information on projected and expected HVDC installations and their investors.
I am looking for information on planed tenders in area of HVDC installations and modernisations.
I want market numbers and projections in the HVDC transmission in China and Asia. Thanks!
We want to understand the potential and current HVDC projects in South America region, especially in Colombia and Peru.
Can you provide information on projected and expected HVDC installations and their investors.
I am conducting a research on HVDC and looking forward more technical information in terms of different technologies and components used in HVDC transmission.
Can I get information of major market drivers and challenges in the hvdc transmission? Thanks
I am looking for an information about existing HVDC installations all over the world and plans of their modernisations.
As a senior power system researcher, I am investigating prospective R&D research topics to enhance power system reliability in germany including HVDC system and FACTS devices.
we are trying to evaluate new market opportunities and the state-of-the-art technologies in the HVDC transmission in Europe. Can you provide this information?
Hello. I want to purchase "Single User License". "Single User" means just allowed on one laptop? And, is this product printable?