Immersion Cooling Market

Immersion Cooling Market by Type (Single-Phase and Two-Phase), Application (High-Performance Computing, Edge Computing, Cryptocurrency Mining), Cooling Fluid, Components (Solutions, Services), and Geography - Global Forecast to 2030

Report Code: CH 7299 Oct, 2022, by marketsandmarkets.com

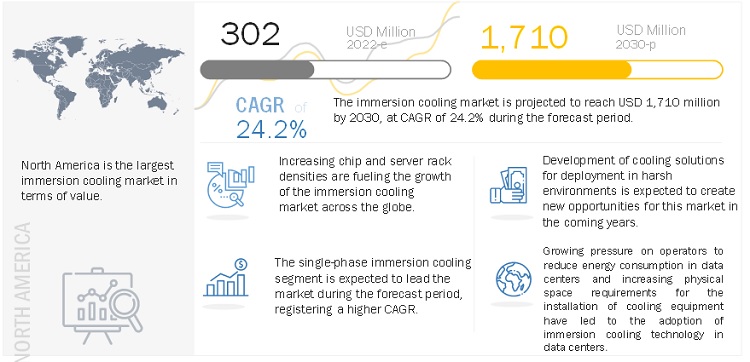
[241 Pages Report] The immersion cooling market is projected to grow from USD 244 million in 2021 to USD 1,710 million by 2030, at a CAGR of 24.2% from 2022 to 2030. The increased demand for immersion cooling solutions is propelled by the growing server density across the globe and high adoption in cryptocurrency mining and blockchain applications. Immersion cooling solutions not only provide high efficiency cooling but also have an advantage from operational expenditure perspective. The market is also expected to be driven by need for environmentally friendly data center cooling solutions.

Attractive Opportunities in the Immersion Cooling Market
IoT in Smart Cities Market

*e-estimated, p-projected

To know about the assumptions considered for the study, Request for Free Sample Report

Immersion Cooling Market Dynamics

Driver: Adoption in cryptocurrency mining & blockchain

Cryptocurrency is an electronic currency which is stored in a ledger system called blockchain. Blockchain can be considered as a database wherein encrypted blocks of digital assets such as cryptocrrency  data is stored and chained together. Thus, forming a single-source-of-truth for the data. Cryptocurrency mining is a algorithm solving process that verifies and adds new transactions to the blockchain for a cryptocurrency that uses the proof-of-work (PoW) method. The miner that wins the competition of solving the algorithm is rewarded with some amount of the currency and/or transaction fees. The algorithm that miners attempt to solve consumes a lot of electricity. For instance, according to Digiconomist, Bitcoin and Ethereum mining together consumed as much energy as Indonesia in 2021. With high electricity consumption, also arises the issue of heat generation. Immersion cooling solutions provides the optimal solution to the heat generation issue and there are practical worldwide use cases available.

Restraint: Air cooling remains dominant technology for data center cooling

Air cooling technology uses AHUs, fans, HVAC ducts, and air coolers for data center cooling. In this technology air is the primary medium of heat transfer and during requirement of high cooling the air flow to data servers and racks is increased. Air cooling technology has been ever present and it was easy to find new applications, such as data center cooling. Moreover, air cooling solutions are less complex, easy to install and require no additional knowledge to handle the working and maintenance. Air cooling uses components such as inverter-driven compressors, variable speed fans, and condensers. Companies such as Dell Technologies, Google, and Meta have air cooling technology for their data centers.

Opportunities: Development of data center cooling solutions for deployment in harsh conditions

Sometimes, data centers are built in harsh environments such as deserts, and regions where weather fluctuations and seismic events are regular occurrences. Traditional air cooling technology uses ambient temperature to cool the hardware. In harsh environments of deserts, it is difficult to maintain a low ambient temperature due to the outside temperature being high. In such cases cooled/ chilled water is used for maintaining the temperature of ambient air by means of a heat exchanger. However, in places of desert conditions and drought there is an issue of water scarcity. Such practical issues have been noted around the globe. On the other hand, immersion cooling systems require negligible amount of water compared to traditional air-cooling systems. As a result, vendors of immersion cooling solutions are developing customized solutions that can withstand harsh environments in industries such as military, oil & gas, shipping, and aeronautics. Developing immersion cooling solutions that can sustain in harsh environments is anticipated to provide new avenues for the growth of the immersion cooling market.

Challenge: High investment in existing infrastructure

Many organization still use traditional air cooling and direct plate cooling solutions. Data center owners are reluctant to replace this existing infrastructure and invest additional funds in upgrading to immersion cooling solutions. The existing infrastructure has a cost which becomes redundant. This becomes a challenge to immersion cooling solution provider for capturing more market share.

Cryptocurrency mining segment to dominate the market in 2021

Cryptocurrency is a digital currency and is currently being used for transactions across the globe. However, this currency needs to be mined by solving complex algorithms, for which CPUs and GPUs must be clubbed together to increase the computing power. This causes a surge in electricity consumption leading to development of tremendous amount of heat. The optimal temperature for machines/rigs at which cryptocurrencies can be mined ranges between 15-35 ?C. Immersion cooling solutions are capable of providing and maintaining the said temperature by use of advanced dielectric coolant fluids. Currently, there are numerous practical use cases of cryptocurrency mining organizations using immersion cooling solutions.

Fluorocarbon-based fluids segment to hold second largest share of the immersion cooling market in 2021

Fluorocarbon-based fluids are basically fluorinated carbon-chain polymers. These fluids are extremely inert, non-reactive and do not conduct electricity. As a result, apart from synthetic fluids, fluorocarbon-based fluids  are also witnessing increased demand. Currently, one of the largest producer of fluorocarbon-based fluids for the immersion cooling market is 3M. The company with its brand image and goodwill has been a strong advocate for adoption of these fluids. Fluorocarbon-based fluids are pre-dominantly used in two-phase immersion cooling systems.

Single-phase immersion cooling segment is expected to have the largest CAGR during the forecast period

Single-phase immersion cooling systems have a distinct advantage over two-phase immersion cooling systems in terms of lesser cost of maintenance and need for refilling of costly dielectric coolant fluids. In single-phase immersion cooling systems, there is no phase change of the dielectric coolant fluid. In this system, the boiling point of the dielectric coolant fluid is much higher than operating temperatures which allows the fluid to maintain its phase. Single-phase immersion cooling systems are also more efficient in terms of PUE effectiveness and the total cost of ownership.

Solutions component segment is expected to have the largest market share during the forecast period

The solutions segment comprises necessary equipment needed for the efficient functioning of an immersion cooling system. These equipment include immersion tank, heat exchangers, tubes, heat exchangers, and pumps. Currently, a majority companies opting for immersion cooling systems are more interested in getting customized solutions from current immersion cooling vendors. One of the primary causes is that current data centers are equipped with air cooling technology and hence a complete overhaul of cooling technology may be challenging and a costly affair.

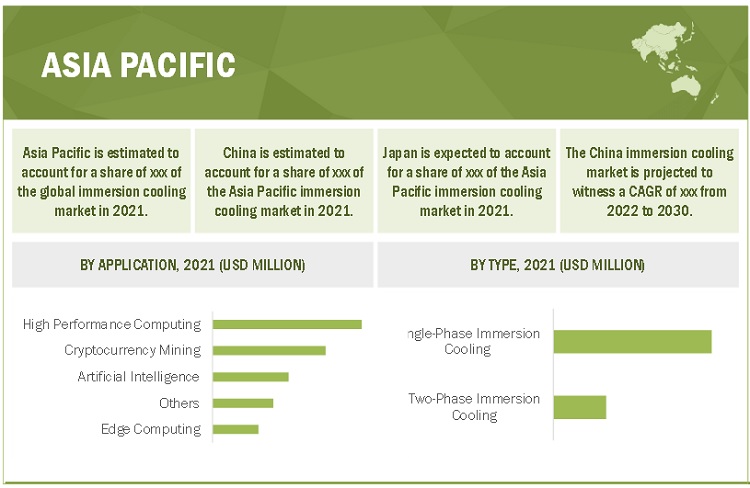
Asia Pacific is expected to be the fastest growing region during the forecast period

Data centers in the Asia Pacific region are undergoing significant changes in terms of increased server rack & chip densities, and power consumption. This region is also witnessing huge investments in the upgrade of existing data centers and the setting up of new data centers by companies such as Google, Microsoft, and Samsung and other companies such as Avent, Lenovo, and Dell Technologies. Many of the Asia Pacific countries are developing economies, and there is a large scope for investors to expand their business. Immersion cooling technologies are beneficial for hot climates as they do not emit any further heat.
IoT in Smart Cities Market by Region

To know about the assumptions considered for the study, download the pdf brochure

Market expected to mature in the coming years as technology evolves

The immersion cooling market is still under development phase and new companies are coming with their own patents and custom solutions. Earlier, companies offering immersion cooling solutions provided complete immersion of processors into specialized tanks. However, there have been developments in recent years wherein companies have started providing rack-based immersion cooling. Rack-based immersion solutions are more cost-effective and complete integration of the system is possible within a few hours. The immersion cooling market is expected to evolve further as technology matures and new concepts of immersion cooling come into picture. However, it is clear that immersion cooling systems are the only viable solution in terms of controlling heat dissipation and maintaining the appropriate PUE.

Today, the dominant companies operating in the immersion cooling market are Green Revolution Cooling Inc. (US), Submer (Spain), Asperitas (Netherlands), Midas Green Technologies (US), and LiquidStack (Netherlands).

Get online access to the report on the World's First Market Intelligence Cloud

  • Easy to Download Historical Data & Forecast Numbers
  • Company Analysis Dashboard for high growth potential opportunities
  • Research Analyst Access for customization & queries
  • Competitor Analysis with Interactive dashboard
  • Latest News, Updates & Trend analysis
Request Sample

Scope of the Report

Report Metric

Details

Market Size Available for Years

2017–2030

Base Year Considered

2021

Forecast Period

2022–2030

Forecast Units

Value (USD Million)

Segments Covered

Application, Type, Cooling Fluid, Components and Region

Geographies Covered

North America, Asia Pacific, Europe, the Middle East & Africa, and South America

Companies Covered

LiquidStack (Netherlands), Fujitsu (Japan), Green Revolution Cooling Inc (US), Submer (Spain), Asperitas (Netherlands), Midas Green Technologies (US), Iceotope Technologies Ltd (US), LiquidCool Solutions (US), DUG Technology (Australia), DCX - The Liquid Cooling Company (Poland), ExaScaler Inc (Japan), SixtyOneC Technology Corporation (Canada), Engineered Fluids (US), TEIMMERS (Netherlands), TMGcore, Inc. (US), GIGA-BYTE Technology Co., Ltd. (Taiwan), Wiwynn (Taiwan), Hypertec (Canada), TAS (US), and Delta Power Solutions (Taiwan)

This research report categorizes the immersion cooling market based on application, type, cooling fluid, and region and forecasts revenues as well as analyzes trends in each of these submarkets.

Based on application, the immersion cooling market has been segmented into:
  • High-performance Computing
  • Artificial Intelligence
  • Edge Computing
  • Cryptocurrency Mining
  • Others (Cloud Computing, Enterprise Computing)
Based on type, the immersion cooling market has been segmented into:
  • Single-Phase Immersion Cooling
  • Two-Phase Immersion Cooling
  • Based on the cooling fluid, the immersion cooling market has been segmented into:
  • Mineral Oil
  • Synthetic Fluids
  • Fluorocarbon-based Fluids
  • Other (Vegetable Oil, Bio-Oil, Silicone Oil, Deionized Water)
Based on the components, the immersion cooling market has been segmented into:
  • Solutions
  • Services
Based on the region, the immersion cooling market has been segmented into:
  • Asia Pacific
  • North America
  • Europe
  • Middle East & Africa
  • South America

Recent Developments

  • In June 2021, Submer announced its latest partnership with ASA Computers, a leading IT solution provider that has been delivering innovative systems to rack solutions across the globe for over 30 years. The agreement was forged out of a need to provide an alternative solution for the data center industry in decreasing energy usage and costs, increasing compute density, capacity (Power, Cooling, Space), reducing operating and capital expenses, and more.
  • In June 2021, Schneider Electric and Iceotope Technologies Limited together have announced the launch of a liquid-cooled, EcoStruxure Modular Data Center, All-In-One Module. Integrated by Avnet and containing chassis-level precision immersion cooling from Iceotope, the new prefabricated module will allow the most CPU- and GPU-intensive high-performance computing (HPC) edge applications to be deployed with greater reliability in harsh and remote environments.
  • In March 2021, LiquidStack, announced its launch with new deployments across vital sectors such as high-performance computing (HPC), cloud services, artificial intelligence (AI), and edge and telecommunications, backed by its first round of funding and a strong, experienced leadership team, with USD 10 million Series “A” investment and strategic partnership with Wiwynn, an innovative cloud IT infrastructure provider of server and storage system design, manufacturing, and rack integration for data centers.

Frequently Asked Questions (FAQ):

To speak to our analyst for a discussion on the above findings, click Speak to Analyst


TABLE OF CONTENTS
 
1 INTRODUCTION (Page No. - 30)
    1.1 STUDY OBJECTIVES 
    1.2 MARKET DEFINITION 
    1.3 INCLUSIONS AND EXCLUSIONS 
          TABLE 1 IMMERSION COOLING MARKET, BY TYPE: INCLUSIONS AND EXCLUSIONS
          TABLE 2 IMMERSION COOLING MARKET, BY COOLING FLUID: INCLUSIONS AND EXCLUSIONS
          TABLE 3 IMMERSION COOLING MARKET, BY COMPONENT: INCLUSIONS AND EXCLUSIONS
          TABLE 4 IMMERSION COOLING MARKET, BY APPLICATION: INCLUSIONS AND EXCLUSIONS
          TABLE 5 IMMERSION COOLING MARKET, BY REGION: INCLUSIONS AND EXCLUSIONS
    1.4 MARKET SCOPE 
           1.4.1 IMMERSION COOLING MARKET SEGMENTATION
           1.4.2 REGIONS COVERED
           1.4.3 YEARS CONSIDERED
    1.5 CURRENCY 
    1.6 STAKEHOLDERS 
    1.7 SUMMARY OF CHANGES 
 
2 RESEARCH METHODOLOGY (Page No. - 36)
    2.1 RESEARCH DATA 
          FIGURE 1 IMMERSION COOLING MARKET: RESEARCH DESIGN
           2.1.1 SECONDARY DATA
                    2.1.1.1 Key data from secondary sources
           2.1.2 PRIMARY DATA
                    2.1.2.1 Key data from primary sources
                    2.1.2.2 Key industry insights
                    2.1.2.3 Breakdown of primary interviews
                    2.1.2.4 Primary participants
    2.2 MARKET SIZE ESTIMATION 
           2.2.1 BOTTOM-UP APPROACH
                    FIGURE 2 MARKET SIZE ESTIMATION: BOTTOM-UP APPROACH
           2.2.2 TOP-DOWN APPROACH
                    FIGURE 3 MARKET SIZE ESTIMATION: TOP-DOWN APPROACH
    2.3 CALCULATION OF BASE MARKET SIZE 
           2.3.1 SUPPLY-SIDE APPROACH
                    FIGURE 4 MARKET SIZE ESTIMATION METHODOLOGY: APPROACH 1 (SUPPLY SIDE)
           2.3.2 DEMAND-SIDE APPROACH
                    FIGURE 5 MARKET SIZE ESTIMATION METHODOLOGY: APPROACH 2—BOTTOM-UP (DEMAND SIDE)
    2.4 DATA TRIANGULATION 
          FIGURE 6 IMMERSION COOLING MARKET: DATA TRIANGULATION
    2.5 GROWTH RATE ASSUMPTIONS/GROWTH FORECAST 
          TABLE 6 FACTOR ANALYSIS
    2.6 ASSUMPTIONS 
    2.7 RISK ASSESSMENT 
          TABLE 7 LIMITATIONS AND ASSOCIATED RISKS
 
3 EXECUTIVE SUMMARY (Page No. - 46)
    TABLE 8 IMMERSION COOLING MARKET SNAPSHOT, 2022 & 2030
    FIGURE 7 CRYPTOCURRENCY MINING SEGMENT ACCOUNTED FOR LARGEST SHARE OF IMMERSION COOLING MARKET IN 2021
    FIGURE 8 SYNTHETIC FLUIDS SEGMENT ACCOUNTED FOR LARGEST SHARE OF IMMERSION COOLING MARKET IN 2021
    FIGURE 9 SINGLE-PHASE IMMERSION COOLING SEGMENT LED IMMERSION COOLING MARKET IN 2021
    FIGURE 10 SOLUTIONS SEGMENT LED IMMERSION COOLING MARKET IN 2021
    FIGURE 11 NORTH AMERICA ACCOUNTED FOR LARGEST SHARE OF IMMERSION COOLING MARKET
 
4 PREMIUM INSIGHTS (Page No. - 51)
    4.1 ATTRACTIVE OPPORTUNITIES FOR PLAYERS IN IMMERSION COOLING MARKET 
          FIGURE 12 ADOPTION IN CRYPTOCURRENCY MINING AND GROWING SERVER DENSITY DRIVING GROWTH
    4.2 IMMERSION COOLING MARKET, BY REGION 
          FIGURE 13 ASIA PACIFIC IMMERSION COOLING MARKET PROJECTED TO WITNESS HIGHEST CAGR FROM 2022 TO 2030
    4.3 NORTH AMERICA IMMERSION COOLING MARKET, BY APPLICATION AND COUNTRY 
          FIGURE 14 CRYPTOCURRENCY MINING ACCOUNTED FOR LARGEST SHARE OF NORTH AMERICA IMMERSION COOLING MARKET
    4.4 IMMERSION COOLING MARKET, BY MAJOR COUNTRIES 
          FIGURE 15 IMMERSION COOLING MARKET IN CHINA PROJECTED TO WITNESS HIGHEST CAGR FROM 2022 TO 2030
 
5 MARKET OVERVIEW (Page No. - 54)
    5.1 INTRODUCTION 
          FIGURE 16 IMMERSION COOLING MARKET: DRIVERS, RESTRAINTS, OPPORTUNITIES, AND CHALLENGES
           5.1.1 DRIVERS
                    5.1.1.1 Adoption in cryptocurrency mining & blockchain
                                FIGURE 17 FUNDS RAISED BY CRYPTOCURRENCY DATA AND INFRASTRUCTURE STARTUPS, 2014–2019
                    5.1.1.2 Growing density of servers
                                FIGURE 18 AVERAGE SERVER RACK DENSITY, 2016–2020
                    5.1.1.3 Growing need for eco-friendly data center cooling solutions
                                TABLE 9 CARBON FOOTPRINT OF AIR-COOLING VERSUS IMMERSION-COOLING FOR DATA CENTERS
                    5.1.1.4 Rising need for cost-effective cooling solutions
                                TABLE 10 AIR-COOLING VERSUS IMMERSION-COOLING FOR DATA CENTERS
                    5.1.1.5 Increasing demand for compact and noise-free solutions
                                TABLE 11 COMPARATIVE NOISE LEVEL
           5.1.2 RESTRAINTS
                    5.1.2.1 Susceptibility to leakage
                    5.1.2.2 Air cooling remains dominant cooling technology
           5.1.3 OPPORTUNITIES
                    5.1.3.1 Adoption in low-density data centers
                    5.1.3.2 Emergence of AI, high-performance electronics, telecom, and other technologies
                    5.1.3.3 Development of cooling solutions for deployment in harsh environments
                                TABLE 12 WATER CONSUMPTION IN AIR-COOLING VERSUS IMMERSION-COOLING FOR DATA CENTERS
                    5.1.3.4 High-density cooling requirements
           5.1.4 CHALLENGES
                    5.1.4.1 High investments in existing infrastructure
                    5.1.4.2 Retrofitting immersion cooling solutions in large and medium-scale data centers
    5.2 PORTER'S FIVE FORCES ANALYSIS 
          FIGURE 19 IMMERSION COOLING MARKET: PORTER’S FIVE FORCES ANALYSIS
          TABLE 13 IMMERSION COOLING MARKET: PORTER'S FIVE FORCES ANALYSIS
           5.2.1 BARGAINING POWER OF SUPPLIERS
           5.2.2 BARGAINING POWER OF BUYERS
           5.2.3 THREAT OF SUBSTITUTES
           5.2.4 THREAT OF NEW ENTRANTS
           5.2.5 INTENSITY OF COMPETITIVE RIVALRY
    5.3 KEY STAKEHOLDERS & BUYING CRITERIA 
           5.3.1 KEY STAKEHOLDERS IN BUYING PROCESS
                    FIGURE 20 INFLUENCE OF STAKEHOLDERS IN BUYING PROCESS FOR TOP THREE APPLICATIONS
                    5.3.1.1 Buying criteria for cryptocurrency mining
           5.3.2 BUYING CRITERIA
                    TABLE 14 KEY BUYING CRITERIA
                    FIGURE 21 KEY BUYING CRITERIA FOR TOP 3 APPLICATIONS
 
6 INDUSTRY TRENDS (Page No. - 68)
    6.1 EVOLUTION OF IMMERSION COOLING 
          FIGURE 22 EVOLUTION OF DATA CENTER COOLING AND IMMERSION COOLING
    6.2 IMMERSION COOLING MARKET: ECOSYSTEM 
          FIGURE 23 ECOSYSTEM/MARKET MAPPING: IMMERSION COOLING
          TABLE 15 IMMERSION COOLING MARKET: ECOSYSTEM
    6.3 PATENTS ANALYSIS 
           6.3.1 INTRODUCTION
           6.3.2 METHODOLOGY
           6.3.3 DOCUMENT TYPE
                    FIGURE 24 NUMBER OF GRANTED PATENTS, PATENT APPLICATIONS, AND LIMITED PATENTS
                    FIGURE 25 PUBLICATION TRENDS (2011–2022)
           6.3.4 INSIGHTS
                    FIGURE 26 TOP JURISDICTIONS FOR IMMERSION COOLING SOLUTIONS
                    FIGURE 27 COMPANIES/APPLICANTS WITH HIGHEST NUMBER OF PATENTS
                    TABLE 16 LIST OF PATENTS PERTAINING TO IMMERSION COOLING MARKET, 2017–2021
                    TABLE 17 TOP 10 PATENT OWNERS IN LAST 10 YEARS
    6.4 TRENDS AND DISRUPTIONS IMPACTING CUSTOMERS’ BUSINESSES 
          FIGURE 28 REVENUE SHIFT FOR IMMERSION COOLING SOLUTIONS IN DATA CENTER APPLICATIONS
    6.5 REGULATORY LANDSCAPE 
           6.5.1 OPEN COMPUTE PROJECT (OCP) - QUALITY & SAFETY REQUIREMENTS FOR IMMERSION COOLING TECHNOLOGY
           6.5.2 OPEN COMPUTE PROJECT (OCP) - DIELECTRIC COOLING FLUID REQUIREMENTS FOR DATA CENTER APPLICATIONS
                    TABLE 18 DIELECTRIC COOLING FLUID SPECIFICATIONS
                    TABLE 19 DIELECTRIC COOLING FLUID MINIMUM REQUIREMENTS
                    TABLE 20 HYDROCARBON FLUIDS QUALITY MANAGEMENT TABLE
                    TABLE 21 FLUOROCARBON FLUIDS QUALITY MANAGEMENT TABLE
           6.5.3 IMMERSION COOLING TECHNOLOGY - COUNTRY/REGIONAL REGULATIONS
                    6.5.3.1 US
                    6.5.3.2 Europe
                    6.5.3.3 China
                    6.5.3.4 Japan
                    6.5.3.5 India
                                TABLE 22 APPROACHES IN INDIAN CONTEXT
    6.6 REGULATORY BODIES, GOVERNMENT AGENCIES, AND OTHER ORGANIZATIONS 
           6.6.1 INTRODUCTION
                    6.6.1.1 American National Standards Institute
                    6.6.1.2 American Society of Heating, Refrigerating, and Air-Conditioning Engineers
                    6.6.1.3 Institute for Energy and Transport of Joint Research Center of European Commission
                    6.6.1.4 Distributed Management Task Force
                    6.6.1.5 Telecommunication Industry Association
                    6.6.1.6 National Electrical Manufacturers Association
                    6.6.1.7 Canadian Standards Association Group
                    6.6.1.8 Underwriters Laboratory
                    6.6.1.9 United States Department of Energy
                    6.6.1.10 US Environmental Protection Agency
                    6.6.1.11 Statement on Standards for Attestation Engagements No. 16
                    6.6.1.12 International Standards Compliance
    6.7 KEY CONFERENCES & EVENTS - 2022 & 2023 
          TABLE 23 IMMERSION COOLING MARKET: CONFERENCES & EVENTS (2022 & 2023)
    6.8 CASE STUDY ANALYSIS 
           6.8.1 ASPERITAS AND ITRENEW PARTNER TO BRING SUSTAINABLE, PLUG-AND-PLAY DATA CENTER SOLUTION FULL CIRCLE
           6.8.2 DUG REDUCED ENERGY SPENDING IN DATA CENTER BY ADOPTING GRC'S IMMERSION COOLING TECHNOLOGY
           6.8.3 MICROSOFT CHOSE IMMERSION COOLING TECHNOLOGY BY LIQUIDSTACK FOR ITS CLOUD SERVERS
           6.8.4 BITFURY GROUP ENHANCES DATA CENTER COOLING EFFICIENCY USING 3M'S ENGINEERED FLUIDS
           6.8.5 MACQUARIE TELECOM GROUP TO DEPLOY SUBMER'S IMMERSION COOLING SOLUTIONS AT ITS DATA CENTERS
           6.8.6 NTT DATA CORPORATION TO ADOPT LIQUIDSTACK'S TWO-PHASE IMMERSION COOLING SOLUTIONS AT ITS DATA CENTERS
    6.9 TECHNOLOGY ANALYSIS 
           6.9.1 OVERVIEW
                    FIGURE 29 TYPES OF IMMERSION COOLING SOLUTIONS
           6.9.2 SINGLE-PHASE
                    6.9.2.1 IT chassis
                    6.9.2.2 Tub/Open bath
           6.9.3 TWO-PHASE
                    6.9.3.1 Tub/open bath
           6.9.4 HYBRID
    6.10 VALUE CHAIN ANALYSIS 
           FIGURE 30 IMMERSION COOLING MARKET: VALUE CHAIN ANALYSIS
    6.11 ADVANTAGES OF IMMERSION COOLING 
           6.11.1 LOW COST
                     TABLE 24 COMPARISON OF DIFFERENT COOLING TECHNIQUES
           6.11.2 LESS INFRASTRUCTURE
           6.11.3 EASY INSTALLATION AND MAINTENANCE
           6.11.4 ENVIRONMENTALLY FRIENDLY
    6.12 MARKETING CHANNELS USED BY IMMERSION COOLING SOLUTION PROVIDERS: COMPARATIVE ANALYSIS 
           6.12.1 B2B MARKETING CHANNELS - COMPARATIVE ANALYSIS
                     TABLE 25 DETAILS OF DIFFERENT DISTRIBUTION CHANNELS
    6.13 PARTNERS OF IMMERSION COOLING COMPANIES 
           6.13.1 PARTNERSHIPS
                     TABLE 26 LIST OF PARTNER COMPANIES OF MAJOR IMMERSION COOLING SOLUTION PROVIDERS
    6.14 TOTAL COST OF OWNERSHIP 
           TABLE 27 AVERAGE PRICING, COOLING FLUID (USD/LITER)
 
7 IMMERSION COOLING MARKET, BY APPLICATION (Page No. - 99)
    7.1 INTRODUCTION 
          FIGURE 31 IMMERSION COOLING MARKET, BY APPLICATION, 2022 & 2030 (USD MILLION)
          TABLE 28 IMMERSION COOLING MARKET SIZE, BY APPLICATION, 2017–2021 (USD MILLION)
          TABLE 29 IMMERSION COOLING MARKET SIZE, BY APPLICATION, 2022–2030 (USD MILLION)
    7.2 HIGH-PERFORMANCE COMPUTING 
           7.2.1 NEED FOR HIGH-EFFICIENCY COOLING TO DRIVE MARKET
                    TABLE 30 IMMERSION COOLING MARKET SIZE IN HIGH-PERFORMANCE COMPUTING, BY REGION, 2017–2021 (USD MILLION)
                    TABLE 31 IMMERSION COOLING MARKET SIZE IN HIGH-PERFORMANCE COMPUTING, BY REGION, 2022–2030 (USD MILLION)
    7.3 EDGE COMPUTING 
           7.3.1 EDGE COMPUTING GAINING TRACTION IN OIL & GAS, DEFENSE, AND TELECOM INDUSTRIES
                    TABLE 32 IMMERSION COOLING MARKET SIZE IN EDGE COMPUTING, BY REGION, 2017–2021 (USD MILLION)
                    TABLE 33 IMMERSION COOLING MARKET SIZE IN EDGE COMPUTING, BY REGION, 2022–2030 (USD MILLION)
    7.4 ARTIFICIAL INTELLIGENCE 
           7.4.1 DIGITAL TRANSFORMATION OF COMPANIES EXPECTED TO DRIVE AI APPLICATION SEGMENT
                    TABLE 34 IMMERSION COOLING MARKET SIZE IN ARTIFICIAL INTELLIGENCE, BY REGION, 2017–2021 (USD MILLION)
                    TABLE 35 IMMERSION COOLING MARKET SIZE IN ARTIFICIAL INTELLIGENCE, BY REGION, 2022–2030 (USD MILLION)
    7.5 CRYPTOCURRENCY MINING 
           7.5.1 IMMERSION COOLING MARKET TO WITNESS HIGHEST GROWTH IN CRYPTOCURRENCY MINING APPLICATION
                    TABLE 36 IMMERSION COOLING MARKET SIZE IN CRYPTOCURRENCY MINING, BY REGION, 2017–2021 (USD MILLION)
                    TABLE 37 IMMERSION COOLING MARKET SIZE IN CRYPTOCURRENCY MINING, BY REGION, 2022–2030 (USD MILLION)
    7.6 OTHERS 
          TABLE 38 IMMERSION COOLING MARKET SIZE IN OTHER APPLICATIONS, BY REGION, 2017–2021 (USD MILLION)
          TABLE 39 IMMERSION COOLING MARKET SIZE IN OTHER APPLICATIONS, BY REGION, 2022–2030 (USD MILLION)
 
8 IMMERSION COOLING MARKET, BY TYPE (Page No. - 108)
    8.1 INTRODUCTION 
          FIGURE 32 IMMERSION COOLING MARKET, BY TYPE, 2022 & 2030 (USD MILLION)
          TABLE 40 IMMERSION COOLING MARKET SIZE, BY TYPE, 2017–2021 (USD MILLION)
          TABLE 41 IMMERSION COOLING MARKET SIZE, BY TYPE, 2022–2030 (USD MILLION)
    8.2 SINGLE-PHASE IMMERSION COOLING 
           8.2.1 OFFERS EFFICIENT COOLING AND LOW MAINTENANCE
                    TABLE 42 SINGLE-PHASE IMMERSION COOLING MARKET SIZE, BY REGION, 2017–2021 (USD MILLION)
                    TABLE 43 SINGLE-PHASE IMMERSION COOLING MARKET SIZE, BY REGION, 2022–2030 (USD MILLION)
    8.3 TWO-PHASE IMMERSION COOLING 
           8.3.1 FLUID LOSS REMAINS PRIMARY CONCERN IN TWO-PHASE IMMERSION COOLING SYSTEMS
                    TABLE 44 TWO-PHASE IMMERSION COOLING MARKET SIZE, BY REGION, 2017–2021 (USD MILLION)
                    TABLE 45 TWO-PHASE IMMERSION COOLING MARKET SIZE, BY REGION, 2022–2030 (USD MILLION)
 
9 IMMERSION COOLING MARKET, BY COMPONENT (Page No. - 113)
    9.1 INTRODUCTION 
          FIGURE 33 IMMERSION COOLING MARKET, BY COMPONENT, 2022 & 2030 (USD MILLION)
          TABLE 46 IMMERSION COOLING MARKET SIZE, BY COMPONENT, 2017–2021 (USD MILLION)
          TABLE 47 IMMERSION COOLING MARKET SIZE, BY COMPONENT, 2022–2030 (USD MILLION)
    9.2 SOLUTIONS 
           9.2.1 GROWING DEMAND FOR HIGH-DENSITY SERVER COOLING EXPECTED TO DRIVE MARKET
                    TABLE 48 SOLUTIONS: IMMERSION COOLING MARKET SIZE, BY REGION, 2017–2021 (USD MILLION)
                    TABLE 49 SOLUTIONS: IMMERSION COOLING MARKET SIZE, BY REGION, 2022–2030 (USD MILLION)
    9.3 SERVICES 
           9.3.1 ASIA PACIFIC TO WITNESS HIGHEST GROWTH IN SERVICES SEGMENT
                    TABLE 50 SERVICES: IMMERSION COOLING MARKET SIZE, BY REGION, 2017–2021 (USD MILLION)
                    TABLE 51 SERVICES: IMMERSION COOLING MARKET SIZE, BY REGION, 2022–2030 (USD MILLION)
 
10 IMMERSION COOLING MARKET, BY COOLING FLUID (Page No. - 117)
     10.1 INTRODUCTION 
             FIGURE 34 IMMERSION COOLING MARKET, BY COOLING FLUID, 2022 & 2030 (USD MILLION)
             TABLE 52 IMMERSION COOLING MARKET SIZE, BY COOLING FLUID, 2017–2021 (USD MILLION)
             TABLE 53 IMMERSION COOLING MARKET SIZE, BY COOLING FLUID, 2022–2030 (USD MILLION)
     10.2 MINERAL OIL 
             10.2.1 LIMITED USAGE RESTRICTS MARKET GROWTH
                        TABLE 54 MINERAL OIL: IMMERSION COOLING MARKET SIZE, BY REGION, 2017–2021 (USD MILLION)
                        TABLE 55 MINERAL OIL: IMMERSION COOLING MARKET SIZE, BY REGION, 2022–2030 (USD MILLION)
     10.3 FLUOROCARBON-BASED FLUIDS 
             10.3.1 FLUOROCARBON-BASED FLUIDS INCREASINGLY USED IN HIGH-PERFORMANCE LIQUID COOLING APPLICATIONS
                        TABLE 56 FLUOROCARBON-BASED FLUIDS: IMMERSION COOLING MARKET SIZE, BY REGION, 2017–2021 (USD MILLION)
                        TABLE 57 FLUOROCARBON-BASED FLUIDS: IMMERSION COOLING MARKET SIZE, BY REGION, 2022–2030 (USD MILLION)
     10.4 SYNTHETIC FLUIDS 
             10.4.1 LOW CORROSION & LOW FLAMMABILITY FUELING DEMAND
                        TABLE 58 SYNTHETIC FLUIDS: IMMERSION COOLING MARKET SIZE, BY REGION, 2017–2021 (USD MILLION)
                        TABLE 59 SYNTHETIC FLUIDS: IMMERSION COOLING MARKET SIZE, BY REGION, 2022–2030 (USD MILLION)
     10.5 OTHERS 
             TABLE 60 OTHER FLUIDS: IMMERSION COOLING MARKET SIZE, BY REGION, 2017–2021 (USD MILLION)
             TABLE 61 OTHER FLUIDS: IMMERSION COOLING MARKET SIZE, BY REGION, 2022–2030 (USD MILLION)
 
11 IMMERSION COOLING MARKET, BY REGION (Page No. - 124)
     11.1 INTRODUCTION 
             FIGURE 35 IMMERSION COOLING MARKET IN CHINA PROJECTED TO WITNESS HIGHEST CAGR FROM 2022 TO 2030
             TABLE 62 IMMERSION COOLING MARKET SIZE, BY REGION, 2017–2021 (USD MILLION)
             TABLE 63 IMMERSION COOLING MARKET SIZE, BY REGION, 2022–2030 (USD MILLION)
     11.2 ASIA PACIFIC 
             FIGURE 36 ASIA PACIFIC: IMMERSION COOLING MARKET SNAPSHOT
             TABLE 64 ASIA PACIFIC: IMMERSION COOLING MARKET SIZE, BY COUNTRY, 2017–2021 (USD MILLION)
             TABLE 65 ASIA PACIFIC: IMMERSION COOLING MARKET SIZE, BY COUNTRY, 2022–2030 (USD MILLION)
             TABLE 66 ASIA PACIFIC: IMMERSION COOLING MARKET SIZE, BY APPLICATION, 2017–2021 (USD MILLION)
             TABLE 67 ASIA PACIFIC: IMMERSION COOLING MARKET SIZE, BY APPLICATION, 2022–2030 (USD MILLION)
             TABLE 68 ASIA PACIFIC: IMMERSION COOLING MARKET SIZE, BY TYPE, 2017–2021 (USD MILLION)
             TABLE 69 ASIA PACIFIC: IMMERSION COOLING MARKET SIZE, BY TYPE, 2022–2030 (USD MILLION)
             TABLE 70 ASIA PACIFIC: IMMERSION COOLING MARKET SIZE, BY COOLING FLUID, 2017–2021 (USD MILLION)
             TABLE 71 ASIA PACIFIC: IMMERSION COOLING MARKET SIZE, BY COOLING FLUID, 2022–2030 (USD MILLION)
             TABLE 72 ASIA PACIFIC: IMMERSION COOLING MARKET SIZE, BY COMPONENT, 2017–2021 (USD MILLION)
             TABLE 73 ASIA PACIFIC: IMMERSION COOLING MARKET SIZE, BY COMPONENT, 2022–2030 (USD MILLION)
             11.2.1 CHINA
                        11.2.1.1 Growing number of data centers to drive demand in China
                                      TABLE 74 CHINA: IMMERSION COOLING MARKET SIZE, BY APPLICATION, 2017–2021 (USD MILLION)
                                      TABLE 75 CHINA: IMMERSION COOLING MARKET SIZE, BY APPLICATION, 2022–2030 (USD MILLION)
             11.2.2 INDIA
                        11.2.2.1 Surging demand from data centers to drive market for immersion cooling
                                      TABLE 76 INDIA: IMMERSION COOLING MARKET SIZE, BY APPLICATION, 2017–2021 (USD MILLION)
                                      TABLE 77 INDIA: IMMERSION COOLING MARKET SIZE, BY APPLICATION, 2022–2030 (USD MILLION)
             11.2.3 JAPAN
                        11.2.3.1 Redesigning of existing data center facilities to drive market
                                      TABLE 78 JAPAN: IMMERSION COOLING MARKET SIZE, BY APPLICATION, 2017–2021 (USD MILLION)
                                      TABLE 79 JAPAN: IMMERSION COOLING MARKET SIZE, BY APPLICATION, 2022–2030 (USD MILLION)
             11.2.4 SOUTH KOREA
                        11.2.4.1 Advancements in AI, cryptocurrency mining, and cloud computing expected to drive immersion cooling market
                                      TABLE 80 SOUTH KOREA: IMMERSION COOLING MARKET SIZE, BY APPLICATION, 2017–2021 (USD MILLION)
                                      TABLE 81 SOUTH KOREA: IMMERSION COOLING MARKET SIZE, BY APPLICATION, 2022–2030 (USD MILLION)
             11.2.5 THAILAND
                        11.2.5.1 Expansion of digital hardware infrastructure to offer opportunities in immersion cooling market
                                      TABLE 82 THAILAND: IMMERSION COOLING MARKET SIZE, BY APPLICATION, 2017–2021 (USD MILLION)
                                      TABLE 83 THAILAND: IMMERSION COOLING MARKET SIZE, BY APPLICATION, 2022–2030 (USD MILLION)
             11.2.6 MALAYSIA
                        11.2.6.1 Cloud services expected to drive market in Malaysia
                                      TABLE 84 MALAYSIA: IMMERSION COOLING MARKET SIZE, BY APPLICATION, 2017–2021 (USD MILLION)
                                      TABLE 85 MALAYSIA: IMMERSION COOLING MARKET SIZE, BY APPLICATION, 2022–2030 (USD MILLION)
             11.2.7 REST OF ASIA PACIFIC
                        TABLE 86 REST OF ASIA PACIFIC: IMMERSION COOLING MARKET SIZE, BY APPLICATION, 2017–2021 (USD MILLION)
                        TABLE 87 REST OF ASIA PACIFIC: IMMERSION COOLING MARKET SIZE, BY APPLICATION, 2022–2030 (USD MILLION)
     11.3 EUROPE 
             FIGURE 37 EUROPE: IMMERSION COOLING MARKET SNAPSHOT
             TABLE 88 EUROPE: IMMERSION COOLING MARKET SIZE, BY COUNTRY, 2017–2021 (USD MILLION)
             TABLE 89 EUROPE: IMMERSION COOLING MARKET SIZE, BY COUNTRY, 2022–2030 (USD MILLION)
             TABLE 90 EUROPE: IMMERSION COOLING MARKET SIZE, BY APPLICATION, 2017–2021 (USD MILLION)
             TABLE 91 EUROPE: IMMERSION COOLING MARKET SIZE, BY APPLICATION, 2022–2030 (USD MILLION)
             TABLE 92 EUROPE: IMMERSION COOLING MARKET SIZE, BY TYPE, 2017–2021 (USD MILLION)
             TABLE 93 EUROPE: IMMERSION COOLING MARKET SIZE, BY TYPE, 2022–2030 (USD MILLION)
             TABLE 94 EUROPE: IMMERSION COOLING MARKET SIZE, BY COOLING FLUID, 2017–2021 (USD MILLION)
             TABLE 95 EUROPE: IMMERSION COOLING MARKET SIZE, BY COOLING FLUID, 2022–2030 (USD MILLION)
             TABLE 96 EUROPE: IMMERSION COOLING MARKET SIZE, BY COMPONENT, 2017–2021 (USD MILLION)
             TABLE 97 EUROPE: IMMERSION COOLING MARKET SIZE, BY COMPONENT, 2022–2030 (USD MILLION)
             11.3.1 GERMANY
                        11.3.1.1 Attractive investment climate to drive immersion cooling market
                                      TABLE 98 GERMANY: IMMERSION COOLING MARKET SIZE, BY APPLICATION, 2017–2021 (USD MILLION)
                                      TABLE 99 GERMANY: IMMERSION COOLING MARKET SIZE, BY APPLICATION, 2022–2030 (USD MILLION)
             11.3.2 FRANCE
                        11.3.2.1 Country witnessing growing demand for immersion cooling from cloud providers
                                      TABLE 100 FRANCE: IMMERSION COOLING MARKET, SIZE BY APPLICATION, 2017–2021 (USD MILLION)
                                      TABLE 101 FRANCE: IMMERSION COOLING MARKET SIZE, BY APPLICATION, 2022–2030 (USD MILLION)
             11.3.3 NETHERLANDS
                        11.3.3.1 Companies using green energy for data centers to fuel adoption of immersion cooling
                                      TABLE 102 NETHERLANDS: IMMERSION COOLING MARKET SIZE, BY APPLICATION, 2017–2021 (USD MILLION)
                                      TABLE 103 NETHERLANDS: IMMERSION COOLING MARKET SIZE, BY APPLICATION, 2022–2030 (USD MILLION)
             11.3.4 UK
                        11.3.4.1 New requirements set by European parliament for servers and data centers to drive market
                                      TABLE 104 UK: IMMERSION COOLING MARKET SIZE, BY APPLICATION, 2017–2021 (USD MILLION)
                                      TABLE 105 UK: IMMERSION COOLING MARKET SIZE, BY APPLICATION, 2022–2030 (USD MILLION)
             11.3.5 RUSSIA
                        11.3.5.1 Growing demand for computing resources and data storage systems to drive market
                                      TABLE 106 RUSSIA: IMMERSION COOLING MARKET SIZE, BY APPLICATION, 2017–2021 (USD MILLION)
                                      TABLE 107 RUSSIA: IMMERSION COOLING MARKET SIZE, BY APPLICATION, 2022–2030 (USD MILLION)
             11.3.6 SPAIN
                        11.3.6.1 Growth in cloud computing to drive immersion cooling market
                                      TABLE 108 SPAIN: IMMERSION COOLING MARKET SIZE, BY APPLICATION, 2017–2021 (USD MILLION)
                                      TABLE 109 SPAIN: IMMERSION COOLING MARKET SIZE, BY APPLICATION, 2022–2030 (USD MILLION)
             11.3.7 REST OF EUROPE
                        TABLE 110 REST OF EUROPE: IMMERSION COOLING MARKET SIZE, BY APPLICATION, 2017–2021 (USD MILLION)
                        TABLE 111 REST OF EUROPE: IMMERSION COOLING MARKET SIZE, BY APPLICATION, 2022–2030 (USD MILLION)
     11.4 NORTH AMERICA 
             FIGURE 38 NORTH AMERICA: IMMERSION COOLING MARKET SNAPSHOT
             TABLE 112 NORTH AMERICA: IMMERSION COOLING MARKET SIZE, BY COUNTRY, 2017–2021 (USD MILLION)
             TABLE 113 NORTH AMERICA: IMMERSION COOLING MARKET SIZE, BY COUNTRY, 2022–2030 (USD MILLION)
             TABLE 114 NORTH AMERICA: IMMERSION COOLING MARKET SIZE, BY APPLICATION, 2017–2021 (USD MILLION)
             TABLE 115 NORTH AMERICA: IMMERSION COOLING MARKET SIZE, BY APPLICATION, 2022–2030 (USD MILLION)
             TABLE 116 NORTH AMERICA: IMMERSION COOLING MARKET SIZE, BY TYPE, 2017–2021 (USD MILLION)
             TABLE 117 NORTH AMERICA: IMMERSION COOLING MARKET SIZE, BY TYPE, 2022–2030 (USD MILLION)
             TABLE 118 NORTH AMERICA: IMMERSION COOLING MARKET SIZE, BY COOLING FLUID, 2017–2021 (USD MILLION)
             TABLE 119 NORTH AMERICA: IMMERSION COOLING MARKET SIZE, BY COOLING FLUID, 2022–2030 (USD MILLION)
             TABLE 120 NORTH AMERICA: IMMERSION COOLING MARKET SIZE, BY COMPONENT, 2017–2021 (USD MILLION)
             TABLE 121 NORTH AMERICA: IMMERSION COOLING MARKET SIZE, BY COMPONENT, 2022–2030 (USD MILLION)
             11.4.1 US
                        11.4.1.1 Surging demand from cryptocurrency providers to drive market growth
                                      TABLE 122 US: IMMERSION COOLING MARKET SIZE, BY APPLICATION, 2017–2021 (USD MILLION)
                                      TABLE 123 US: IMMERSION COOLING MARKET SIZE, BY APPLICATION, 2022–2030 (USD MILLION)
             11.4.2 CANADA
                        11.4.2.1 Increasing digitalization and huge data generation to drive adoption of immersion cooling solutions
                                      TABLE 124 CANADA: IMMERSION COOLING MARKET SIZE, BY APPLICATION, 2017–2021 (USD MILLION)
                                      TABLE 125 CANADA: IMMERSION COOLING MARKET SIZE, BY APPLICATION, 2022–2030 (USD MILLION)
             11.4.3 MEXICO
                        11.4.3.1 Arrival of cloud, big data, Internet of Things, and automation technologies to drive market
                                      TABLE 126 MEXICO: IMMERSION COOLING MARKET SIZE, BY APPLICATION, 2017–2021 (USD MILLION)
                                      TABLE 127 MEXICO: IMMERSION COOLING MARKET SIZE, BY APPLICATION, 2022–2030 (USD MILLION)
     11.5 MIDDLE EAST & AFRICA 
             TABLE 128 MIDDLE EAST & AFRICA: IMMERSION COOLING MARKET SIZE, BY APPLICATION, 2017–2021 (USD MILLION)
             TABLE 129 MIDDLE EAST & AFRICA: IMMERSION COOLING MARKET SIZE, BY APPLICATION, 2022–2030 (USD MILLION)
             TABLE 130 MIDDLE EAST & AFRICA: IMMERSION COOLING MARKET SIZE, BY TYPE, 2017–2021 (USD MILLION)
             TABLE 131 MIDDLE EAST & AFRICA: IMMERSION COOLING MARKET SIZE, BY TYPE, 2022–2030 (USD MILLION)
             TABLE 132 MIDDLE EAST & AFRICA: IMMERSION COOLING MARKET SIZE, BY COOLING FLUID, 2017–2021 (USD MILLION)
             TABLE 133 MIDDLE EAST & AFRICA: IMMERSION COOLING MARKET SIZE, BY COOLING FLUID, 2022–2030 (USD MILLION)
             TABLE 134 MIDDLE EAST & AFRICA: IMMERSION COOLING MARKET SIZE, BY COMPONENT, 2017–2021 (USD MILLION)
             TABLE 135 MIDDLE EAST & AFRICA: IMMERSION COOLING MARKET SIZE, BY COMPONENT, 2022–2030 (USD MILLION)
     11.6 SOUTH AMERICA 
             TABLE 136 SOUTH AMERICA: IMMERSION COOLING MARKET SIZE, BY APPLICATION, 2017–2021 (USD MILLION)
             TABLE 137 SOUTH AMERICA: IMMERSION COOLING MARKET SIZE, BY APPLICATION, 2022–2030 (USD MILLION)
             TABLE 138 SOUTH AMERICA: IMMERSION COOLING MARKET SIZE, BY TYPE, 2017–2021 (USD MILLION)
             TABLE 139 SOUTH AMERICA: IMMERSION COOLING MARKET SIZE, BY TYPE, 2022–2030 (USD MILLION)
             TABLE 140 SOUTH AMERICA: IMMERSION COOLING MARKET SIZE, BY COOLING FLUID 2017–2021 (USD MILLION)
             TABLE 141 SOUTH AMERICA: IMMERSION COOLING MARKET SIZE, BY COOLING FLUID, 2022–2030 (USD MILLION)
             TABLE 142 SOUTH AMERICA: IMMERSION COOLING MARKET SIZE, BY COMPONENT, 2017–2021 (USD MILLION)
             TABLE 143 SOUTH AMERICA: IMMERSION COOLING MARKET SIZE, BY COMPONENT, 2022–2030 (USD MILLION)
 
12 COMPETITIVE LANDSCAPE (Page No. - 167)
     12.1 KEY PLAYERS' STRATEGIES/RIGHT TO WIN 
             12.1.1 OVERVIEW OF STRATEGIES ADOPTED BY IMMERSION COOLING VENDORS
     12.2 MARKET RANKING OF KEY PLAYERS 
             FIGURE 39 RANKING OF IMMERSION COOLING PROVIDERS IN 2021
     12.3 COMPANY EVALUATION QUADRANT 
             12.3.1 STARS
             12.3.2 PERVASIVE PLAYERS
             12.3.3 EMERGING LEADERS
             12.3.4 PARTICIPANTS
                        FIGURE 40 COMPETITIVE LANDSCAPE MAPPING: IMMERSION COOLING MARKET
     12.4 COMPETITIVE BENCHMARKING 
             12.4.1 PRODUCT FOOTPRINT
             12.4.2 APPLICATION FOOTPRINT
             12.4.3 REGIONAL FOOTPRINT
             12.4.4 PRODUCT OFFERING FOOTPRINT
     12.5 SME MATRIX, 2021 
             12.5.1 PROGRESSIVE COMPANIES
             12.5.2 DYNAMIC COMPANIES
             12.5.3 RESPONSIVE COMPANIES
             12.5.4 STARTING BLOCKS
                        FIGURE 41 COMPETITIVE LEADERSHIP MAPPING OF EMERGING COMPANIES
     12.6 COMPETITIVE SCENARIO AND TRENDS 
             12.6.1 PRODUCT LAUNCHES
             12.6.2 DEALS
             12.6.3 OTHERS
 
13 COMPANY PROFILES (Page No. - 189)
(Business Overview, Products Offered, Recent Developments, MnM View Right to win, Strategic choices made, Weaknesses and competitive threats) *
     13.1 KEY COMPANIES 
             13.1.1 GREEN REVOLUTION COOLING INC.
                        TABLE 144 GREEN REVOLUTION COOLING INC.: COMPANY OVERVIEW
             13.1.2 SUBMER
                        TABLE 145 SUBMER: COMPANY OVERVIEW
             13.1.3 ASPERITAS
                        TABLE 146 ASPERITAS: COMPANY OVERVIEW
             13.1.4 LIQUIDSTACK
                        TABLE 147 LIQUIDSTACK: COMPANY OVERVIEW
             13.1.5 MIDAS GREEN TECHNOLOGIES
                        TABLE 148 MIDAS GREEN TECHNOLOGIES: COMPANY OVERVIEW
             13.1.6 FUJITSU
                        TABLE 149 FUJITSU: COMPANY OVERVIEW
                        FIGURE 42 FUJITSU LIMITED: COMPANY SNAPSHOT
             13.1.7 ICEOTOPE TECHNOLOGIES LIMITED
                        TABLE 150 ICEOTOPE TECHNOLOGIES LIMITED: COMPANY OVERVIEW
             13.1.8 LIQUIDCOOL SOLUTIONS
                        TABLE 151 LIQUIDCOOL SOLUTIONS: COMPANY OVERVIEW
             13.1.9 DUG TECHNOLOGY
                        TABLE 152 DUG TECHNOLOGY: COMPANY OVERVIEW
                        FIGURE 43 DUG TECHNOLOGY: COMPANY SNAPSHOT
             13.1.10 DCX – THE LIQUID COOLING COMPANY
                        TABLE 153 DCX - THE LIQUID COOLING COMPANY: COMPANY OVERVIEW
             13.1.11 EXASCALER INC.
                        TABLE 154 EXASCALER INC.: COMPANY OVERVIEW
             13.1.12 SIXTYONEC TECHNOLOGY CORPORATION
                        TABLE 155 SIXTYONEC TECHNOLOGY CORPORATION: COMPANY OVERVIEW
             13.1.13 ENGINEERED FLUIDS
                        TABLE 156 ENGINEERED FLUIDS: COMPANY OVERVIEW
             13.1.14 TEIMMERS
                        TABLE 157 TEIMMERS: COMPANY OVERVIEW
             13.1.15 TMGCORE, INC.
                        TABLE 158 TMGCORE, INC.: COMPANY OVERVIEW
             13.1.16 GIGA-BYTE TECHNOLOGY CO., LTD.
                        TABLE 159 GIGA-BYTE TECHNOLOGY CO., LTD.: COMPANY OVERVIEW
                        FIGURE 44 GIGA-BYTE TECHNOLOGY CO., LTD.: COMPANY SNAPSHOT
             13.1.17 WIWYNN
                        TABLE 160 WIWYNN: COMPANY OVERVIEW
                        FIGURE 45 WIWYNN: COMPANY SNAPSHOT
             13.1.18 HYPERTEC
                        TABLE 161 HYPERTEC: COMPANY OVERVIEW
             13.1.19 TAS
                        TABLE 162 TAS: COMPANY OVERVIEW
             13.1.20 DELTA POWER SOLUTIONS
                        TABLE 163 DELTA POWER SOLUTIONS: COMPANY OVERVIEW
                        FIGURE 46 DELTA POWER SOLUTIONS: COMPANY SNAPSHOT
 
*Details on Business Overview, Products Offered, Recent Developments, MnM View, Right to win, Strategic choices made, Weaknesses and competitive threats might not be captured in case of unlisted companies.
 
14 APPENDIX (Page No. - 235)
     14.1 DISCUSSION GUIDE 
     14.2 KNOWLEDGESTORE: MARKETSANDMARKETS SUBSCRIPTION PORTAL 
     14.3 CUSTOMIZATION OPTIONS 
     14.4 RELATED REPORTS 
     14.5 AUTHOR DETAILS 

The study involved four major activities in estimating the current size of the immersion cooling market. Exhaustive secondary research was undertaken to collect information on the immersion cooling market, its peer markets, and its parent market. The next step was to validate these findings, assumptions, and sizing with the industry experts across the immersion cooling value chain through primary research. Both, top-down and bottom-up approaches were employed to estimate the overall size of the market. Thereafter, the market breakdown and data triangulation procedures were used to estimate the sizes of different segments and sub segments of the immersion cooling market.

Secondary Research

As a part of the secondary research process, various secondary sources such as Hoovers, Bloomberg, BusinessWeek, and Dun & Bradstreet were referred to for identifying and collecting information for this study on the antifog additives market. Secondary sources included annual reports, press releases & investor presentations of companies, white papers, certified publications, and articles by recognized authors, authenticated directories, and databases.

Secondary research was mainly conducted to obtain key information about the supply chain of the industry, the monetary chain of the market, the total pool of players, and market classification and segmentation according to industry trends to the bottom-most level, regional markets, and key developments undertaken from both, market- and technology oriented perspectives.

Primary Research

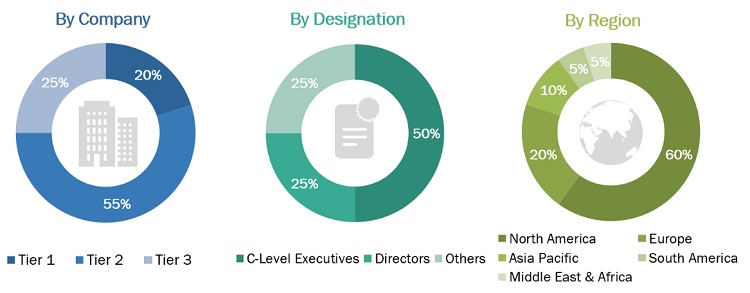
As a part of the primary research process, various primary sources from both supply and demand sides were interviewed to obtain qualitative and quantitative information for this report on the immersion cooling market. Primary sources from the supply side included industry experts such as Chief Executive Officers (CEOs), vice presidents, marketing directors, technology and innovation directors, and related key executives from various key companies and organizations operating in the immersion cooling market. Primary sources from the demand side included directors, marketing heads, and purchase managers from various end-use industries. Following is the breakdown of the primary respondents.
IoT in Smart Cities Market Size, and Share

To know about the assumptions considered for the study, download the pdf brochure

Market Size Estimation

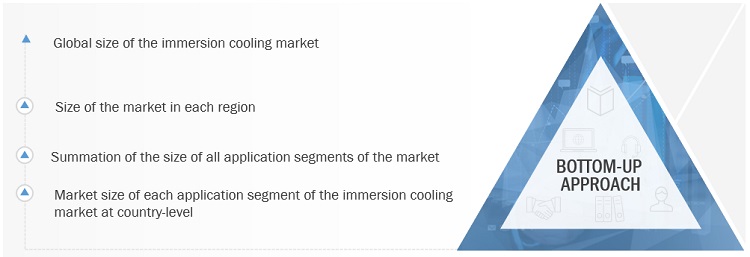
Both top-down and bottom-up approaches were used to estimate and validate the total size of the immersion cooling market. These methods were also used extensively to estimate the size of various segments and subsegments of the market. The research methodology used to estimate the market size includes the following:

  • The key players in the industry and markets were identified through extensive secondary research.
  • The supply chain of the industry and the market size, in terms of value, were determined through primary and secondary research processes.
  • All percentage shares, splits, and breakdowns were determined using secondary sources and verified through primary sources.

Global Immersion Cooling Market Size: Bottom-Up Approach
IoT in Smart Cities Market Size, and Share

To know about the assumptions considered for the study, Request for Free Sample Report

Data Triangulation

After arriving at the overall size from the market size estimation process explained above, the total market was split into several segments and subsegments. Data triangulation and market breakdown procedures were used, wherever applicable to complete the overall market engineering process and arrive at the exact statistics for all segments and subsegments of the market. The data was triangulated by studying various factors and trends from both the demand and supply sides. In addition t this, the market size was validated using both top-down and bottom-up approaches.

Objectives of the Report

  • To define, describe, and forecast the immersion cooling market based on application, type,  cooling fluid, components and region
  • To forecast the size of the market and its segments with respect to five main regions, namely, North America, Europe, Asia Pacific, the Middle East & Africa, and South America, along with their respective key countries
  • To provide detailed information regarding the major factors such as drivers, restraints, opportunities, and challenges influencing the growth of the market
  • To strategically analyze micro markets with respect to the individual growth trends, future prospects, and contribution to the total market
  • To analyze the opportunities in the market for stakeholders and provide a detailed competitive landscape for market leaders
  • To strategically profile key players and comprehensively analyze their market share and core competencies
  • To track and analyze competitive developments such as expansions, product launches, partnerships, agreements, and joint ventures in the immersion cooling market

Available Customizations

MarketsandMarkets offers the following customizations for this market report:

  • Further breakdown of the Middle East & African, and South American immersion cooling markets
  • Product matrix, which gives a detailed comparison of the product portfolio of each company
  • Detailed analysis and profiles of additional market players (up to 3)
Custom Market Research Services

We will customize the research for you, in case the report listed above does not meet with your exact requirements. Our custom research will comprehensively cover the business information you require to help you arrive at strategic and profitable business decisions.

Request Customization

Instant Answers with GPT - Ask Now!

Ask real questions. Get complete answers !
Report Code
CH 7299
Published ON
Oct, 2022
Choose License Type
BUY NOW
  • SHARE
X
Request Customization
Speak to Analyst
Speak to Analyst
OR FACE-TO-FACE MEETING
PERSONALIZE THIS RESEARCH
  • Triangulate with your Own Data
  • Get Data as per your Format and Definition
  • Gain a Deeper Dive on a Specific Application, Geography, Customer or Competitor
  • Any level of Personalization
REQUEST A FREE CUSTOMIZATION
LET US HELP YOU!
  • What are the Known and Unknown Adjacencies Impacting the Immersion Cooling Market
  • What will your New Revenue Sources be?
  • Who will be your Top Customer; what will make them switch?
  • Defend your Market Share or Win Competitors
  • Get a Scorecard for Target Partners
CUSTOMIZED WORKSHOP REQUEST
+1-888-600-6441
  • Call Us
  • +1-888-600-6441 (Corporate office hours)
  • +1-888-600-6441 (US/Can toll free)
  • +44-800-368-9399 (UK office hours)
CONNECT WITH US
ABOUT TRUST ONLINE
©2023 MarketsandMarkets Research Private Ltd. All rights reserved
DMCA.com Protection Status Website Feedback