Industrial Networking Solutions Market by Technology (SDWAN, WLAN, & IIoT), Service (Network Planning & Optimization, & Integration), Application (Predictive Maintenance, & Emergency & Incident Management), Vertical, and Region - Global Forecast to 2022


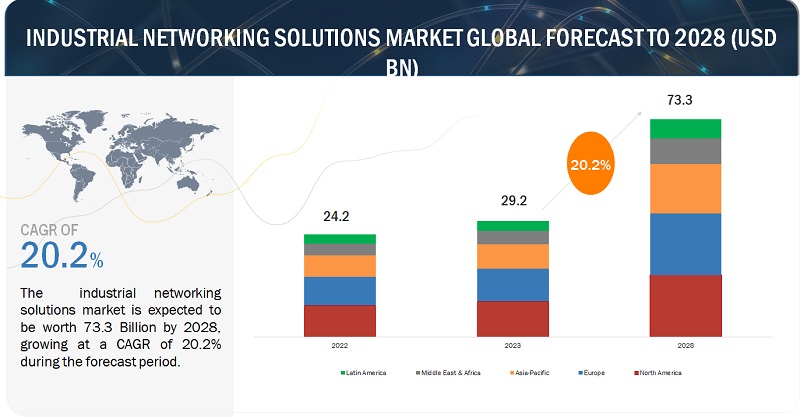
[176 Pages Report] The industrial networking solutions market size is expected to grow from USD 7.99 Billion in 2016 to USD 23.84 Billion by 2022, at a Compound Annual Growth Rate (CAGR) of 21.0% during the forecast period. The base year considered for the study is 2016 and the forecast period is from 2017 to 2022.
Objectives of the Study
The main objective of the report is to define, describe, and forecast the industrial networking solutions market size based on components (technologies and services), application, deployment, vertical, and region. The report provides detailed information on the major factors (drivers, restraints, opportunities, and challenges) influencing the market growth. The report attempts to forecast the market size with respect to the 5 main regions, namely, North America, Europe, Asia Pacific (APAC), Middle East and Africa (MEA), and Latin America. The report strategically profiles the key market players and comprehensively analyzes their core competencies. Moreover, it tracks and analyzes the competitive developments, such as joint ventures, mergers and acquisitions, and new product developments, in the market.
The research methodology used to estimate and forecast the industrial networking solutions market size was initiated with the collection and analysis of data on the key vendor revenues through secondary sources, including the annual reports and press releases, investor presentations, conferences and associations, such as Regional Industry Networking Conference (RINC) 2017; 13th Annual Conference on Wireless On-demand Network Systems and Services (WONS) 2017; Turnaround Industry Network Conference (TINC); and WLAN Pros Conference, technology journals, certified publications, articles from recognized authors, directories, and databases. In addition, the vendor offerings were taken into consideration to determine the market segmentations. The bottom-up procedure was employed to arrive at the overall market size of the market from the revenue of the key players and their market shares. The industrial networking solutions market expenditure across all the regions, along with the geographical split in various verticals, was considered to arrive at the overall market size. Post-arrival at the overall market size, the total market was split into several segments and subsegments and were verified through primary research by conducting extensive interviews with key people, such as Chief Executive Officers (CEOs), Vice Presidents (VPs), directors, and executives. The data triangulation and market breakdown procedures were employed to complete the overall market engineering process and arrive at the exact statistics for all the segments and subsegments. The breakdown of the profiles of the primary participants is depicted in the below figure:
To know about the assumptions considered for the study, download the pdf brochure
The industrial networking solutions market includes various vendors providing networking solutions and services to commercial clients across the globe. The companies, such as Huawei (China), Eaton (Ireland), Cisco (US), Dell EMC (US), Juniper Networks (US), Sierra Wireless (Canada), Aruba Networks (US), Veryx Technologies (US), ABB (Switzerland), Moxa (US), Belden (US), and Rockwell Automation (US) have adopted partnerships, agreements, and collaborations as the key strategies to enhance their market reach.
Key Target Audience for Industrial Networking Solutions Market
- Network solution providers
- Industrial networking solution providers
- Network operators
- Research organizations, universities, and consulting companies
- Cellular technology-related associations, organizations, forums, and alliances
- Network testing service providers
- Managed Service Providers (MSPs)
- Application design and software developers
- Consultancy firms and advisory firms
- Technology consultants
- Governments
The study answers several questions for the stakeholders, which market segments are expected to focus in the next 2 to 5 years to prioritize efforts and investments.
Scope of the Industrial Networking Solutions Market Report
|
Report Metrics |
Details |
|
Market size available for years |
20172022 |
|
Base year considered |
2016 |
|
Forecast period |
20172022 |
|
Forecast units |
Billion (USD) |
|
Segments covered |
Technology, Service, Application, Vertical, and Region |
|
Geographies covered |
North America, Europe, APAC, Latin America, and MEA |
|
Companies covered |
Huawei (China), Eaton (Ireland), Cisco (US), Dell EMC (US), Juniper Networks (US), Sierra Wireless (Canada), Aruba Networks (US), Veryx Technologies (US), ABB (Switzerland), Moxa (US), Belden (US), and Rockwell Automation (US). |
The research report segments the industrial networking solutions market into the following submarkets:
By Component:
- Technologies
- Services
Industrial Networking Solutions Market By Technology
- WLAN
- SDWAN
- IIoT
Industrial Networking Solutions Market By Service
- Network planning and optimization
- Network integration
- Network orchestration
- Training and education
- Network security
- Network provisioning
- Support and maintenance
- Network consulting
- Network auditing and testing
By Application Area:
- Remote monitoring
- Asset tracking and management
- Supply chain management
- Real-time streaming and video
- Emergency and incident management
- Predictive maintenance
By Deployment:
- Cloud
- On-premises
By Vertical:
- Discrete Industry
- Automotive
- Machine manufacturing
- Semiconductor and electronics
- Medical devices
- Logistics and transportation
- Process Industry
- Energy and utilities
- Chemicals and materials
- Food and beverage
- Water and waste management
- Others (pharmaceutical, mining and metals, and pulp and paper)
Industrial Networking Solutions Market By Networking Type:
- Wireless networking
- Wireline networking
By Industry Size:
- Small and Medium Scale Industries
- Large Scale Industries
By Region:
- North America
- Europe
- APAC
- MEA
- Latin America
Available Customizations
With the given market data, MarketsandMarkets offers customizations as per the companys specific needs. The following customization options are available for the report:
Geographic Analysis
- Further breakdown of the North American market into the US and Canada
- Further breakdown of the European market into the UK, Germany, and France
Company Information
- Detailed analysis and profiling of additional market players
MarketsandMarkets estimates the global industrial networking solutions market size to grow from USD 9.18 Billion in 2017 to USD 23.84 Billion by 2022, at a Compound Annual Growth Rate (CAGR) of 21.0% during the forecast period. The major factors that are expected to drive the growth of the market include the growth in demand for Software Defined Wide Area Network (SDWAN) solutions and rise in need for predictive maintenance. In addition, the proliferation of wireless technologies in industry operations and advent of data analytics and data processing are some of the factors that are expected to boost the market growth. The industrial networking solutions market is segmented based on components (technologies and services), application, deployment, vertical, and region.
In the component segment, the services subsegment is expected to account for the largest market share. Industrial networking services play a vital role in the deployment and integration of industrial networking solutions in a factorys operating environment. In addition, services are considered as the backbone of industrial networking, as they are instrumental in fulfilling the clients requirements, such as network provisioning, network testing and auditing, network planning and optimization, network orchestration, support and maintenance, training and education, and network consulting.
The predictive maintenance sub segment under the application segment is expected to grow at the fastest rate attributed to the fact that latest industrial networking technologies have provided a complete paradigm shift with respect to the operations and maintenance of the industrial equipment. The predictive maintenance application smartly identifies the primary variables through root cause analysis. It analyzes the assets performance and products quality. The aim of the predictive maintenance application is to improve the reflectiveness of every machine in the customers site and avoid machine failures and the associated consequences. The companies, such as Moxa have offered predictive maintenance applications, called proactive self-maintenance, which helps industries to monitor the health of the computers deployed in their Industrial Internet of Things (IIoT) enabled systems.
The discrete industry sub segment is expected to account for the largest market share in the vertical segment attributed to the fact that IIoT technologies have enabled the discrete industry organizations to shorten their time-to-market and maintain a competitive advantage in the market. The discrete industry sub segment is involved in the manufacturing of distinct items, such as heavy machines, automobile parts, semiconductor and electronics, medical devices, and logistics and transportation equipment. The manufacturers in the discrete industry face challenges, such as the ever-changing customer expectations, accelerated time-to-market cycles, regulatory pressure, and increase in cost of materials. To address such challenges, the discrete industry companies have started using IIoT technologies and data analytics. The IIoT technology uses sensors fitted into finished goods to track the usage patterns and help the engineers view the usage rate of a product. Further, deeper insights are derived, by assessment of usage patterns and rate of a product, to improve the product design by identifying feature gaps, non-value adding features, use-case segments, and engineering pitfall.
North America is estimated to account for the largest market share in the industrial networking solutions market in 2017. The factors that propel this growth include increase in adoption of smart connected devices, Industrial Internet of Everything (IIoE), and agile networks. Moreover, different stakeholders, such as industrial networking solution providers, Managed Service Providers (MSPs), technology consultants, and network operators, have partnered with major players to enhance the organizational networking ecosystem in North America. For instance, Aruba Networks partnered with Tillamook County Creamery Association (TCCA), a manufacturer and seller of dairy products. This partnership enabled TCCA to deploy an all-wireless network at its new Portland, Oregon office. After the US, Canada is expected to account for the major share in the industrial networking solutions market in North America. The Canadian companies have improved and optimized their network processes by utilizing industrial networking technologies. For instance, in September 2017, Sierra Wireless, one of the industrial networking solution providers in Canada, introduced LTE-Advanced Pro cellular modules to offer fast IoT applications for mobile computing, networking, and industrial Machine-to-Machine (M2M).
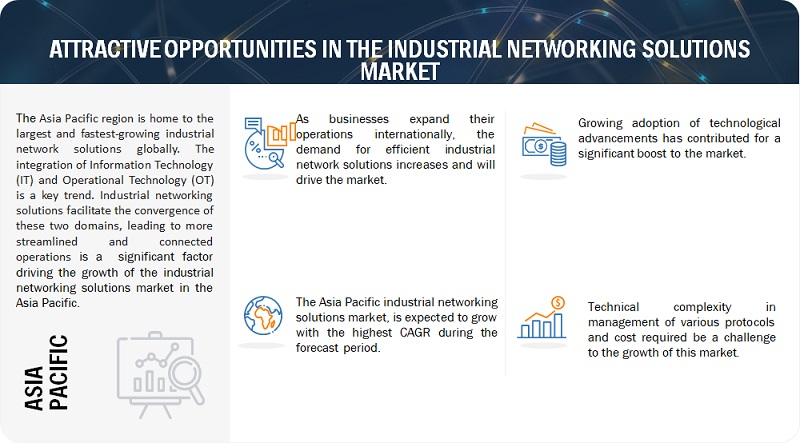
Asia-Pacific (APAC) is expected to grow at the highest CAGR during the forecast period attributed to the fact that it has witnessed the fastest growth rate, owing to the rapid development of the network infrastructure. Moreover, this region has witnessed robust initiatives to upsurge the industrial networking infrastructure in different countries. For instance, IIoT initiatives in Singapore form a part of a larger Smart Nation Initiative, which is expected to help foster stronger communities, create job opportunities, and improve public services.
Data security and privacy concerns are expected to be the major restraining factor for the growth of the industrial networking solutions market. However, the recent developments, such as new product launches and acquisitions, undertaken by the major market players are expected to boost the market growth.
The study measures and evaluates the major offerings and key strategies of the key market vendors, including Huawei (China), Eaton (Ireland), Cisco (US), Dell EMC (US), Juniper Networks (US), Sierra Wireless (Canada), Aruba Networks (US), Veryx Technologies (US), ABB (Switzerland), Moxa (US), Belden (US), and Rockwell Automation (US). These companies have been at the forefront in offering reliable industrial networking solutions to commercial clients across diverse locations.
To speak to our analyst for a discussion on the above findings, click Speak to Analyst
Table of Contents
1 Introduction (Page No. - 19)
1.1 Objectives of the Study
1.2 Market Definition
1.3 Market Scope
1.4 Years Considered for the Study
1.5 Currency
1.6 Stakeholders
2 Research Methodology (Page No. - 22)
2.1 Research Data
2.1.1 Secondary Data
2.1.2 Primary Data
2.1.2.1 Breakdown of Primaries
2.1.2.2 Key Industry Insights
2.2 Market Size Estimation
2.3 Research Assumptions
2.4 Limitations
3 Executive Summary (Page No. - 29)
4 Premium Insights (Page No. - 34)
4.1 Attractive Market Opportunities in the Industrial Networking Solutions Market
4.2 Market: Top 3 Applications and Regions
4.3 Market, By Vertical, 2017
4.4 Market, By Region, 20172022
4.5 Market Investment Scenario
5 Market Overview (Page No. - 37)
5.1 Introduction
5.2 Market Dynamics
5.2.1 Drivers
5.2.1.1 Growing Need for Predictive Maintenance
5.2.1.2 Increase in Demand for Sdwan Solutions
5.2.1.3 Proliferation of Wireless Technologies in Industry Operations
5.2.1.4 Advent of Data Analytics and Data Processing
5.2.2 Restraints
5.2.2.1 Data Security and Privacy Concerns
5.2.3 Opportunities
5.2.3.1 Continuous Increase in the Number of IoT Devices
5.2.3.2 Convergence of Ot and It
5.2.4 Challenges
5.2.4.1 Complexities in Connecting Legacy Systems to the Smart Infrastructures
5.2.4.2 Data Migration Challenges
5.3 Industrial Protocols
5.3.1 Wired
5.3.1.1 Fieldbus
5.3.1.1.1 Profibus
5.3.1.1.2 Modbus
5.3.1.1.3 Devicenet
5.3.1.1.4 Canopen
5.3.1.1.5 CC-Link
5.3.1.1.6 AS-I
5.3.1.1.7 Interbus
5.3.1.1.8 Controlnet
5.3.1.2 Industrial Ethernet
5.3.1.2.1 Profinet
5.3.1.2.2 Ethernet/IP
5.3.1.2.3 Powerlink
5.3.1.2.4 Modbus/TCP
5.3.2 Wireless
5.3.2.1 Cellular
5.3.2.2 Lora
5.3.2.3 Wi-Fi
5.3.2.4 Bluetooth
5.3.2.5 Zigbee
5.3.2.6 Wirelesshart
6 Industrial Networking Solutions Market, By Component (Page No. - 47)
6.1 Introduction
6.2 Technologies
6.3 Services
7 Industrial Networking Solutions, By Technology (Page No. - 52)
7.1 Introduction
7.2 Software-Defined Wide Area Network
7.3 Wireless Local Area Network
7.4 Industrial Internet of Things
8 Market, By Service (Page No. - 59)
8.1 Introduction
8.2 Network Planning and Optimization
8.3 Network Integration
8.4 Network Orchestration
8.5 Training and Education
8.6 Network Consulting
8.7 Network Provisioning
8.8 Network Security
8.9 Network Auditing and Testing
8.10 Support and Maintenance
9 Industrial Networking Solutions Market, By Application (Page No. - 69)
9.1 Introduction
9.2 Remote Monitoring
9.3 Asset Tracking and Management
9.4 Supply Chain Management
9.5 Real-Time Streaming and Video
9.6 Emergency and Incident Management
9.7 Predictive Maintenance
10 Market, By Deployment (Page No. - 79)
10.1 Introduction
10.2 Cloud
10.3 On-Premises
11 Industrial Networking Solutions Market, By Vertical (Page No. - 84)
11.1 Introduction
11.2 Process Industry
11.2.1 Energy and Utilities
11.2.2 Chemicals and Materials
11.2.3 Food and Beverage
11.2.4 Water and Waste Management
11.2.5 Others
11.3 Discrete Industry
11.3.1 Automotive
11.3.2 Machine Manufacturing
11.3.3 Semiconductor and Electronics
11.3.4 Medical Devices
11.3.5 Logistics and Transportation
12 Market, By Networking Type (Page No. - 96)
12.1 Introduction
12.2 Wireless Networking
12.3 Wireline Networking
13 Industrial Networking Solutions Market, By Industry Size (Page No. - 98)
13.1 Introduction
13.2 Small and Medium-Scale Industries
13.3 Large-Scale Industries
14 Industrial Networking Solutions, By Region (Page No. - 100)
14.1 Introduction
14.2 North America
14.3 Europe
14.4 Asia Pacific
14.5 Middle East and Africa
14.6 Latin America
15 Competitive Landscape (Page No. - 126)
15.1 Overview
15.2 Market Ranking
15.3 Competitive Scenario
15.3.1 New Product/ and Service Launches and Product Enhancements
15.3.2 Partnerships and Collaborations
15.3.3 Mergers and Acquisitions
16 Company Profiles (Page No. - 131)
(Business Overview, Solutions/Services Offered, Recent Developments, SWOT Analysis, MnM View)*
16.1 Juniper Networks
16.2 Huawei
16.3 Sierra Wireless
16.4 Dell Emc
16.5 Cisco
16.6 Rockwell Automation
16.7 Eaton
16.8 Veryx Technologies
16.9 Aruba (A Hpe Company)
16.10 Moxa
16.11 ABB
16.12 Belden
*Details on Business Overview, Solutions/Services Offered, Recent Developments, SWOT Analysis, MnM View Might Not Be Captured in Case of Unlisted Companies.
17 Appendix (Page No. - 167)
17.1 Industry Experts
17.2 Discussion Guide
17.3 Knowledge Store: Marketsandmarkets Subscription Portal
17.4 Introducing RT: Real-Time Market Intelligence
17.5 Available Customizations
17.6 Related Reports
17.7 Author Details
List of Tables (86 Tables)
Table 1 Industrial Networking Solutions Market Size and Growth Rate, 20152022 (USD Million, Y-O-Y %)
Table 2 Industrial Networking Solutions Market Size, By Component, 20152022 (USD Million)
Table 3 Technologies: Market Size, By Region, 20152022 (USD Million)
Table 4 Services: Market Size, By Region, 20152022 (USD Million)
Table 5 Industrial Networking Solutions Market Size, By Technology, 20152022 (USD Million)
Table 6 Software-Defined Wide Area Network: Market Size, By Region, 20152022 (USD Million)
Table 7 Wireless Local Area Network: Market Size, By Region, 20152022 (USD Million)
Table 8 Industrial Internet of Things: Market Size, By Region, 20152022 (USD Million)
Table 9 Industrial Networking Solutions Market Size, By Service, 20152022 (USD Million)
Table 10 Network Planning and Optimization: Market Size, By Region, 20152022 (USD Million)
Table 11 Network Integration: Market Size, By Region, 20152022 (USD Million)
Table 12 Network Orchestration: Market Size, By Region, 20152022 (USD Million)
Table 13 Training and Education: Market Size, By Region, 20152022 (USD Million)
Table 14 Network Consulting: Market Size, By Region, 20152022 (USD Million)
Table 15 Network Provisioning: Market Size, By Region, 20152022 (USD Million)
Table 16 Network Security: Market Size, By Region, 20152022 (USD Million)
Table 17 Network Auditing and Testing: Market Size, By Region, 20152022 (USD Million)
Table 18 Support and Maintenance: Market Size, By Region, 20152022 (USD Million)
Table 19 Industrial Networking Solutions Market Size, By Application, 20152022 (USD Million)
Table 20 Remote Monitoring: Market Size, By Region, 20152022 (USD Million)
Table 21 Asset Tracking and Management: Market Size, By Region, 20152022 (USD Million)
Table 22 Supply Chain Management: Market Size, By Region, 20152022 (USD Million)
Table 23 Real-Time Streaming and Video: Market Size, By Region, 20152022 (USD Million)
Table 24 Emergency and Incident Management: Market Size, By Region, 20152022 (USD Million)
Table 25 Predictive Maintenance: Market Size, By Region, 20152022 (USD Million)
Table 26 Industrial Networking Solutions Market Size, By Deployment, 20152022 (USD Million)
Table 27 Cloud: Market Size, By Region, 20152022 (USD Million)
Table 28 On-Premises: Market Size, By Region, 20152022 (USD Million)
Table 29 Industrial Networking Solutions Market Size, By Vertical, 20152022 (USD Million)
Table 30 Process Industry: Market Size, By Vertical, 20152022 (USD Million)
Table 31 Energy and Utilities Market Size, By Region, 20152022 (USD Million)
Table 32 Chemicals and Materials Market Size, By Region, 20152022 (USD Million)
Table 33 Food and Beverage Market Size, By Region, 20152022 (USD Million)
Table 34 Water and Waste Management Market Size, By Region, 20152022 (USD Million)
Table 35 Others Market Size, By Region, 20152022 (USD Million)
Table 36 Discrete Industry: Industrial Networking Solutions Market Size, By Vertical, 20152022 (USD Million)
Table 37 Automotive Market Size, By Region, 20152022 (USD Million)
Table 38 Machine Manufacturing Market Size, By Region, 20152022 (USD Million)
Table 39 Semiconductor and Electronics Market Size, By Region, 20152022 (USD Million)
Table 40 Medical Devices Market Size, By Region, 20152022 (USD Million)
Table 41 Logistics and Transportation Market Size, By Region, 20152022 (USD Million)
Table 42 Industrial Networking Solutions Market Size, By Region, 20152022 (USD Million)
Table 43 North America: Industrial Networking Solutions Market Size, By Component, 20152022 (USD Million)
Table 44 North America: Market Size, By Technology, 20152022 (USD Million)
Table 45 North America: Market Size, By Service, 20152022 (USD Million)
Table 46 North America: Market Size, By Application, 20152022 (USD Million)
Table 47 North America: Market Size, By Deployment, 20152022 (USD Million)
Table 48 North America: Market Size, By Vertical, 20152022 (USD Million)
Table 49 North America: Market Size, By Process Industry, 20152022 (USD Million)
Table 50 North America: Market Size, By Discrete Industry, 20152022 (USD Million)
Table 51 Europe: Industrial Networking Solutions Market Size, By Component, 20152022 (USD Million)
Table 52 Europe: Market Size, By Technology, 20152022 (USD Million)
Table 53 Europe: Market Size, By Service, 20152022 (USD Million)
Table 54 Europe: Market Size, By Application, 20152022 (USD Million)
Table 55 Europe: Market Size, By Deployment, 20152022 (USD Million)
Table 56 Europe: Market Size, By Vertical, 20152022 (USD Million)
Table 57 Europe: Market Size, By Process Industry, 20152022 (USD Million)
Table 58 Europe: Market Size, By Discrete Industry, 20152022 (USD Million)
Table 59 Asia Pacific: Industrial Networking Solutions Market Size, By Component, 20152022 (USD Million)
Table 60 Asia Pacific: Market Size, By Technology, 20152022 (USD Million)
Table 61 Asia Pacific: Market Size, By Service, 20152022 (USD Million)
Table 62 Asia Pacific: Market Size, By Application, 20152022 (USD Million)
Table 63 Asia Pacific: Market Size, By Deployment, 20152022 (USD Million)
Table 64 Asia Pacific: Market Size, By Vertical, 20152022 (USD Million)
Table 65 Asia Pacific: Market Size, By Process Industry, 20152022 (USD Million)
Table 66 Asia Pacific: Market Size, By Discrete Industry, 20152022 (USD Million)
Table 67 Middle East and Africa: Industrial Networking Solutions Market Size, By Component, 20152022 (USD Million)
Table 68 Middle East and Africa: Market Size, By Technology, 20152022 (USD Million)
Table 69 Middle East and Africa: Market Size, By Service, 20152022 (USD Million)
Table 70 Middle East and Africa: Market Size, By Application, 20152022 (USD Million)
Table 71 Middle East and Africa: Market Size, By Deployment, 20152022 (USD Million)
Table 72 Middle East and Africa: Market Size, By Vertical, 20152022 (USD Million)
Table 73 Middle East and Africa: Market Size, By Process Industry, 20152022 (USD Million)
Table 74 Middle East and Africa: Market Size, By Discrete Industry, 20152022 (USD Million)
Table 75 Latin America: Industrial Networking Solutions Market Size, By Component, 20152022 (USD Million)
Table 76 Latin America: Market Size, By Technology, 20152022 (USD Million)
Table 77 Latin America: Market Size, By Service, 20152022 (USD Million)
Table 78 Latin America: Market Size, By Application, 20152022 (USD Million)
Table 79 Latin America: Market Size, By Deployment, 20152022 (USD Million)
Table 80 Latin America: Market Size, By Vertical, 20152022 (USD Million)
Table 81 Latin America: Market Size, By Process Industry, 20152022 (USD Million)
Table 82 Latin America: Market Size, By Discrete Industry, 20152022 (USD Million)
Table 83 Market Ranking for the Industrial Networking Solutions Market, 2017
Table 84 New Product/Service Launches and Product Enhancements, 20152017
Table 85 Partnerships and Collaborations, 20162017
Table 86 Mergers and Acquisitions, 2015-2017
List of Figures (64 Figures)
Figure 1 Industrial Networking Solutions Market: Market Segmentation
Figure 2 Industrial Networking Solutions Market: Research Design
Figure 3 Data Triangulation
Figure 4 Market Size Estimation Methodology: Bottom-Up Approach
Figure 5 Market Size Estimation Methodology: Top-Down Approach
Figure 6 Market: Assumptions
Figure 7 Market, By Region, 2017
Figure 8 Industrial Networking Solutions Market, By Component, 2017
Figure 9 Market, Top 5 Segments, 2017
Figure 10 Increase in Demand for Software-Defined Wide Area Network Solution is Expected to Be Driving the Industrial Networking Solutions Market
Figure 11 Emergency and Incident Management Application, and North America are Estimated to Have the Largest Market Shares in 2017
Figure 12 Discrete Industry Vertical is Expected to Hold A Larger Market Size During the Forecast Period
Figure 13 North America is Expected to Hold the Largest Market Size During the Forecast Period
Figure 14 Asia Pacific is Expected to Emerge as the Best Market for Investments in the Next 5 Years
Figure 15 Industrial Networking Solutions Market: Drivers, Restraints, Opportunities, and Challenges
Figure 16 Services Segment is Expected to Dominate the Market During the Forecast Period
Figure 17 North America is Expected to Dominate the Technologies Segment During the Forecast Period
Figure 18 North America is Expected to Have the Largest Market Size During the Forecast Period
Figure 19 Industrial Internet of Things Technology is Expected to Dominate During the Forecast Period
Figure 20 North America is Expected to Have the Largest Market Size During the Forecast Period
Figure 21 Asia Pacific is Expected to Grow at the Highest CAGR During the Forecast Period
Figure 22 Middle East and Africa is Expected to Grow at the Highest CAGR During the Forecast Period
Figure 23 Network Planning and Optimization Segment is Expected to Have the Largest Market Size During the Forecast Period
Figure 24 North America is Expected to Have the Largest Market Share During the Forecast Period
Figure 25 North America is Expected to Have the Largest Market Share During the Forecast Period
Figure 26 Emergency and Incident Management Segment is Expected to Have the Largest Market Size During the Forecast Period
Figure 27 Middle East and Africa is Expected to Grow at the Highest CAGR During the Forecast Period
Figure 28 North America is Expected to Have the Largest Market Size During the Forecast Period
Figure 29 North America is Expected to Have the Largest Market Size During the Forecast Period
Figure 30 Middle East and Africa is Expected to Grow at the Highest CAGR During the Forecast Period
Figure 31 North America is Expected to Have the Largest Market Size During the Forecast Period
Figure 32 North America is Expected to Hold the Largest Market Size During the Forecast Period
Figure 33 On-Premises Deployment Segment is Expected to Hold A Larger Market Size During the Forecast Period
Figure 34 North America is Expected to Have the Largest Market Size During the Forecast Period
Figure 35 Asia Pacific is Expected to Grow at the Highest CAGR During the Forecast Period
Figure 36 Discrete Industry Vertical is Expected to Have the Largest Market Size During the Forecast Period
Figure 37 Energy and Utilities Vertical is Expected to Have the Largest Market Size During the Forecast Period
Figure 38 North America is Expected to Hold the Largest Market Size During the Forecast Period
Figure 39 Machine Manufacturing Vertical is Expected to Hold the Largest Market Size During the Forecast Period
Figure 40 Asia Pacific is Expected to Hold the Largest Market Size During the Forecast Period
Figure 41 Asia Pacific is Expected to Exhibit the Highest CAGR During the Forecast Period
Figure 42 Asia Pacific is Expected to Be an Attractive Destination for Investments
Figure 43 North America: Industrial Networking Solutions Market Snapshot
Figure 44 North America: Services Segment is Expected to Have Largest Market Size During the Forecast Period
Figure 45 Europe: Technologies Segment is Expected to Have A Higher CAGR During the Forecast Period
Figure 46 Asia Pacific: Industrial Networking Solutions Market Snapshot
Figure 47 Asia Pacific: Services Segment is Expected to Have A Larger Market Size During the Forecast Period
Figure 48 Middle East and Africa: Technologies Segment is Expected to Grow at A Higher CAGR During the Forecast Period
Figure 49 Latin America: Services Segment is Expected to Have A Larger Market Size During the Forecast Period
Figure 50 Key Developments By the Leading Players in the Market During 20152017
Figure 51 Industrial Networking Solutions Market Evaluation Framework
Figure 52 Juniper Networks: Company Snapshot
Figure 53 Juniper Networks: SWOT Analysis
Figure 54 Huawei: Company Snapshot
Figure 55 Huawei: SWOT Analysis
Figure 56 Sierra Wireless: Company Snapshot
Figure 57 Sierra Wireless: SWOT Analysis
Figure 58 Dell EMC: SWOT Analysis
Figure 59 Cisco: Company Snapshot
Figure 60 Cisco: SWOT Analysis
Figure 61 Rockwell Automation: Company Snapshot
Figure 62 Eaton: Company Snapshot
Figure 63 ABB: Company Snapshot
Figure 64 Belden: Company Snapshot


Growth opportunities and latent adjacency in Industrial Networking Solutions Market