Video Analytics Market

Video Analytics Market by Component (Software and Services), Application (Incident Detection, Intrusion Management, Traffic Monitoring), Deployment Model (Cloud and On-premises), Type, Vertical and Region - Global Forecast to 2027

Report Code: TC 3523 Oct, 2022, by marketsandmarkets.com

Updated on : July 10, 2023

Video Analytics Market Statistics

The global Video Analytics Market is projected to reach USD 7.1 billion in 2022 to USD 20.3 billion by 2027, at a compound annual growth rate (CAGR) of 23.4% during the forecast period. The limitations of manual video analysis is one of the primary factors driving the market growth. Moreover, the reduced cost of video surveillance equipment and long-term ROI are driving the adoption of video analytics solutions.
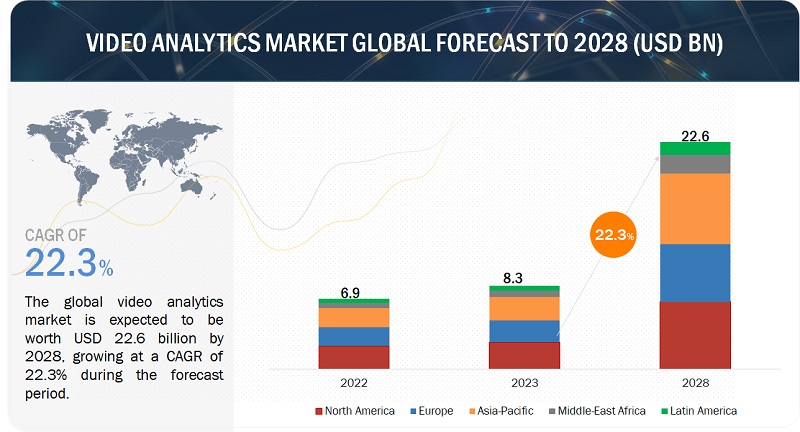
Video Analytics Market

To know about the assumptions considered for the study, Request for Free Sample Report

COVID-19 Impact Analysis

The impact of COVID-19 on the video analytics market has affected large and small enterprises across various industry verticals.

  • According to the survey by CNBC, in early 2021, most Americans traveled domestically for vacations. As a result, the demand for advanced AI-based surveillance systems with COVID-protocol integration increased. For instance, the DV-2332 AI Box device from IDIS, Ltd. supports crowd detection, mask detection, occupancy control, and social distancing features, which are crucial for hotels, bars, restaurants, museums, and other hospitality and leisure centers.
  • Major component and technology providers, such as Cisco and Honeywell, have faced supply chain disruption amidst the COVID-19 pandemic. In response, the companies shifted their focus to supply critical infrastructure to mission-critical end uses, such as telemedicine, first responders, healthcare providers, and laboratories.
  • European countries are deploying GDPR-compliant AI-based video surveillance solutions amidst the COVID-19 pandemic to monitor the crowd for COVID-19 norm violations. For instance, Datakalab (France) provided software to detect mask and social distancing violations in the resort city of Cannes through cameras installed on the roads and buses.
  • The local police from numerous cities, such as Madrid (Spain), Paris (France), and Rome (Italy), have effectively used drones to monitor the crowd amidst lockdowns. The police departments also collected valuable data on violators and crowd density to frame crowd control strategies and draft further regulations.
  • The temporary closure of camera and hardware manufacturing facilities from major companies, such as Hikvision and Huawei, has disrupted the global supply chain, reducing the deployment of city surveillance and video analytics solutions across the region.
  • Airports and train stations are upgrading their infrastructure with state-of-the-art video surveillance and analytics systems to monitor the passengers at check-in, entry, exits, security, immigration, and queues, thereby containing the spread of COVID-19. For instance, GMR Hyderabad International Airport (India) has installed a Queue Management System from AllGoVision to manage the crowd in the airport and frame effective strategies based on passenger density and crowd data collection.
  • Amidst the COVID-19 pandemic, the stadiums and sports venues require an effective and advanced crowd management system. Qatar's 2022 FIFA World Cup has opened lucrative opportunities for video analytics and surveillance system companies. The stadiums across Doha and the rest of Qatar have been proposed to host the event. Some of these stadiums include Lusail Iconic Stadium, Al Bayt Stadium, Al Thumama Stadium, and Ras Abu Aboud Stadium.
  • The football stadiums across the region have started opening for the major matches by following social distancing and installing advanced equipment to monitor the audience concerning COVID-19 norms. For instance, in July 2021, Maracanã Stadium from Rio de Janeiro opened with a 10% attendance from the total of 78 thousand seat stadium for the Copa America final match.

Video Analytics Market Dynamics

Drivers: Limitations of manual video analysis

There are many disadvantages associated with the manual analysis of surveillance videos. Labor costs have been deterring the utilization of humans for the manual analysis of surveillance videos. Video analytics helps reduce labor costs by either increasing the surveillance capacity of monitoring individuals or re-deploying employees to perform non-monitoring duties in extreme cases of cost restructuring, removing the need for employees entirely. In the case of human employees, large amounts of video footage can prove to be a grave obstacle for quick and intelligent video analysis, and swift incident responses. Along with video analytics, the analysis of very large amounts of video footage and data can be done quickly, thus reducing the need for employees. Human fatigue is another issue that can be overcome with the help of video analytics solutions. Unlike humans, who miss out on over 90% of video activities after 20 minutes of continuous surveillance video monitoring, the video analytics software keeps up the efficiency level, thus greatly reducing the number of false positives. Human integrity also plays during manual analysis, whereas video analytics software achieves operational compliance by adhering to defined rules and response procedures.

Restraints: Government regulations related to CCTV surveillance

The vast applications of video analytics have encouraged governments, organizations, and enterprises to embed video analytics with their video surveillance systems. These systems capture and analyze video footage 24x7. It is used for different purposes, such as facial recognition, people counting, and ANPR. Despite its advantages, many questions have been raised over citizens' privacy. This has resulted in stringent regulations to control anti-social activities; countries such as the US and UK are imposing the use of video analytics in selected areas only with limited functionalities. For instance, in October 2021, the European Parliament passed a nonbinding resolution that bans the police use of facial recognition in public places and the creation of private facial recognition databases. In Oakland and Somerville, similar bans are expected to be applied to facial recognition and other remote biometric surveillance systems. General Data Protection Regulation (GDPR) has also given guidelines about the collected data via CCTV video footage. Organizations and businesses cannot install CCTV without a valid reason as per the instructions of the GDPR. Hence, stringent regulations are expected to hinder the growth of the global video analytics market.

Opportunities: Predictive information using video analytics

Predictive analytics is used to make predictions about future events. It uses statistics, modeling, data mining, ML, and AI techniques. The video system captures critical and valuable signals, which include unstructured streams, such as video, audio, and social media data containing key customer behavioral attributes. It can also capture atmospheric data as surveillance cameras are placed in open areas. All these parameters can be combined and used to generate predictions, but the prediction can be difficult. Storage requirements, time consumption, and review of each video clip are some factors that might challenge the generation of predictive information. Hence, the generation of predictive information through video analytics can act as an opportunity for the global video analytics market.

Challenges: Interoperability complexities and support for older equipment of surveillance systems

The interoperability of surveillance systems is one of the major issues that impact the growth of the video analytics market and user experience. It also makes the analysis of a large volume of CCTV difficult and time-consuming. The major reason for interoperability is the large number of vendors operating in the market. All vendors have their preferred video format for processing and unique encrypted casing. The lack of standardization makes integrating, viewing, and exchanging data from different systems difficult. The need to standardize video analytics is very important as many new futures are being introduced to enhance the system's capabilities in representing the properties of objects, events, and scene contents. Hence, the interoperability of video surveillance systems is expected to pose challenges for vendors in this market.

Video analytics Market Ecosystem
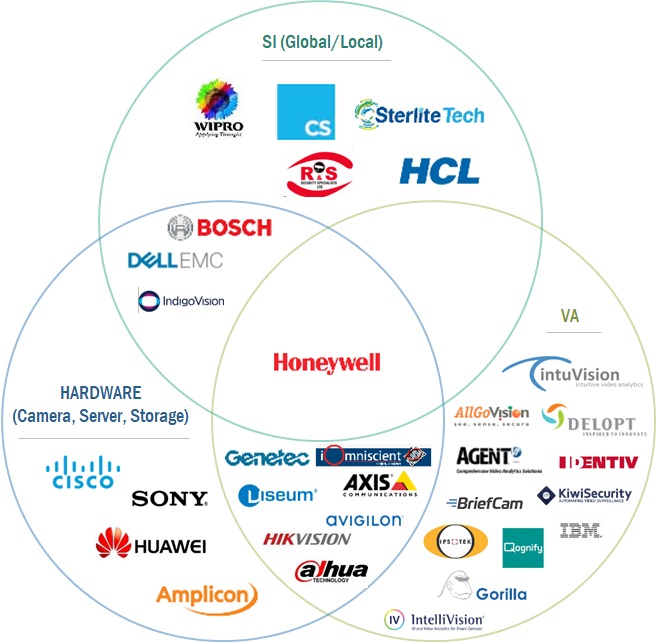
Video Analytics Market Size, and Share

To know about the assumptions considered for the study, download the pdf brochure

By Application, the Facial Recognition segment is expected to account for the highest growth during the forecast period

The facial recognition segment is expected to account for the highest growth rate during the forecast period. Facial recognition enables the easy identification of people’s faces by comparing the live captured image with the digital image data stored in a data repository. The facial recognition application is aggressively adopted in brick-and-mortar stores to offer customized solutions based on customers’ earlier interactions with the company. It also comes in handy in effectively identifying and monitoring offenders inside stores, resulting in enhanced operational performance and improved monitoring without needing to increase the staff.

By Deployment Model, the On-premises segment is expected to account for a larger market size during the forecast period

The deployment model estimates the on-premises segment to account for a larger market share. On-premises is a delivery model where the software or solution is installed and operated from the customers’ in-house server and computing infrastructure. This approach is mostly adopted for applications that involve processing sensitive and confidential data volumes. Several large organizations are deploying on-premises video analytics due to privacy and security concerns related to confidential data.

By Region, Asia Pacific is expected to record the highest growth during the forecast period

The video analytics market in the Asia Pacific is expected to witness exponential growth, mainly because of the rising awareness about the potential security threats to individuals and the growing manufacturing industry. The rapid growth in mobile device manufacturing has considerably reduced the cost of camera components, making it cheaper for SMEs and private individuals to install surveillance cameras. Moreover, the rapid GDP growth in Asia Pacific countries has resulted in infrastructure modernization projects, such as smart city projects and mass public transit systems, which have increased the demand for video analytics. The Yinchuan city in China is one of the most advanced smart cities in the Asia Pacific, with almost all infrastructure integrated into a unified system. Singapore is also moving toward becoming a smart nation, leading to an increased demand for efficient video analytics.

Asia Pacific: Video analytics Market Snapshot
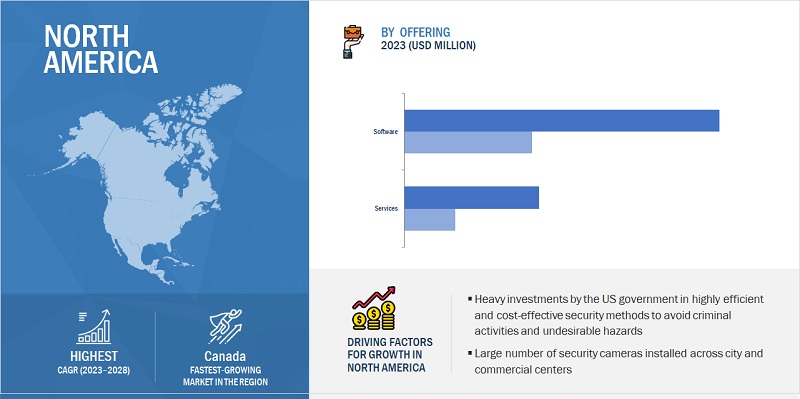
Video Analytics Market Size, and Share

Key Market Players

The major vendors in the video analytics market include Avigilon (Canada), Axis Communications (Sweden), Cisco (US), Honeywell (US), IBM (US), AllGoVision (India), Genetec (Canada), IntelliVision (US), Gorilla Technology (Taiwan), and intuVision (US).

The study includes an in-depth competitive analysis of these key players in the video analytics industry, including their company profiles and strategies. The report includes the study of key players offering video analytics software and services. 

Get online access to the report on the World's First Market Intelligence Cloud

  • Easy to Download Historical Data & Forecast Numbers
  • Company Analysis Dashboard for high growth potential opportunities
  • Research Analyst Access for customization & queries
  • Competitor Analysis with Interactive dashboard
  • Latest News, Updates & Trend analysis
Request Sample

Scope of the Report

Report Metrics

Details

Market size value in 2022

USD 7.1 billion

Revenue forecast in 2027

USD 20.3 billion

Growth Rate

23.4% CAGR

Quantitative units

Value (USD Billion)

Segments covered

By Component, Application, Deployment Model, Type, Vertical, and Region

Market Drivers

  • Increasing investments and focus of governing institutions on public safety
  • Need to utilize and examine unstructured video surveillance data in real-time

Market Opportunities

  • Use of drone-based video analytics
  • Emergence of edge technologies and devices to increase use of video analytics

Regions covered

North America, Europe, Asia Pacific, Middle East and Africa, and Latin America

Companies covered

Avigilon (Canada), Axis Communications (Sweden), Cisco (US), Honeywell (US), and IBM (US)

This research report categorizes the video analytics market to forecast revenues and analyze trends in each of the following subsegments:

By Component:
  • Software
  • Services
    • Managed Services
    • Professional Services
By Application:
  • Incident Detection
  • Intrusion Management
  • People/Crowd Counting
  • Traffic Monitoring
  • Automatic Number Plate Recognition
  • Facial Recognition
  • Other Applications
By Deployment Model:
  • Cloud
  • On-premises
By Type:
  • Server-based
  • Edge-based
By Vertical:
  • Banking, financial services, and insurance (BFSI)
  • Critical Infrastructure
  • Education
  • Hospitality & Entertainment
  • Manufacturing
  • Government & Defense
  • Retail
  • Transportation & Logistics
  • Other Verticals
By Region:
  • North America
    • United States
    • Canada
  • Europe
    • United Kingdom
    • Germany
    • France
    • Italy
    • Spain
    • Rest of Europe
  • Asia Pacific
    • China
    • Japan
    • Australia and New Zealand
    • India
    • South Korea
    • Rest of Asia Pacific
  • Middle East & Africa
    • United Arab Emirates
    • Kingdom of Saudi Arabia
    • South Africa
    • Qatar
    • Rest of Middle East & Africa
  • Latin America
    • Brazil
    • Mexico
    • Rest of Latin America

Recent Developments:

  • In May 2021, Cisco Meraki partnered with Kloudspot to help organizations offer safer and smarter workplaces for their employees and customers.
  • In April 2021, IBM acquired myInvenio, an Italian process mining software company. The acquisition provides customers with a comprehensive suite of AI-powered automation capabilities for business automation.
  • In March 2021, Honeywell signed an agreement to acquire a majority stake in Fiplex Communications to expand the in-building connectivity and communications solutions. Fiplex’s solutions have become a platform for Honeywell’s wireless technology.
  • In April 2020, Axis Communications announced the expansion of its research and development office for software development in Linköping, Sweden.
  • In March 2020, Avigilon announced the integration of video tag enterprise body-worn cameras and Avigilon Control Center (ACC) video management software. This enhances enterprise security efforts by making live body-worn audio and video that can be accessed through the ACC AI-powered platform.

Frequently Asked Questions (FAQ):

To speak to our analyst for a discussion on the above findings, click Speak to Analyst


TABLE OF CONTENTS
 
1 INTRODUCTION (Page No. - 29)
    1.1 STUDY OBJECTIVES 
    1.2 MARKET DEFINITION 
           1.2.1 INCLUSIONS AND EXCLUSIONS
    1.3 MARKET SCOPE 
           1.3.1 MARKET SEGMENTATION
           1.3.2 REGIONS COVERED
           1.3.3 YEARS CONSIDERED
    1.4 CURRENCY CONSIDERED 
           TABLE 1 UNITED STATES DOLLAR EXCHANGE RATE, 2018–2021
    1.5 STAKEHOLDERS 
    1.6 SUMMARY OF CHANGES 
 
2 RESEARCH METHODOLOGY (Page No. - 36)
    2.1 RESEARCH DATA 
           FIGURE 1 VIDEO ANALYTICS MARKET: RESEARCH DESIGN
           2.1.1 SECONDARY DATA
           2.1.2 PRIMARY DATA
                    2.1.2.1 Breakup of primary interviews
                               FIGURE 2 BREAKUP OF PRIMARY INTERVIEWS: BY COMPANY TYPE, DESIGNATION,  AND REGION
                               TABLE 2 PRIMARY PARTICIPANTS
                    2.1.2.2 Key industry insights
    2.2 DATA TRIANGULATION 
    2.3 MARKET SIZE ESTIMATION 
           FIGURE 3 VIDEO ANALYTICS MARKET: TOP-DOWN AND BOTTOM-UP APPROACHES
           FIGURE 4 MARKET SIZE ESTIMATION METHODOLOGY – APPROACH 1 (SUPPLY SIDE): REVENUE OF SOFTWARE AND SERVICES FROM VIDEO ANALYTICS VENDORS
           FIGURE 5 MARKET SIZE ESTIMATION METHODOLOGY: BOTTOM-UP APPROACH (SUPPLY SIDE): COLLECTIVE REVENUE OF VIDEO ANALYTICS VENDORS
           FIGURE 6 MARKET SIZE ESTIMATION METHODOLOGY – (SUPPLY SIDE):  CAGR PROJECTIONS FROM SUPPLY SIDE
                    FIGURE 7 MARKET SIZE ESTIMATION METHODOLOGY ? APPROACH 2 (BOTTOM-UP): REVENUE GENERATED BY VIDEO ANALYTICS VENDORS FROM EACH APPLICATION
                    FIGURE 8 MARKET SIZE ESTIMATION METHODOLOGY–APPROACH 2 (DEMAND SIDE): REVENUE GENERATED FROM DIFFERENT VERTICALS
    2.4 MARKET FORECAST 
           TABLE 3 FACTOR ANALYSIS
    2.5 RESEARCH ASSUMPTIONS 
    2.6 LIMITATIONS 
 
3 EXECUTIVE SUMMARY (Page No. - 51)
    FIGURE 9 VIDEO ANALYTICS MARKET: EVOLUTION 
    FIGURE 10 GLOBAL MARKET, 2019–2027 (USD MILLION) 
    FIGURE 11 FASTEST-GROWING SEGMENTS IN MARKET, 2022–2027 
    FIGURE 12 SOFTWARE SEGMENT TO ACCOUNT FOR LARGER MARKET SIZE DURING FORECAST PERIOD 
    FIGURE 13 ON-PREMISES SEGMENT TO DOMINATE MARKET DURING FORECAST PERIOD 
    FIGURE 14 INTRUSION MANAGEMENT ESTIMATED TO LEAD MARKET IN 2022 
    FIGURE 15 SERVER-BASED SEGMENT TO ACCOUNT FOR LARGER MARKET SIZE IN 2022 
    FIGURE 16 TOP VERTICALS IN MARKET 
    FIGURE 17 REGIONAL SNAPSHOT OF MARKET 
    4 PREMIUM INSIGHTS 
    4.1 OVERVIEW OF MARKET 
           FIGURE 18 RISING NEED FOR CITY SURVEILLANCE AND IMPLEMENTATION OF SMART CITY INITIATIVES
    4.2 VIDEO ANALYTICS MARKET, BY COMPONENT, 2022 VS. 2027 
           FIGURE 19 SOFTWARE SEGMENT TO HOLD LARGER MARKET SHARE  DURING FORECAST PERIOD
    4.3 MARKET, BY APPLICATION, 2022 VS. 2027 
           FIGURE 20 INTRUSION MANAGEMENT SEGMENT TO LEAD DURING FORECAST PERIOD
    4.4 MARKET, BY DEPLOYMENT MODEL 
           FIGURE 21 ON-PREMISES DEPLOYMENT TO ACCOUNT FOR LARGER MARKET SHARE  IN 2022
    4.5 MARKET, BY TYPE 
           FIGURE 22 SERVER-BASED SEGMENT TO HOLD LARGER MARKET SHARE IN 2022
    4.6 MARKET, BY VERTICAL, 2022–2027 
           FIGURE 23 GOVERNMENT & DEFENSE TO BE LEADING SEGMENT DURING FORECAST PERIOD
    4.7 REGIONAL SCENARIO OF MARKET, 2022–2027 
           FIGURE 24 ASIA PACIFIC TO BE SIGNIFICANT MARKET FOR INVESTMENTS
 
5 MARKET OVERVIEW AND INDUSTRY TRENDS (Page No. - 64)
    5.1 INTRODUCTION 
    5.2 MARKET DYNAMICS 
           FIGURE 25 MARKET DYNAMICS: VIDEO ANALYTICS MARKET
           5.2.1 DRIVERS
                    5.2.1.1 Increasing investments and focus of governing institutions on public safety
                    5.2.1.2 Need to utilize and examine unstructured video surveillance data in real-time
                    5.2.1.3 Significant decrease in crime rate due to surveillance cameras
                               FIGURE 26 TOP TEN COUNTRIES WITH HIGHEST CRIME RATES IN 2022
                    5.2.1.4 Growing need among enterprises to leverage BI and actionable insights for advanced operations
                               FIGURE 27 RATE OF ADOPTION OF CLOUD ANALYTICS SOLUTIONS, 2020
                    5.2.1.5 Limitations of manual video analysis
                    5.2.1.6 Government initiatives to enhance public safety infrastructure
                    5.2.1.7 Reduced cost of video surveillance equipment and long-term ROI
                    5.2.1.8 Demand for enhanced video surveillance
           5.2.2 RESTRAINTS
                    5.2.2.1 Increasing cyberattacks and data theft incidents
                               FIGURE 28 NUMBER OF CYBERATTACKS INCREASED BETWEEN 2019–2021
                    5.2.2.2 Government regulations related to CCTV surveillance
                    5.2.2.3 Investments in existing legacy surveillance systems to prevent adoption of new advanced solutions
                    5.2.2.4 Privacy concerns among citizens
                               FIGURE 29 AVERAGE TOTAL COST OF DATA BREACH BY TOP FIVE INDUSTRIES
           5.2.3 OPPORTUNITIES
                    5.2.3.1 Use of drone-based video analytics
                    5.2.3.2 Emergence of edge technologies and devices to increase use of video analytics
                    5.2.3.3 Predictive information using video analytics
                               FIGURE 30 TOP TEN USER GROUPS OF ARTIFICIAL INTELLIGENCE ACROSS ORGANIZATIONS, 2022
                    5.2.3.4 Integration of AI and cloud technologies with video analytics
                               FIGURE 31 TOP CLOUD INITIATIVES ACROSS ORGANIZATIONS, 2022
                    5.2.3.5 Surging demand for video analytics solutions in non-government sectors
                    5.2.3.6 Growing use of facial recognition across applications
           5.2.4 CHALLENGES
                    5.2.4.1 High initial cost of investment, installation, and maintenance
                    5.2.4.2 Interoperability complexities
                    5.2.4.3 Extreme functional conditions
                    5.2.4.4 Problems in isolated and remote locations
                    5.2.4.5 False alarms and lack of reliability
    5.3 CASE STUDY ANALYSIS 
           5.3.1 CASE STUDY 1: INCREASED POLICING AND INVESTIGATION EFFICIENCY
           5.3.2 CASE STUDY 2: BUSINESS INTELLIGENCE FOR RETAIL STORES
           5.3.3 CASE STUDY 3: UNIFIED SECURITY APPROACH TO ENHANCE VISITOR EXPERIENCE
           5.3.4 CASE STUDY 4: OVERCOMING SECURITY CHALLENGES IN OIL & GAS SECTOR
           5.3.5 CASE STUDY 5: ADOPTION OF VIDEO MANAGEMENT SYSTEM WITH ANALYTICS TO COLLECT REAL-TIME DATA
    5.4 SUPPLY CHAIN ANALYSIS 
           FIGURE 32 VIDEO ANALYTICS MARKET: SUPPLY CHAIN
    5.5 ECOSYSTEM 
           FIGURE 33 MARKET ECOSYSTEM
    5.6 COVID-19-DRIVEN MARKET DYNAMICS 
           5.6.1 DRIVERS & OPPORTUNITIES
           5.6.2 RESTRAINTS & CHALLENGES
    5.7 TECHNOLOGICAL ANALYSIS 
           5.7.1 ARTIFICIAL INTELLIGENCE AND MACHINE LEARNING
           5.7.2 CLOUD COMPUTING
           5.7.3 EDGE COMPUTING
           5.7.4 BIG DATA AND ANALYTICS
           5.7.5 INTERNET OF THINGS
    5.8 PRICING ANALYSIS 
           TABLE 4 PRICING ANALYSIS OF VENDORS IN MARKET
    5.9 PATENT ANALYSIS 
           FIGURE 34 NUMBER OF PATENTS PUBLISHED, 2011–2021
           FIGURE 35 TOP FIVE PATENT OWNERS (GLOBAL)
           TABLE 5 TOP TEN PATENT APPLICANTS (US)
           TABLE 6 VIDEO ANALYTICS MARKET - PATENTS GRANTED TO VIDEO ANALYTICS SOLUTION PROVIDERS
    5.10 PORTER’S FIVE FORCES ANALYSIS 
           FIGURE 36 MARKET: PORTER’S FIVE FORCES ANALYSIS
           TABLE 7 MARKET: PORTER’S FIVE FORCES ANALYSIS
           5.10.1 DEGREE OF COMPETITION
           5.10.2 BARGAINING POWER OF SUPPLIERS
           5.10.3 BARGAINING POWER OF BUYERS
           5.10.4  THREAT OF NEW ENTRANTS
           5.10.5 THREAT OF SUBSTITUTES
    5.11 KEY CONFERENCES AND EVENTS IN 2022–2023 
                    TABLE 8 MARKET: KEY CONFERENCES AND EVENTS
    5.12 TRENDS/DISRUPTIONS IMPACTING BUYERS 
                    FIGURE 37 VIDEO ANALYTICS MARKET: TRENDS/DISRUPTIONS IMPACTING BUYERS
    5.13 KEY STAKEHOLDERS AND BUYING CRITERIA 
           5.13.1 KEY STAKEHOLDERS IN BUYING PROCESS
                    FIGURE 38 INFLUENCE OF STAKEHOLDERS IN BUYING PROCESS FOR END USERS
                    TABLE 9 INFLUENCE OF STAKEHOLDERS IN BUYING PROCESS FOR END USERS (%)
           5.13.2 BUYING CRITERIA
                    FIGURE 39 KEY BUYING CRITERIA FOR END USERS
                    TABLE 10 KEY BUYING CRITERIA FOR END USERS
    5.14 TARIFF AND REGULATORY LANDSCAPE 
           5.14.1 REGULATORY BODIES, GOVERNMENT AGENCIES, AND OTHER ORGANIZATIONS
                    TABLE 11 NORTH AMERICA: LIST OF REGULATORY BODIES, GOVERNMENT AGENCIES, AND OTHER ORGANIZATIONS
                    TABLE 12 EUROPE: LIST OF REGULATORY BODIES, GOVERNMENT AGENCIES, AND OTHER ORGANIZATIONS
                    TABLE 13 ASIA PACIFIC: LIST OF REGULATORY BODIES, GOVERNMENT AGENCIES, AND OTHER ORGANIZATIONS
                    TABLE 14 REST OF THE WORLD: LIST OF REGULATORY BODIES, GOVERNMENT AGENCIES, AND OTHER ORGANIZATIONS
           5.14.2 REGULATIONS
 
6 VIDEO ANALYTICS MARKET, BY COMPONENT (Page No. - 101)
    6.1 INTRODUCTION 
           6.1.1 COMPONENT: MARKET DRIVERS
           6.1.2 COMPONENT: IMPACT OF COVID-19
                    FIGURE 40 SERVICES SEGMENT EXPECTED TO GROW AT HIGHER  CAGR DURING FORECAST PERIOD
                    TABLE 15 MARKET, BY COMPONENT, 2018–2021 (USD MILLION)
                    TABLE 16 MARKET, BY COMPONENT, 2022–2027 (USD MILLION)
    6.2 SOFTWARE 
           TABLE 17 SOFTWARE: MARKET, BY REGION, 2018–2021 (USD MILLION)
           TABLE 18 SOFTWARE: MARKET, BY REGION, 2022–2027 (USD MILLION)
    6.3 SERVICES 
           TABLE 19 SERVICES: MARKET, BY REGION, 2018–2021 (USD MILLION)
           TABLE 20 SERVICES: MARKET, BY REGION, 2022–2027 (USD MILLION)
           6.3.1 PROFESSIONAL SERVICES
           6.3.2 MANAGED SERVICES
 
7 VIDEO ANALYTICS MARKET, BY APPLICATION (Page No. - 107)
    7.1 INTRODUCTION 
           7.1.1 APPLICATION: MARKET DRIVERS
           7.1.2 APPLICATION: IMPACT OF COVID-19
                    FIGURE 41 FACIAL RECOGNITION SEGMENT EXPECTED TO GROW AT HIGHEST CAGR DURING FORECAST PERIOD
                    TABLE 21 MARKET, BY APPLICATION, 2018–2021 (USD MILLION)
                    TABLE 22 MARKET, BY APPLICATION, 2022–2027 (USD MILLION)
    7.2 INCIDENT DETECTION 
           TABLE 23 INCIDENT DETECTION: MARKET, BY REGION,  2018–2021 (USD MILLION)
           TABLE 24 INCIDENT DETECTION: MARKET, BY REGION,  2022–2027 (USD MILLION)
    7.3 INTRUSION MANAGEMENT 
           TABLE 25 INTRUSION MANAGEMENT: MARKET, BY REGION,  2018–2021 (USD MILLION)
           TABLE 26 INTRUSION MANAGEMENT: MARKET, BY REGION,  2022–2027 (USD MILLION)
    7.4 PEOPLE/CROWD COUNTING 
           TABLE 27 PEOPLE/CROWD COUNTING: VIDEO ANALYTICS MARKET, BY REGION,  2018–2021 (USD MILLION)
           TABLE 28 PEOPLE/CROWD COUNTING: MARKET, BY REGION,  2022–2027 (USD MILLION)
    7.5 TRAFFIC MONITORING 
           TABLE 29 TRAFFIC MONITORING: MARKET, BY REGION,  2018–2021 (USD MILLION)
           TABLE 30 TRAFFIC MONITORING: MARKET, BY REGION,  2022–2027 (USD MILLION)
    7.6 AUTOMATIC NUMBER PLATE RECOGNITION 
           TABLE 31 AUTOMATIC NUMBER PLATE RECOGNITION: MARKET, BY REGION, 2018–2021 (USD MILLION)
           TABLE 32 AUTOMATIC NUMBER PLATE RECOGNITION: MARKET, BY REGION, 2022–2027 (USD MILLION)
    7.7 FACIAL RECOGNITION 
           TABLE 33 FACIAL RECOGNITION: MARKET, BY REGION,  2018–2021 (USD MILLION)
           TABLE 34 FACIAL RECOGNITION: MARKET, BY REGION,  2022–2027 (USD MILLION)
    7.8 OTHER APPLICATIONS 
           TABLE 35 OTHER APPLICATIONS: MARKET, BY REGION,  2018–2021 (USD MILLION)
           TABLE 36 OTHER APPLICATIONS: MARKET, BY REGION,  2022–2027 (USD MILLION)
 
8 VIDEO ANALYTICS MARKET, BY DEPLOYMENT MODEL (Page No. - 119)
    8.1 INTRODUCTION 
           8.1.1 DEPLOYMENT MODEL: MARKET DRIVERS
           8.1.2 DEPLOYMENT MODEL: IMPACT OF COVID-19
                    FIGURE 42 CLOUD SEGMENT EXPECTED TO GROW AT HIGHER CAGR DURING  FORECAST PERIOD
                    TABLE 37 MARKET, BY DEPLOYMENT MODEL, 2018–2021 (USD MILLION)
                    TABLE 38 MARKET, BY DEPLOYMENT MODEL, 2022–2027 (USD MILLION)
    8.2 ON-PREMISES 
           TABLE 39 ON-PREMISES: MARKET, BY REGION, 2018–2021 (USD MILLION)
    8.3 CLOUD 
           TABLE 41 CLOUD: MARKET, BY REGION, 2018–2021 (USD MILLION)
           TABLE 42 CLOUD: MARKET, BY REGION, 2022–2027 (USD MILLION)
 
9 VIDEO ANALYTICS MARKET, BY TYPE (Page No. - 124)
    9.1 INTRODUCTION 
           9.1.1 TYPE: MARKET DRIVERS
           9.1.2 TYPE: IMPACT OF COVID-19
                    FIGURE 43 EDGE-BASED SEGMENT TO GROW AT HIGHER CAGR DURING FORECAST PERIOD
                    TABLE 43 MARKET, BY TYPE, 2018–2021 (USD MILLION)
                    TABLE 44 MARKET, BY TYPE, 2022–2027 (USD MILLION)
    9.2 SERVER-BASED 
           FIGURE 44 SERVER-BASED IMPLEMENTATION
           TABLE 45 SERVER-BASED: MARKET, BY REGION, 2018–2021 (USD MILLION)
           TABLE 46 SERVER-BASED: MARKET, BY REGION, 2022–2027 (USD MILLION)
    9.3 EDGE-BASED 
           FIGURE 45 EDGE-BASED IMPLEMENTATION
           TABLE 47 EDGE-BASED: MARKET, BY REGION, 2018–2021 (USD MILLION)
           TABLE 48 EDGE-BASED: MARKET, BY REGION, 2022–2027 (USD MILLION)
 
10 VIDEO ANALYTICS MARKET, BY END USER (Page No. - 130)
     10.1 INTRODUCTION 
             10.1.1 END USERS: MARKET DRIVERS
             10.1.2 END USER: COVID-19 IMPACT
                       FIGURE 46 SMALL AND MEDIUM-SIZED ENTERPRISES SEGMENT TO GROW AT HIGHER CAGR DURING FORECAST PERIOD
                       TABLE 49 MARKET, BY END USER, 2018–2021 (USD MILLION)
                       TABLE 50 MARKET, BY END USER, 2022–2027 (USD MILLION)
     10.2 LARGE ENTERPRISES 
               TABLE 51 LARGE ENTERPRISES: MARKET, BY REGION,  2018–2021 (USD MILLION)
               TABLE 52 LARGE ENTERPRISES: MARKET, BY REGION,  2022–2027 (USD MILLION)
     10.3 SMALL AND MEDIUM-SIZED ENTERPRISES 
               TABLE 53 SMALL AND MEDIUM-SIZED ENTERPRISES: MARKET, BY REGION, 2018–2021 (USD MILLION)
               TABLE 54 SMALL AND MEDIUM-SIZED ENTERPRISES: MARKET, BY REGION, 2022–2027 (USD MILLION)
 
11 VIDEO ANALYTICS MARKET, BY VERTICAL (Page No. - 135)
     11.1 INTRODUCTION 
             11.1.1 VERTICAL: MARKET DRIVERS
             11.1.2 VERTICAL: IMPACT OF COVID-19
                       FIGURE 47 TRANSPORTATION & LOGISTICS SEGMENT TO GROW AT HIGHEST CAGR DURING FORECAST PERIOD
                       TABLE 55 MARKET, BY VERTICAL, 2018–2021 (USD MILLION)
                       TABLE 56 MARKET, BY VERTICAL, 2022–2027 (USD MILLION)
     11.2 BANKING, FINANCIAL SERVICES AND INSURANCE (BFSI) 
               TABLE 57 BFSI: VIDEO ANALYTICS MARKET SIZE, BY REGION, 2018–2021 (USD MILLION)
               TABLE 58 BFSI: MARKET SIZE, BY REGION, 2022–2027 (USD MILLION)
     11.3 CRITICAL INFRASTRUCTURE 
               TABLE 59 CRITICAL INFRASTRUCTURE: MARKET, BY REGION,  2018–2021 (USD MILLION)
               TABLE 60 CRITICAL INFRASTRUCTURE: MARKET, BY REGION,  2022–2027 (USD MILLION)
     11.4 EDUCATION 
               TABLE 61 EDUCATION: MARKET, BY REGION, 2018–2021 (USD MILLION)
               TABLE 62 EDUCATION: MARKET, BY REGION, 2022–2027 (USD MILLION)
     11.5 HOSPITALITY & ENTERTAINMENT 
               TABLE 63 HOSPITALITY & ENTERTAINMENT: MARKET, BY REGION,  2018–2021 (USD MILLION)
               TABLE 64 HOSPITALITY & ENTERTAINMENT: MARKET, BY REGION,  2022–2027 (USD MILLION)
     11.6 MANUFACTURING 
               TABLE 65 MANUFACTURING: VIDEO ANALYTICS MARKET, BY REGION, 2018–2021 (USD MILLION)
               TABLE 66 MANUFACTURING: MARKET, BY REGION, 2022–2027 (USD MILLION)
     11.7 GOVERNMENT & DEFENSE 
               TABLE 67 GOVERNMENT & DEFENSE: MARKET, BY REGION,  2018–2021 (USD MILLION)
               TABLE 68 GOVERNMENT & DEFENSE: MARKET, BY REGION,  2022–2027 (USD MILLION)
     11.8 RETAIL 
               TABLE 69 RETAIL: MARKET, BY REGION, 2018–2021 (USD MILLION)
               TABLE 70 RETAIL: MARKET, BY REGION, 2022–2027 (USD MILLION)
     11.9 TRANSPORTATION & LOGISTICS 
               TABLE 71 TRANSPORTATION & LOGISTICS: MARKET, BY REGION, 2018–2021 (USD MILLION)
               TABLE 72 TRANSPORTATION & LOGISTICS: MARKET, BY REGION,  2022–2027 (USD MILLION)
     11.10 OTHER VERTICALS 
               TABLE 73 OTHER VERTICALS: MARKET, BY REGION, 2018–2021 (USD MILLION)
               TABLE 74 OTHER VERTICALS: MARKET, BY REGION, 2022–2027 (USD MILLION)
 
12 VIDEO ANALYTICS MARKET, BY REGION (Page No. - 153)
     12.1 INTRODUCTION 
             12.1.1 MARKET: IMPACT OF COVID-19
                       FIGURE 48 NORTH AMERICA TO LEAD MARKET FROM  2022 TO 2027
                       FIGURE 49 ASIA PACIFIC MARKET TO GROW AT HIGHEST CAGR DURING FORECAST PERIOD
                       TABLE 75 MARKET, BY REGION, 2018–2021 (USD MILLION)
                       TABLE 76 MARKET, BY REGION, 2022–2027 (USD MILLION)
     12.2 NORTH AMERICA 
               TABLE 77 NORTH AMERICA: PESTLE ANALYSIS
                                   12.2.1 NORTH AMERICA: MARKET DRIVERS
                                   FIGURE 50 NORTH AMERICA: MARKET SNAPSHOT
                                   TABLE 78 NORTH AMERICA: VIDEO ANALYTICS MARKET, BY COMPONENT,  2018–2021 (USD MILLION)
                                   TABLE 79 NORTH AMERICA: MARKET, BY COMPONENT,  2022–2027 (USD MILLION)
                                   TABLE 80 NORTH AMERICA: MARKET, BY APPLICATION,  2018–2021 (USD MILLION)
                                   TABLE 81 NORTH AMERICA: MARKET, BY APPLICATION,  2022–2027 (USD MILLION)
                                   TABLE 82 NORTH AMERICA: MARKET, BY TYPE, 2018–2021 (USD MILLION)
                                   TABLE 83 NORTH AMERICA: MARKET, BY TYPE, 2022–2027 (USD MILLION)
                                   TABLE 84 NORTH AMERICA: MARKET, BY DEPLOYMENT MODEL,  2018–2021 (USD MILLION)
                                   TABLE 85 NORTH AMERICA: MARKET, BY DEPLOYMENT MODEL,  2022–2027 (USD MILLION)
                                   TABLE 86 NORTH AMERICA: MARKET, BY VERTICAL, 2018–2021 (USD MILLION)
                                   TABLE 87 NORTH AMERICA: MARKET, BY VERTICAL, 2022–2027 (USD MILLION)
                                   TABLE 88 NORTH AMERICA: MARKET, BY COUNTRY, 2018–2021 (USD MILLION)
                                   TABLE 89 NORTH AMERICA: MARKET, BY COUNTRY, 2022–2027 (USD MILLION)
             12.2.2 US
                       TABLE 90 US: VIDEO ANALYTICS MARKET, BY COMPONENT,  2018–2021 (USD MILLION)
                       TABLE 91 US: MARKET, BY COMPONENT,  2022–2027 (USD MILLION)
                       TABLE 92 US: MARKET, BY DEPLOYMENT MODEL,  2018–2021 (USD MILLION)
                       TABLE 93 US: MARKET, BY DEPLOYMENT MODEL, 2022–2027 (USD MILLION)
             12.2.3 CANADA
                       TABLE 94 CANADA: MARKET, BY COMPONENT, 2018–2021 (USD MILLION)
                       TABLE 95 CANADA: MARKET, BY COMPONENT, 2022–2027 (USD MILLION)
                       TABLE 96 CANADA: MARKET, BY DEPLOYMENT MODEL, 2018–2021 (USD MILLION)
                       TABLE 97 CANADA: MARKET, BY DEPLOYMENT MODEL,  2022–2027 (USD MILLION)
     12.3 EUROPE 
               TABLE 98 EUROPE: PESTLE ANALYSIS
             12.3.1 EUROPE: MARKET DRIVERS
                       FIGURE 51 EUROPE: MARKET SNAPSHOT
                       TABLE 99 EUROPE: VIDEO ANALYTICS MARKET, BY COMPONENT, 2018–2021 (USD MILLION)
                       TABLE 100 EUROPE: MARKET, BY COMPONENT, 2022–2027 (USD MILLION)
                       TABLE 101 EUROPE: MARKET, BY APPLICATION, 2018–2021 (USD MILLION)
                       TABLE 102 EUROPE: MARKET, BY APPLICATION, 2022–2027 (USD MILLION)
                       TABLE 103 EUROPE: MARKET, BY TYPE, 2018–2021 (USD MILLION)
                       TABLE 104 EUROPE: MARKET, BY TYPE, 2022–2027 (USD MILLION)
                       TABLE 105 EUROPE: MARKET, BY DEPLOYMENT MODEL,  2018–2021 (USD MILLION)
                       TABLE 106 EUROPE: MARKET, BY DEPLOYMENT MODEL,  2022–2027 (USD MILLION)
                       TABLE 107 EUROPE: MARKET, BY VERTICAL, 2018–2021 (USD MILLION)
                       TABLE 108 EUROPE: MARKET, BY VERTICAL, 2022–2027 (USD MILLION)
                       TABLE 109 EUROPE: MARKET, BY COUNTRY, 2018–2021 (USD MILLION)
                       TABLE 110 EUROPE: MARKET, BY COUNTRY, 2022–2027 (USD MILLION)
             12.3.2 UK
                       TABLE 111 UK: VIDEO ANALYTICS MARKET, BY COMPONENT,  2018–2021 (USD MILLION)
                       TABLE 112 UK: MARKET, BY COMPONENT,  2022–2027 (USD MILLION)
                       TABLE 113 UK: MARKET, BY DEPLOYMENT MODEL,  2018–2021 (USD MILLION)
                       TABLE 114 UK: MARKET, BY DEPLOYMENT MODEL,  2022–2027 (USD MILLION)
             12.3.3 GERMANY
                       TABLE 115 GERMANY: MARKET, BY COMPONENT, 2018–2021 (USD MILLION)
                       TABLE 116 GERMANY: MARKET, BY COMPONENT, 2022–2027 (USD MILLION)
                       TABLE 117 GERMANY: MARKET, BY DEPLOYMENT MODEL, 2018–2021 (USD MILLION)
                       TABLE 118 GERMANY: MARKET, BY DEPLOYMENT MODEL,  2022–2027 (USD MILLION)
             12.3.4 FRANCE
                       TABLE 119 FRANCE: VIDEO ANALYTICS MARKET, BY COMPONENT, 2018–2021 (USD MILLION)
                       TABLE 120 FRANCE: MARKET, BY COMPONENT, 2022–2027 (USD MILLION)
                       TABLE 121 FRANCE: MARKET, BY DEPLOYMENT MODEL,  2018–2021 (USD MILLION)
                       TABLE 122 FRANCE: MARKET, BY DEPLOYMENT MODEL,  2022–2027 (USD MILLION)
             12.3.5 ITALY
                       TABLE 123 ITALY: MARKET, BY COMPONENT, 2018–2021 (USD MILLION)
                       TABLE 124 ITALY: MARKET, BY COMPONENT, 2022–2027 (USD MILLION)
                       TABLE 125 ITALY: MARKET, BY DEPLOYMENT MODEL, 2018–2021 (USD MILLION)
                       TABLE 126 ITALY: MARKET, BY DEPLOYMENT MODEL, 2022–2027 (USD MILLION)
             12.3.6 SPAIN
                       TABLE 127 SPAIN: MARKET, BY COMPONENT, 2018–2021 (USD MILLION)
                       TABLE 128 SPAIN: MARKET, BY COMPONENT, 2022–2027 (USD MILLION)
                       TABLE 129 SPAIN: MARKET, BY DEPLOYMENT MODEL, 2018–2021 (USD MILLION)
                       TABLE 130 SPAIN: MARKET, BY DEPLOYMENT MODEL, 2022–2027 (USD MILLION)
             12.3.7 REST OF EUROPE
                       TABLE 131 REST OF EUROPE: MARKET, BY COMPONENT,  2018–2021 (USD MILLION)
                       TABLE 132 REST OF EUROPE: MARKET, BY COMPONENT,  2022–2027 (USD MILLION)
                       TABLE 133 REST OF EUROPE: MARKET, BY DEPLOYMENT MODEL,  2018–2021 (USD MILLION)
                       TABLE 134 REST OF EUROPE: MARKET, BY DEPLOYMENT MODEL,  2022–2027 (USD MILLION)
     12.4 ASIA PACIFIC 
               TABLE 135 ASIA PACIFIC: PESTLE ANALYSIS
             12.4.1 ASIA PACIFIC: MARKET DRIVERS
                                   FIGURE 52 ASIA PACIFIC: VIDEO ANALYTICS MARKET SNAPSHOT
                                   TABLE 136 ASIA PACIFIC: MARKET, BY COMPONENT, 2018–2021 (USD MILLION)
                                   TABLE 137 ASIA PACIFIC: MARKET, BY COMPONENT, 2022–2027 (USD MILLION)
                                   TABLE 138 ASIA PACIFIC: MARKET, BY APPLICATION, 2018–2021 (USD MILLION)
                                   TABLE 139 ASIA PACIFIC: MARKET, BY APPLICATION, 2022–2027 (USD MILLION)
                                   TABLE 140 ASIA PACIFIC: MARKET, BY TYPE, 2018–2021 (USD MILLION)
                                   TABLE 141 ASIA PACIFIC: MARKET, BY TYPE, 2022–2027 (USD MILLION)
                                   TABLE 142 ASIA PACIFIC: MARKET, BY DEPLOYMENT MODEL,  2018–2021 (USD MILLION)
                                   TABLE 143 ASIA PACIFIC: MARKET, BY DEPLOYMENT MODEL,  2022–2027 (USD MILLION)
                                   TABLE 144 ASIA PACIFIC: MARKET, BY VERTICAL, 2018–2021 (USD MILLION)
                                   TABLE 145 ASIA PACIFIC: MARKET, BY VERTICAL, 2022–2027 (USD MILLION)
                                   TABLE 146 ASIA PACIFIC: MARKET, BY COUNTRY, 2018–2021 (USD MILLION)
                                   TABLE 147 ASIA PACIFIC: MARKET, BY COUNTRY, 2022–2027 (USD MILLION)
             12.4.2 CHINA
                       TABLE 148 CHINA: VIDEO ANALYTICS MARKET, BY COMPONENT, 2018–2021 (USD MILLION)
                       TABLE 149 CHINA: MARKET, BY COMPONENT, 2022–2027 (USD MILLION)
                       TABLE 150 CHINA: MARKET, BY DEPLOYMENT MODEL, 2018–2021 (USD MILLION)
                       TABLE 151 CHINA: MARKET, BY DEPLOYMENT MODEL, 2022–2027 (USD MILLION)
             12.4.3 JAPAN
                       TABLE 152 JAPAN: MARKET, BY COMPONENT, 2018–2021 (USD MILLION)
                       TABLE 153 JAPAN: MARKET, BY COMPONENT, 2022–2027 (USD MILLION)
                       TABLE 154 JAPAN: MARKET, BY DEPLOYMENT MODEL, 2018–2021 (USD MILLION)
            TABLE 155 JAPAN: MARKET, BY DEPLOYMENT MODEL, 2022–2027 (USD MILLION)
             12.4.4 AUSTRALIA & NEW ZEALAND
                       TABLE 156 AUSTRALIA & NEW ZEALAND: MARKET, BY COMPONENT,  2018–2021 (USD MILLION)
                       TABLE 157 AUSTRALIA & NEW ZEALAND: MARKET, BY COMPONENT,  2022–2027 (USD MILLION)
                       TABLE 158 AUSTRALIA & NEW ZEALAND: MARKET, BY DEPLOYMENT MODEL, 2018–2021 (USD MILLION)
                       TABLE 159 AUSTRALIA & NEW ZEALAND: MARKET, BY DEPLOYMENT MODEL, 2022–2027 (USD MILLION)
             12.4.5 INDIA
                       TABLE 160 INDIA: VIDEO ANALYTICS MARKET, BY COMPONENT, 2018–2021 (USD MILLION)
                       TABLE 161 INDIA: MARKET, BY COMPONENT, 2022–2027 (USD MILLION)
                       TABLE 162 INDIA: MARKET, BY DEPLOYMENT MODEL, 2018–2021 (USD MILLION)
                       TABLE 163 INDIA: MARKET, BY DEPLOYMENT MODEL, 2022–2027 (USD MILLION)
             12.4.6 SOUTH KOREA
                       TABLE 164 SOUTH KOREA: MARKET, BY COMPONENT, 2018–2021 (USD MILLION)
                       TABLE 165 SOUTH KOREA: MARKET, BY COMPONENT, 2022–2027 (USD MILLION)
                       TABLE 166 SOUTH KOREA: MARKET, BY DEPLOYMENT MODEL,  2018–2021 (USD MILLION)
                       TABLE 167 SOUTH KOREA: MARKET, BY DEPLOYMENT MODEL,  2022–2027 (USD MILLION)
             12.4.7 REST OF ASIA PACIFIC
                       TABLE 168 REST OF ASIA PACIFIC: MARKET, BY COMPONENT,  2018–2021 (USD MILLION)
                       TABLE 169 REST OF ASIA PACIFIC: MARKET, BY COMPONENT,  2022–2027 (USD MILLION)
                       TABLE 170 REST OF ASIA PACIFIC: MARKET, BY DEPLOYMENT MODEL,  2018–2021 (USD MILLION)
                       TABLE 171 REST OF ASIA PACIFIC: MARKET, BY DEPLOYMENT MODEL,  2022–2027 (USD MILLION)
     12.5 MIDDLE EAST & AFRICA 
               TABLE 172 MIDDLE EAST & AFRICA: PESTLE ANALYSIS
             12.5.1 MIDDLE EAST & AFRICA: MARKET DRIVERS
                       FIGURE 53 MIDDLE EAST & AFRICA: VIDEO ANALYTICS MARKET SNAPSHOT
                       TABLE 173 MIDDLE EAST & AFRICA: MARKET, BY COMPONENT,  2018–2021 (USD MILLION)
                       TABLE 174 MIDDLE EAST & AFRICA: MARKET, BY COMPONENT,  2022–2027 (USD MILLION)
                       TABLE 175 MIDDLE EAST & AFRICA: MARKET, BY APPLICATION, 2018–2021 (USD MILLION)
                       TABLE 176 MIDDLE EAST & AFRICA: MARKET, BY APPLICATION,  2022–2027 (USD MILLION)
                       TABLE 177 MIDDLE EAST & AFRICA: MARKET, BY TYPE,  2018–2021 (USD MILLION)
                       TABLE 178 MIDDLE EAST & AFRICA: MARKET, BY TYPE,  2022–2027 (USD MILLION)
                       TABLE 179 MIDDLE EAST & AFRICA: MARKET, BY DEPLOYMENT MODEL,  2018–2021 (USD MILLION)
                       TABLE 180 MIDDLE EAST & AFRICA: MARKET, BY DEPLOYMENT MODEL,  2022–2027 (USD MILLION)
                       TABLE 181 MIDDLE EAST & AFRICA: MARKET, BY VERTICAL,  2018–2021 (USD MILLION)
                       TABLE 182 MIDDLE EAST & AFRICA: MARKET, BY VERTICAL,  2022–2027 (USD MILLION)
                       TABLE 183 MIDDLE EAST & AFRICA: MARKET, BY COUNTRY,  2018–2021 (USD MILLION)
                       TABLE 184 MIDDLE EAST & AFRICA: MARKET, BY COUNTRY,  2022–2027 (USD MILLION)
             12.5.2 SAUDI ARABIA
                       TABLE 185 SAUDI ARABIA: MARKET, BY COMPONENT, 2018–2021 (USD MILLION)
                       TABLE 186 SAUDI ARABIA: MARKET, BY COMPONENT,  2022–2027 (USD MILLION)
                       TABLE 187 SAUDI ARABIA: MARKET, BY DEPLOYMENT MODEL, 2018–2021 (USD MILLION)
                       TABLE 188 SAUDI ARABIA: MARKET, BY DEPLOYMENT MODEL, 2022–2027 (USD MILLION)
             12.5.3 UAE
                       TABLE 189 UAE: VIDEO ANALYTICS MARKET, BY COMPONENT,  2018–2021 (USD MILLION)
                       TABLE 190 UAE: MARKET, BY COMPONENT,  2022–2027 (USD MILLION)
                       TABLE 191 UAE: MARKET, BY DEPLOYMENT MODEL, 2018–2021 (USD MILLION)
                       TABLE 192 UAE: MARKET, BY DEPLOYMENT MODEL,  2022–2027 (USD MILLION)
             12.5.4 SOUTH AFRICA
                       TABLE 193 SOUTH AFRICA: MARKET, BY COMPONENT, 2018–2021 (USD MILLION)
                       TABLE 194 SOUTH AFRICA: MARKET, BY COMPONENT, 2022–2027 (USD MILLION)
                       TABLE 195 SOUTH AFRICA: MARKET, BY DEPLOYMENT MODEL,  2018–2021 (USD MILLION)
                       TABLE 196 SOUTH AFRICA: MARKET, BY DEPLOYMENT MODEL,  2022–2027 (USD MILLION)
             12.5.5 QATAR
                       TABLE 197 QATAR: VIDEO ANALYTICS MARKET, BY COMPONENT, 2018–2021 (USD MILLION)
                       TABLE 198 QATAR: MARKET, BY COMPONENT, 2022–2027 (USD MILLION)
                       TABLE 199 QATAR: MARKET, BY DEPLOYMENT MODEL, 2018–2021 (USD MILLION)
                       TABLE 200 QATAR: MARKET, BY DEPLOYMENT MODEL, 2022–2027 (USD MILLION)
             12.5.6 REST OF MIDDLE EAST & AFRICA
                       TABLE 201 REST OF MIDDLE EAST & AFRICA: MARKET, BY COMPONENT,  2018–2021 (USD MILLION)
                       TABLE 202 REST OF MIDDLE EAST & AFRICA: MARKET, BY COMPONENT,  2022–2027 (USD MILLION)
                       TABLE 203 REST OF MIDDLE EAST & AFRICA: MARKET, BY DEPLOYMENT MODEL, 2018–2021 (USD MILLION)
                       TABLE 204 REST OF MIDDLE EAST & AFRICA: MARKET, BY DEPLOYMENT MODEL, 2022–2027 (USD MILLION)
     12.6 LATIN AMERICA 
               TABLE 205 LATIN AMERICA: PESTLE ANALYSIS
             12.6.1 LATIN AMERICA: VIDEO ANALYTICS MARKET DRIVERS
                       FIGURE 54 LATIN AMERICA: MARKET SNAPSHOT
                       TABLE 206 LATIN AMERICA: MARKET, BY COMPONENT,  2018–2021 (USD MILLION)
                       TABLE 207 LATIN AMERICA: MARKET, BY COMPONENT,  2022–2027 (USD MILLION)
                       TABLE 208 LATIN AMERICA: MARKET, BY APPLICATION,  2018–2021 (USD MILLION)
                       TABLE 209 LATIN AMERICA: MARKET, BY APPLICATION,  2022–2027 (USD MILLION)
                       TABLE 210 LATIN AMERICA: MARKET, BY TYPE, 2018–2021 (USD MILLION)
                       TABLE 211 LATIN AMERICA: MARKET, BY TYPE, 2022–2027 (USD MILLION)
                       TABLE 212 LATIN AMERICA: MARKET, BY DEPLOYMENT MODEL,  2018–2021 (USD MILLION)
                       TABLE 213 LATIN AMERICA: MARKET, BY DEPLOYMENT MODEL,  2022–2027 (USD MILLION)
                       TABLE 214 LATIN AMERICA: MARKET, BY VERTICAL, 2018–2021 (USD MILLION)
                       TABLE 215 LATIN AMERICA: MARKET, BY VERTICAL, 2022–2027 (USD MILLION)
                       TABLE 216 LATIN AMERICA: MARKET, BY COUNTRY, 2018–2021 (USD MILLION)
                       TABLE 217 LATIN AMERICA: MARKET, BY COUNTRY, 2022–2027 (USD MILLION)
             12.6.2 BRAZIL
                       TABLE 218 BRAZIL: VIDEO ANALYTICS MARKET, BY COMPONENT, 2018–2021 (USD MILLION)
                       TABLE 219 BRAZIL: MARKET, BY COMPONENT, 2022–2027 (USD MILLION)
                       TABLE 220 BRAZIL: MARKET, BY DEPLOYMENT MODEL,  2018–2021 (USD MILLION)
                       TABLE 221 BRAZIL: MARKET, BY DEPLOYMENT MODEL,  2022–2027 (USD MILLION)
             12.6.3 MEXICO
                       TABLE 222 MEXICO: MARKET, BY COMPONENT, 2018–2021 (USD MILLION)
                       TABLE 223 MEXICO: MARKET, BY COMPONENT, 2022–2027 (USD MILLION)
                       TABLE 224 MEXICO: MARKET, BY DEPLOYMENT MODEL,  2018–2021 (USD MILLION)
                       TABLE 225 MEXICO: MARKET, BY DEPLOYMENT MODEL,  2022–2027 (USD MILLION)
             12.6.4 REST OF LATIN AMERICA
                       TABLE 226 REST OF LATIN AMERICA: MARKET, BY COMPONENT,  2018–2021 (USD MILLION)
                       TABLE 227 REST OF LATIN AMERICA: MARKET, BY COMPONENT,  2022–2027 (USD MILLION)
                       TABLE 228 REST OF LATIN AMERICA: MARKET, BY DEPLOYMENT MODEL,  2018–2021 (USD MILLION)
                       TABLE 229 REST OF LATIN AMERICA: MARKET, BY DEPLOYMENT MODEL,  2022–2027 (USD MILLION)
 
13 COMPETITIVE LANDSCAPE (Page No. - 219)
     13.1 OVERVIEW 
     13.2 MARKET EVALUATION FRAMEWORK 
               FIGURE 55 MARKET EVALUATION FRAMEWORK, 2019–2021
     13.3 KEY PLAYER STRATEGIES/RIGHT TO WIN 
               TABLE 230 OVERVIEW OF STRATEGIES ADOPTED BY KEY VIDEO ANALYTICS VENDORS
     13.4 REVENUE ANALYSIS 
               FIGURE 56 HISTORICAL THREE-YEAR REVENUE ANALYSIS OF LEADING PLAYERS, 2019–2021 (USD BILLION)
     13.5 MARKET SHARE ANALYSIS 
               FIGURE 57 VIDEO ANALYTICS MARKET: MARKET SHARE ANALYSIS, 2021
               TABLE 231 MARKET: DEGREE OF COMPETITION
     13.6 COMPANY EVALUATION QUADRANT 
               TABLE 232 COMPANY EVALUATION QUADRANT: CRITERIA
             13.6.1 STARS
             13.6.2 EMERGING LEADERS
             13.6.3 PERVASIVE PLAYERS
             13.6.4 PARTICIPANTS
                       FIGURE 58 MARKET, KEY COMPANY EVALUATION MATRIX, 2022
             13.6.5 COMPANY PRODUCT FOOTPRINT ANALYSIS
                       TABLE 233 COMPANY PRODUCT FOOTPRINT
                       TABLE 234 COMPANY COMPONENT FOOTPRINT
                       TABLE 235 COMPANY VERTICAL FOOTPRINT
                       TABLE 236 COMPANY REGION FOOTPRINT
     13.7 RANKING OF KEY PLAYERS 
               FIGURE 59 RANKING OF KEY PLAYERS IN MARKET, 2021
     13.8 STARTUP/SME EVALUATION MATRIX 
               FIGURE 60 STARTUP/SME EVALUATION MATRIX: CRITERIA WEIGHTAGE
             13.8.1 PROGRESSIVE COMPANIES
             13.8.2 RESPONSIVE COMPANIES
             13.8.3 DYNAMIC COMPANIES
             13.8.4 STARTING BLOCKS
                       FIGURE 61 MARKET (GLOBAL)  STARTUP/SME COMPANY EVALUATION MATRIX, 2022
             13.8.5 COMPETITIVE BENCHMARKING
                       TABLE 237 MARKET: DETAILED LIST OF KEY STARTUPS/SMES
                       TABLE 238 VIDEO ANALYTICS MARKET: COMPETITIVE BENCHMARKING OF KEY PLAYERS (STARTUPS/SMES)
     13.9 KEY MARKET DEVELOPMENTS 
             13.9.1 PRODUCT LAUNCHES AND ENHANCEMENTS
                       TABLE 239 PRODUCT LAUNCHES AND ENHANCEMENTS, 2019–2021
             13.9.2 DEALS
                       TABLE 240 DEALS, 2019–2022
             13.9.3 OTHERS
                       TABLE 241 OTHERS, 2020–2021
 
14 COMPANY PROFILES (Page No. - 241)
     14.1 INTRODUCTION 
     14.2 KEY PLAYERS 
(Business Overview, Products, Solutions & Services offered, Recent Developments, MnM View)*
             14.2.1 AVIGILON
                       TABLE 242 AVIGILON: COMPANY OVERVIEW
                       TABLE 243 AVIGILON: PRODUCTS/SOLUTIONS/SERVICES OFFERED
                       TABLE 244 AVIGILON: SOLUTION/SERVICE LAUNCHES
                       TABLE 245 AVIGILON: DEALS
             14.2.2 AXIS COMMUNICATIONS
                       TABLE 246 AXIS COMMUNICATIONS: COMPANY OVERVIEW
                       FIGURE 62 AXIS COMMUNICATIONS: COMPANY SNAPSHOT
                       TABLE 247 AXIS COMMUNICATIONS: PRODUCTS/SOLUTIONS/SERVICES OFFERED
                       TABLE 248 AXIS COMMUNICATIONS: SOLUTION/SERVICE LAUNCHES
                       TABLE 249 AXIS COMMUNICATIONS: DEALS
                       TABLE 250 AXIS COMMUNICATIONS: OTHERS
             14.2.3 CISCO
                       TABLE 251 CISCO: COMPANY OVERVIEW
                       FIGURE 63 CISCO: COMPANY SNAPSHOT
                       TABLE 252 CISCO: PRODUCTS/SOLUTIONS/SERVICES OFFERED
                       TABLE 253 CISCO: SOLUTION/SERVICE LAUNCHES
                       TABLE 254 CISCO: DEALS
             14.2.4 HONEYWELL
                       TABLE 255 HONEYWELL: COMPANY OVERVIEW
                       FIGURE 64 HONEYWELL: COMPANY SNAPSHOT
                       TABLE 256 HONEYWELL: PRODUCTS/SOLUTIONS/SERVICES OFFERED
                       TABLE 257 HONEYWELL: SOLUTION/SERVICE LAUNCHES
                       TABLE 258 HONEYWELL: DEALS
             14.2.5 IBM
                       TABLE 259 IBM: COMPANY OVERVIEW
                       FIGURE 65 IBM: COMPANY SNAPSHOT
                       TABLE 260 IBM: PRODUCTS/SOLUTIONS/SERVICES OFFERED
                       TABLE 261 IBM: DEALS
             14.2.6 ALLGOVISION
                       TABLE 262 ALLGOVISION: COMPANY OVERVIEW
                       TABLE 263 ALLGOVISION: PRODUCTS/SOLUTIONS/SERVICES OFFERED
                       TABLE 264 ALLGOVISION: SOLUTION/SERVICE LAUNCHES
             14.2.7 GENETEC
                       TABLE 265 GENETEC: COMPANY OVERVIEW
                       TABLE 266 GENETEC: PRODUCTS/SOLUTIONS/SERVICES OFFERED
                       TABLE 267 GENETEC: SOLUTION/SERVICE LAUNCHES
                       TABLE 268 GENETEC: OTHERS
             14.2.8 INTELLIVISION
                       TABLE 269 INTELLIVISION: COMPANY OVERVIEW
                       TABLE 270 INTELLIVISION: PRODUCTS/SOLUTIONS/SERVICES OFFERED
                       TABLE 271 INTELLIVISION: SOLUTION/SERVICE LAUNCHES
             14.2.9 GORILLA TECHNOLOGY
                       TABLE 272 GORILLA TECHNOLOGY: COMPANY OVERVIEW
                       TABLE 273 GORILLA TECHNOLOGY: PRODUCTS/SOLUTIONS/SERVICES OFFERED
                       TABLE 274 GORILLA TECHNOLOGY: DEALS
             14.2.10 INTUVISION
                       TABLE 275 INTUVISION: COMPANY OVERVIEW
                       TABLE 276 INTUVISION: PRODUCTS/SOLUTIONS/SERVICES OFFERED
                       TABLE 277 INTUVISION: DEALS
             14.2.11 EAGLE EYE NETWORKS
                       TABLE 278 EAGLE EYE NETWORKS: BUSINESS OVERVIEW
                       TABLE 279 EAGLE EYE NETWORKS: PRODUCTS/SOLUTIONS/SERVICES OFFERED
                       TABLE 280 EAGLE EYE NETWORKS: PRODUCT LAUNCHES AND ENHANCEMENTS
                       TABLE 281 EAGLE EYE NETWORKS: DEALS
                       TABLE 282 EAGLE EYE NETWORKS: OTHERS
             14.2.12 ADT
                       TABLE 283 ADT: BUSINESS OVERVIEW
                       FIGURE 66 ADT: COMPANY SNAPSHOT
                       TABLE 284 ADT: PRODUCTS/SOLUTIONS/SERVICES OFFERED
                       TABLE 285 ADT: DEALS
             14.2.13 STANLEY SECURITY
                       TABLE 286 STANLEY SECURITY: BUSINESS OVERVIEW
                       FIGURE 67 SECURITAS: COMPANY SNAPSHOT
                       TABLE 287 STANLEY SECURITY: PRODUCTS/SOLUTIONS/SERVICES OFFERED
                       TABLE 288 STANLEY SECURITY: DEALS
*Details on Business Overview, Products, Solutions, & Services, Recent Developments, might not be captured in case of unlisted companies.
     14.3 OTHER PLAYERS 
             14.3.1 PURETECH SYSTEMS
             14.3.2 HIKVISION
             14.3.3 DAHUA TECHNOLOGY
             14.3.4 IOMNISCIENT
             14.3.5 NEC CORPORATION
             14.3.6 HUAWEI
             14.3.7 INTELLIGENT SECURITY SYSTEMS
             14.3.8 VERINT SYSTEMS
             14.3.9 VISEUM
             14.3.10 BRIEFCAM
             14.3.11 BOSCH SECURITY SYSTEMS
             14.3.12 I2V
             14.3.13 DIGITAL BARRIERS
             14.3.14 SENSTAR
             14.3.15 QOGNIFY
             14.3.16 IDENTIV
             14.3.17 IPSOTEK
             14.3.18 DELOPT
     14.4 SMES/STARTUPS 
             14.4.1 DRISHTI TECHNOLOGIES, INC.
             14.4.2 NATIX
             14.4.3 DEEP NORTH
             14.4.4 CRONJ
             14.4.5 MICROTRAFFIC
             14.4.6 ACTUATE
             14.4.7 CALIPSA
             14.4.8 CORSIGHT AI
             14.4.9 ARCULES
             14.4.10 CAWAMO
             14.4.11 KOGNIZ
 
15 ADJACENT MARKETS (Page No. - 302)
     15.1 INTRODUCTION TO ADJACENT MARKETS 
               TABLE 289 ADJACENT MARKETS AND FORECASTS
     15.2 LIMITATIONS 
     15.3 VIDEO ANALYTICS MARKET ECOSYSTEM AND ADJACENT MARKETS 
     15.4 FACIAL RECOGNITION MARKET 
             15.4.1 FACIAL RECOGNITION MARKET, BY COMPONENT
                       TABLE 290 FACIAL RECOGNITION MARKET SIZE, BY COMPONENT, 2014–2019 (USD MILLION)
                       TABLE 291 FACIAL RECOGNITION MARKET SIZE, BY COMPONENT, 2019–2025 (USD MILLION)
             15.4.2 FACIAL RECOGNITION MARKET, BY APPLICATION
                       TABLE 292 FACIAL RECOGNITION MARKET SIZE, BY APPLICATION, 2014–2019 (USD MILLION)
                       TABLE 293 FACIAL RECOGNITION MARKET SIZE, BY APPLICATION, 2019–2025 (USD MILLION)
             15.4.3 FACIAL RECOGNITION MARKET, BY VERTICAL
                       TABLE 294 FACIAL RECOGNITION MARKET SIZE, BY VERTICAL, 2014–2019 (USD MILLION)
                       TABLE 295 FACIAL RECOGNITION MARKET SIZE, BY VERTICAL, 2019–2025 (USD MILLION)
             15.4.4 FACIAL RECOGNITION MARKET, BY REGION
                       TABLE 296 FACIAL RECOGNITION MARKET SIZE, BY REGION, 2014–2019 (USD MILLION)
                       TABLE 297 FACIAL RECOGNITION MARKET SIZE, BY REGION, 2019–2025 (USD MILLION)
     15.5 STREAMING ANALYTICS MARKET 
             15.5.1 STREAMING ANALYTICS MARKET, BY COMPONENT
                       TABLE 298 STREAMING ANALYTICS MARKET, BY COMPONENT, 2015–2020 (USD MILLION)
                       TABLE 299 STREAMING ANALYTICS MARKET, BY COMPONENT, 2021–2026 (USD MILLION)
             15.5.2 STREAMING ANALYTICS MARKET, BY APPLICATION
                       TABLE 300 STREAMING ANALYTICS MARKET, BY APPLICATION, 2015–2020 (USD MILLION)
                       TABLE 301 STREAMING ANALYTICS MARKET, BY APPLICATION, 2021–2026 (USD MILLION)
             15.5.3 STREAMING ANALYTICS MARKET, BY DEPLOYMENT MODE
                       TABLE 302 STREAMING ANALYTICS MARKET, BY DEPLOYMENT MODE,  2015–2020 (USD MILLION)
                       TABLE 303 STREAMING ANALYTICS MARKET, BY DEPLOYMENT MODE,  2021–2026 (USD MILLION)
             15.5.4 STREAMING ANALYTICS MARKET, BY ORGANIZATION SIZE
                       TABLE 304 STREAMING ANALYTICS MARKET, BY ORGANIZATION SIZE,  2015–2020 (USD MILLION)
                       TABLE 305 STREAMING ANALYTICS MARKET, BY ORGANIZATION SIZE,  2021–2026 (USD MILLION)
             15.5.5 STREAMING ANALYTICS MARKET, BY INDUSTRY VERTICAL
                       TABLE 306 STREAMING ANALYTICS MARKET, BY INDUSTRY VERTICAL,  2015–2020 (USD MILLION)
                       TABLE 307 STREAMING ANALYTICS MARKET, BY INDUSTRY VERTICAL,  2021–2026 (USD MILLION)
             15.5.6 STREAMING ANALYTICS MARKET, BY REGION
                       TABLE 308 STREAMING ANALYTICS MARKET, BY REGION, 2015–2020 (USD MILLION)
                       TABLE 309 STREAMING ANALYTICS MARKET, BY REGION, 2021–2026 (USD MILLION)
 
16 APPENDIX (Page No. - 313)
     16.1 DISCUSSION GUIDE 
     16.2 KNOWLEDGESTORE: MARKETSANDMARKETS’  SUBSCRIPTION PORTAL 
     16.3 CUSTOMIZATION OPTIONS 
     16.4 RELATED REPORTS 
     16.5 AUTHOR DETAILS 

The study involves four major activities in estimating the current size of the video analytics market. Exhaustive secondary research was done to collect information on the market, peer market, and parent market. The next step was to validate these findings, assumptions, and sizing with industry experts across the value chain using primary research. Both top-down and bottom-up approaches were employed to estimate the total market size. After that, the market breakdown and data triangulation procedures were used to estimate the market size of the segments and sub-segments of the video analytics market.

Secondary Research

The market size of companies offering video analytics software and services was arrived at, based on the secondary data available through paid and unpaid sources, and by analyzing the product portfolios of major companies in the ecosystem and rating the companies based on their product capabilities and business strategies.

In the secondary research process, various sources were referred to, for identifying and collecting information for the study. The secondary sources included annual reports, press releases, investor presentations of companies, and product data sheets, white papers, journals, certified publications, and articles from recognized authors, government websites, directories, and databases.

Secondary research was mainly used to obtain key information about the industry’s supply chain, the total pool of key players, market classification and segmentation according to industry trends to the bottom-most level, regional markets, and key developments from both market- and technology oriented perspectives, all of which were further validated by primary sources.

Primary Research

In the primary research process, various primary sources from both supply and demand sides were interviewed to obtain qualitative and quantitative information for this report. The primary sources from the supply side included industry experts, such as Chief Executive Officers (CEOs), Vice Presidents (VPs), marketing directors, technology and innovation directors, and related key executives from various key companies and organizations operating in the video analytics market.

Primary interviews were conducted to gather insights, such as market statistics, latest trends disrupting the market, new use cases implemented, data of revenue collected from products and services, market breakups, market size estimations, market forecasts, and data triangulation. Primary research also helped in understanding various trends related to technologies, segmentation types, industry trends, and regions. Stakeholders from the demand side, such as Chief Information Officers (CIOs), Chief Technology Officers (CTOs), Chief Security Officers (CSOs); the installation teams of governments/end users using video analytics software and services; and digital initiatives project teams, were interviewed to understand the buyer’s perspective on suppliers, products, service providers, and their current use of software solutions, which would affect the overall video analytics market.
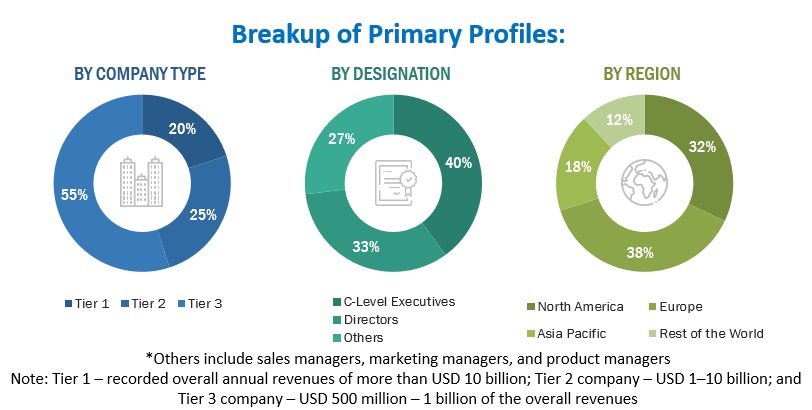
Video Analytics Market Size, and Share

To know about the assumptions considered for the study, download the pdf brochure

Video Analytics Market Size Estimation

Top-down and bottom-up approaches were used to estimate and validate the size of the video analytics market and various other dependent subsegments. The research methodology used to estimate the market size included the following details:

  • The key players in the market were identified through secondary research, and their revenue contributions in the respective countries were determined through primary and secondary research.
  • This entire procedure included the study of the annual and financial reports of top market players and extensive interviews for key insights from industry leaders, such as Chief Executive Officers (CEOs), VPs, directors, and marketing executives.
  • All percentage splits and breakups were determined using secondary sources and verified through primary sources.

In the bottom-up approach, the adoption trend of video analytics software and services among different industry verticals in key countries with respect to regions that contribute to most of the market share was identified. For cross-validation, the adoption trend of video analytics software and services, along with different use cases with respect to their business segments, was identified and extrapolated. Weightage was given to the use cases identified in different solution areas for the calculation. An exhaustive list of all vendors offering software and services in the video analytics market was prepared. The revenue contribution of all vendors in the market was estimated through annual reports, press releases, funding, investor presentations, paid databases, and primary interviews. Vendors with video analytics software and services offerings were considered for the evaluation of the market size. Each vendor was evaluated on the basis of its software and service offerings across verticals. The aggregate of all companies’ revenue was extrapolated to reach the overall market size. Each subsegment was studied and analyzed for its market size and regional penetration. Based on these numbers, the region split was determined by primary and secondary sources.

In the top-down approach, an exhaustive list of all the vendors offering software and services in the video analytics market was prepared. The revenue contribution of all the vendors in the market was estimated through annual reports, press releases, funding, investor presentations, paid databases, and primary interviews. Both types of vendors that offer video analytics as a standalone solution, as well as an integrated solution in the video surveillance systems, were considered for the evaluation of the market size. Each vendor was evaluated based on its product/solution offerings, services, and applications across verticals. The aggregate of all companies’ revenue was extrapolated to reach the overall market size. Furthermore, each subsegment was studied and analyzed for its market size and regional penetration. The markets were triangulated through both primary and secondary research. The primary procedure included extensive interviews for key insights from industry leaders, such as CEOs, VPs, directors, and marketing executives. These market numbers were further triangulated with the existing MarketsandMarkets’ repository for validation.

Data Triangulation

After arriving at the overall market size using the market size estimation processes as explained above, the market was split into several segments and subsegments. The data triangulation and market breakup procedures were employed, wherever applicable, to complete the overall market engineering process and arrive at the exact statistics of each market segment and subsegment. The data was triangulated by studying various factors and trends from both the demand and supply sides.

Report Objectives

  • To define, describe, and forecast the global Video Analytics market on the basis of component (software and services), application, type, deployment model, organization size, vertical, and region
  • To forecast the market size of the five major regional segments: North America, Europe, Asia Pacific, Middle East & Africa, and Latin America
  • To strategically analyze the market subsegments with respect to individual growth trends, prospects, and contributions to the total market
  • To provide detailed information related to the major factors influencing the growth of the market (drivers, restraints, opportunities, and challenges)
  • To strategically analyze macro and micromarkets1 with respect to growth trends, prospects, and their contributions to the overall market
  • To analyze industry trends, patents & innovations, and pricing data related to the video analytics market
  • To analyze the impact of COVID-19 on component, application, type, deployment model, organization size, vertical, and region across the globe
  • To analyze the opportunities in the market for stakeholders and provide details of the competitive landscape for major players
  • To profile key players in the market and comprehensively analyze their market share/ranking and core competencies2
  • To track and analyze competitive developments, such as mergers and acquisitions, new product developments, and partnerships and collaborations in the market.

1. Micromarkets are defined as the further segments and subsegments of the Video Analytics market included in the report.
2. Core competencies of the companies are captured in terms of their key developments and key strategies adopted by them to sustain their position in the market.

Customization Options

Along with the market data, MarketsandMarkets offers customizations as per the company-specific needs. The following customization options are available for the report:

Geographic Analysis

  • Further breakup of the Asia Pacific market into countries contributing 75% to the regional market size
  • Further breakup of the North American market into countries contributing 75% to the regional market size
  • Further breakup of the Latin American market into countries contributing 75% to the regional market size
  • Further breakup of the Middle Eastern and African market into countries contributing 75% to the regional market size
  • Further breakup of the European market into countries contributing 75% to the regional market size

Company Information

  • Detailed analysis and profiling of additional market players (up to 5)
Custom Market Research Services

We will customize the research for you, in case the report listed above does not meet with your exact requirements. Our custom research will comprehensively cover the business information you require to help you arrive at strategic and profitable business decisions.

Request Customization

Instant Answers with GPT - Ask Now!

Ask real questions. Get complete answers !
Report Code
TC 3523
Published ON
Oct, 2022
Choose License Type
BUY NOW
  • SHARE
X
Request Customization
Speak to Analyst
Speak to Analyst
OR FACE-TO-FACE MEETING
PERSONALIZE THIS RESEARCH
  • Triangulate with your Own Data
  • Get Data as per your Format and Definition
  • Gain a Deeper Dive on a Specific Application, Geography, Customer or Competitor
  • Any level of Personalization
REQUEST A FREE CUSTOMIZATION
LET US HELP YOU!
  • What are the Known and Unknown Adjacencies Impacting the Video Analytics Market
  • What will your New Revenue Sources be?
  • Who will be your Top Customer; what will make them switch?
  • Defend your Market Share or Win Competitors
  • Get a Scorecard for Target Partners
CUSTOMIZED WORKSHOP REQUEST
+1-888-600-6441
  • Call Us
  • +1-888-600-6441 (Corporate office hours)
  • +1-888-600-6441 (US/Can toll free)
  • +44-800-368-9399 (UK office hours)
CONNECT WITH US
ABOUT TRUST ONLINE
©2023 MarketsandMarkets Research Private Ltd. All rights reserved
DMCA.com Protection Status Website Feedback