
Kombucha Market by Types (Bacteria, Yeast, Mold, Others), Flavors (Herbs & Spices, Citrus, Berries, Apple, Coconut & Mangoes, Flowers, Others), & by Region - Forecasts to 2020
Market Segmentation
| Report Metrics | Details |
|
Market size available for years |
2015 - 2020 |
|
CAGR % |
25 |
Top 10 companies in Kombucha Market
Kombucha Market News
| Publish Date | Kombucha Market Updates |
|---|---|
| 01-Jun-2023 | Mother Kombucha - Line Manager/Mechanic and Packaging ... |
| 26-May-2023 | This Week's New Products: Tropical Kombucha, Plus PRIDE Month ... |
| 26-May-2023 | Ryan Seacrest Brings Greater Attention to Kombucha with Health ... |
| 23-May-2023 | Health-Ade's Guava Dragon Fruit Kombucha Is Back by Popular ... |
| 13-May-2023 | Hard kombucha seltzer venue Buch Fermentary and Taproom ... |


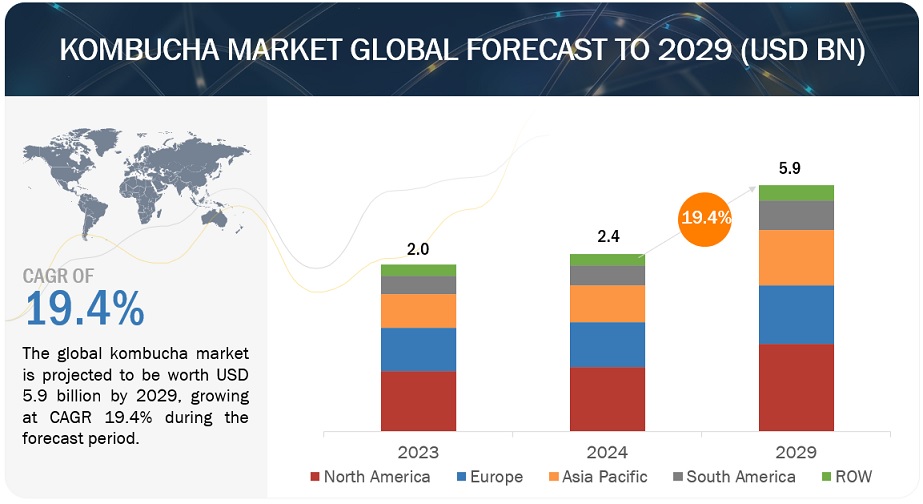
The global kombucha market is estimated to grow from USD 0.6 Billion in 2015 to USD 1.8 Billion by 2020, at a CAGR of 25.0% from 2015 to 2020. Round the globe, people have been consuming fermented tea for many years, giving it different names and admiring its probiotic benefits and its energizing taste. Kombucha, a kind of health drink, is made by fermenting tea and sugar with the microbial culture (which includes yeast, bacteria, and mold). It can be added with numerous essences to add different tastes to the drink. Every kombucha culture contains different strains of bacteria and yeasts. These strains offer a wide range of applications along with better yield in the market. The kombucha market is the fastest-growing market in the functional beverages category
Millennium Products, Inc. (U.S.) was first to introduce kombucha beverage in the market by introducing two famous brands, GT’S Kombucha and Synergy. It majorly operates in the U.S. but distributes its products across the globe. Its major distributors include Horizon Distributors and Whole Foods Market, among others. The company has sustainably pillared its monopoly in the global kombucha market. GT’s Kombucha produces alcoholic as well as non-alcoholic kombucha. The four important product lines of GT’s Kombucha are Enlightened Kombucha, Enlightened synergy, Classic Kombucha, and Classic Synergy. The company has achieved incredible growth and is focused on expanding gradually and organically, in every aspect of the business. It is expanding its product range and is introducing innovative blends of kombucha in the market to strengthen its presence in the market.
The kombucha market in North America is the largest market having accounted for a share of 39.4% in terms of value. The North American market, in terms of value, is projected to register a CAGR of 25.0% from 2015 to 2020. Factors such as increasing health consciousness among people, prevailing health disorders, increasing disposable income, and changing lifestyle of individuals are driving the growth of this market. Moreover, increase in consumption of alcoholic beverages has boosted the market for kombucha as it can be classified as an alcoholic drink.
Get online access to the report on the World's First Market Intelligence Cloud
Request Sample Scope of the Report

The research study categorizes the market on the basis of types, flavors, and regions.
Global Kombucha Market, By Type
- Bacteria
- Yeast
- Mold
- Others
Global Kombucha Market, By Flavor
- Herbs & Spices
- Citrus
- Berries
- Apple
- Coconut & Mangoes
- Flowers
- Others
Global Kombucha Market, By Geography
- North America
- Europe
- Asia-Pacific
- RoW
In terms of value, the kombucha market is projected to reach USD 1.8 Billion by 2020, at a CAGR of 25.0%. Increasing health consciousness among individuals due to high prevalence of chronic diseases and disorders has changed the consumer preferences. They are more attracted to healthy and nutritive beverages instead of unhealthy drinks. Increasing employment opportunities have led to change in consumer lifestyle. Hectic schedule, improper diet, and untimely meals have led to various health issues in the working population. To resolve these health issues, the demand for functional beverages is rising. With rise in purchasing power of consumers, the total amount of expenditure made on health drinks and energy boosters has simultaneously increased. Kombucha falls under the healthy drinks category that is gaining importance in the beverage industry. Kombucha is a detoxifying drink that contains high antioxidants, vitamins, and various enzymes, which help improve metabolic disorders, digestion, and allergies among other related ailments. It is also claimed that this drink can improve body defenses and help cure cancer at early stage.
Kombucha is used across segments like medicine and drugs. The demand of kombucha tea and other beverages is constantly increasing due to the varied health benefits associated with it. The kombucha market has seen a phenomenal growth in recent years, and is the fastest-growing market in the functional beverage industry. The market is witnessing high competition and is expanding on the basis of its innovative product line.
The global market for kombucha has grown exponentially in the last few years. In terms of value, the market is projected to reach USD 1.8 Billion by 2020, at a CAGR of 25.0% from 2015 to 2020. North America is the largest market in the global kombucha market having accounted for a share of 39.4%. North America has witnessed the highest sale of kombucha beverages. The U.S. has copious manufacturers of kombucha that are continuously expanding their geographical reach in the market.
However, the markets in Asia-Pacific and Europe are growing at a significant pace. Increasing health awareness among people and increasing initiatives undertaken by the government to promote the drink have driven the kombucha market in these regions.
Leading companies engaged in manufacturing and exporting the kombucha drink worldwide include GT’s Kombucha Company (U.S.), Reed’s Inc. (U.S.), and Live Soda Kombucha (U.S.). These companies are into manufacturing both alcoholic and non-alcoholic kombucha beverages. The drink is said to be non-alcoholic, if the alcohol percentage is less than 0.5%. On the other hand, if the alcohol percentage is higher than 0.5%, it is considered as an alcoholic drink. As per consumer demand, companies have started customizing the drink using different flavors, which include herbs and spices, citrus, berries, and flowers among others.
Table of Contents
1 Introduction (Page No. - 13)
1.1 Objectives
1.2 Market Definition
1.3 Market Scope
1.3.1 Markets Covered
1.3.2 Years Considered in the Report
1.4 Currency & Pricing
1.5 Package Size
1.6 Limitations
1.7 Stakeholders
2 Research Methodology (Page No. - 18)
2.1 Research Data
2.1.1 Secondary Data
2.1.1.1 Key Data From Secondary Sources
2.1.2 Primary Data
2.1.2.1 Key Data From Primary Sources
2.1.2.2 Key Industry Insights
2.1.2.3 Breakdown of Primary Interviews
2.2 Market Size Estimation
2.3 Market Breakdown & Data Triangulation
2.4 Research Assumptions & Limitations
2.4.1 Assumptions
2.4.2 Limitations
3 Executive Summary (Page No. - 26)
3.1 Overview
3.2 Kombucha Market
4 Premium Insights (Page No. - 29)
4.1 Attractive Market Opportunities in Kombucha Market
4.2 Kombucha Market, By Flavor
4.3 North America Led the Global Kombucha Market in 2014
4.4 China is Growing With the Highest CAGR in Global Kombucha Market
4.5 Market, By Type, 2014
4.6 Market: Developed vs. Developing Markets
4.7 Market Life Cycle Analysis, By Region
5 Industry Trends (Page No. - 37)
5.1 Introduction
5.2 Value Chain Analysis
5.3 Supply Chain Analysis
5.4 Industry Trends
5.5 Scale of Operation: Segmentation By Size Into Large, Medium, and Small
5.6 Qualitative Analysis of the End Product
5.7 Porter’s Five Forces Analysis
5.7.1 Intensity of Competitive Rivalry
5.7.2 Bargaining Power of Suppliers
5.7.3 Bargaining Power of Buyers
5.7.4 Threat of Substitutes
5.7.5 Threat of New Entrants
5.8 Strategic Benchmarking
5.8.1 New Product Launches & Expansions
6 Kombucha Market Overview (Page No. - 45)
6.1 Introduction
6.2 Evolution
6.3 Market Insights
6.4 Market Segmentation
6.4.1 By Type
6.4.2 By Flavor
6.4.3 By Region
6.5 Market Dynamics
6.5.1 Drivers
6.5.1.1 Increasing Disposable Income and Changing Lifestyle of Individuals
6.5.1.2 Easy Manufacturing Process
6.5.1.3 Rise in Demand for Fortified Food & Beverage Products
6.5.1.4 Growing Health Awareness and Increasing Prevalence of Health Disorders
6.5.1.5 R&D and Innovations to Expand Applicability and Accelerate Growth
6.5.1.6 Increasing Consumption of Alcoholic Beverages
6.5.2 Restraints
6.5.2.1 Incidences of Beverage Recall
6.5.2.2 Complex Supply Chain and High Inventory Carrying Cost
6.5.2.3 Regulations for the Usage of Microorganisms
6.5.2.4 Time Required for Regulatory Approval
6.5.3 Opportunities
6.5.3.1 Growing Demand in Emerging Economies
6.5.3.2 Growing Consumption of Functional Beverages
6.5.4 Challenge
6.5.4.1 Regulatory Framework
7 Global Kombucha Market, By Flavor (Page No. - 59)
7.1 Introduction
7.2 Herbs & Spices
7.3 Citrus
7.4 Berries
7.5 Apple, Coconut, and Mango
7.6 Flowers
7.7 Others
8 Global Kombucha Market, By Type (Page No. - 71)
8.1 Introduction
8.2 Yeast
8.3 Bacteria
8.4 Mold
8.5 Others
9 Global Kombucha Market By Region (Page No. - 82)
9.1 Introduction
9.2 North America
9.2.1 U.S.
9.2.2 Mexico
9.2.3 Canada
9.3 Europe
9.3.1 U.K.
9.3.2 Germany
9.3.3 Spain
9.3.4 Italy
9.3.5 France
9.3.6 Rest of Europe
9.4 Asia-Pacific
9.4.1 China
9.4.2 Japan
9.4.3 India
9.4.4 Australia
9.4.5 Rest of Asia-Pacific
9.5 RoW
9.5.1 Latin America
9.5.2 Middle East
9.5.3 Africa
10 Competitive Landscape (Page No. - 130)
10.1 Overview
10.1.1 Company Presence in Kombucha Market, By Flavors
10.1.2 New Product Launch
10.1.3 Expansions and Investments
10.1.4 Mergers and Acquisitions
11 Company Profiles (Page No. - 135)
11.1 Buchi Kombucha
11.1.1 Business Overview
11.1.2 Product and Service Offerings
11.2 Cell - Nique Corporation
11.2.1 Business Overview
11.2.2 Key Strategies
11.2.3 Product and Service Offerings
11.2.4 Related Developments
11.3 Gt’s Kombucha
11.3.1 Business Overview
11.3.2 Key Strategy
11.3.3 Product and Service Offerings
11.4 Hain Celestial Group
11.4.1 Business Overview
11.4.2 Key Strategy
11.4.3 Product and Service Offerings
11.4.4 Related Developments
11.4.5 SWOT Analysis
11.4.6 MnM View
11.5 Kevita, Inc.
11.5.1 Business Overview
11.5.2 Key Strategy
11.5.3 Product and Service Offerings
11.5.4 Related Developments
11.6 Kombucha Wonder Drink
11.6.1 Business Overview
11.6.2 Key Strategy
11.6.3 Product and Service Offerings
11.7 Kosmic Kombucha
11.7.1 Business Overview
11.7.2 Key Strategy
11.7.3 Product and Service Offerings
11.8 Live Soda Kombucha
11.8.1 Business Overview
11.8.2 Key Strategy
11.8.3 Product and Service Offerings
11.9 Makana Beverages Inc.
11.9.1 Business Overview
11.9.2 Key Strategy
11.9.3 Product and Service Offerings
11.10 Nesalla Kombucha
11.10.1 Business Overview
11.10.2 Key Strategy
11.10.3 Product and Service Offerings
11.11 Red Bull GmbH
11.11.1 Business Overview
11.11.2 Key Strategy
11.11.3 Product and Service Offerings
11.12 Reed’s Inc.
11.12.1 Business Overview
11.12.2 Key Strategy
11.12.3 Product and Service Offerings
11.12.4 Related Developments
11.12.5 SWOT Analysis
11.12.6 MnM View
11.13 Revive Kombucha
11.13.1 Business Overview
11.13.2 Key Strategy
11.13.3 Product and Service Offerings
11.13.4 Related Developments
11.14 the Humm Kombucha LLC
11.14.1 Business Overview
11.14.2 Key Strategy
11.14.3 Product and Service Offerings
11.15 Townshend’s Tea Company
11.15.1 Business Overview
11.15.2 Key Strategy
11.15.3 Product and Service Offerings
11.15.4 Related Developments
12 Appendix (Page No. - 164)
12.1 Insights of Industry Experts
12.2 Discussion Guide
12.3 Introducing RT:Real Time Market Intelligence
12.4 Available Customizations
12.1 Related Reports
List of Tables (79 Tables)
Table 1 Kombucha Has Several Names Across the World
Table 2 Growing Health Consciousness Among Consumers & Increase in Disposable Income Are the Leading Trends in the Industry
Table 3 Constituent Substances of Kombucha and Their Effects
Table 4 Global Kombucha Market, By Flavor, 2013-2020 (USD Million)
Table 5 Global Kombucha Market, By Flavor, 2013-2020 (Metric Tons)
Table 6 List of Companies Producing Herbs & Spices Flavored Products
Table 7 List of Companies Producing Citrus Flavored Products
Table 8 List of Companies Producing Berries Flavored Products
Table 9 List of Companies Producing Apple, Coconut, and Mango Flavored Products
Table 10 List of Companies Producing Flowers Flavored Products
Table 11 List of Companies Producing Others Flavored Products
Table 12 Global Kombucha Market, By Type, 2013 - 2020 (USD Million)
Table 13 Global Market, By Type, 2013 - 2020 (Metric Tons)
Table 14 Global Kombucha Market in Yeast, By Region, 2013 - 2020 (USD Million)
Table 15 Global Market in Yeast, By Region, 2013-2020 (Metric Tons)
Table 16 Global Kombucha Market in Bacteria, By Region, 2013–2020 (USD Million)
Table 17 Global Market in Bacteria, By Region, 2013–2020 (Metric Tons)
Table 18 Global Kombucha Market in Mold, By Region, 2013–2020 (USD Million)
Table 19 Global Market in Mold, By Region, 2013–2020 (Metric Tons)
Table 20 Global Kombucha Market in Others, By Region, 2013–2020 (USD Million)
Table 21 Global Market in Others, By Region, 2013–2020 (Metric Tons)
Table 22 Global Kombucha Market, By Region, 2013 - 2020 (USD Million)
Table 23 Global Market, By Region, 2013 - 2020 (Metric Tons)
Table 24 Country Wise Import Duty & Taxes for Kombucha in North America
Table 25 North America: Kombucha Market, By Country, 2013-2020 (USD Million)
Table 26 North America: Market, By Country, 2013-2020 (Metric Tons)
Table 27 North America: Kombucha Market, By Type, 2013-2020 (USD Million)
Table 28 North America: Market, By Type, 2013-2020 (Metric Tons)
Table 29 U.S.: Market, By Type, 2013-2020 (USD Million)
Table 30 U.S.: Market, By Type, 2013-2020 (Metric Tons)
Table 31 Mexico: Market, By Type, 2013-2020 (USD Million)
Table 32 Mexico: Market, By Type, 2013-2020 (Metric Tons)
Table 33 Canada: Market, By Type, 2013-2020 (USD Million)
Table 34 Canada: Market, By Type, 2013-2020 (Metric Tons)
Table 35 Europe: Kombucha System Market, By Country, 2013-2020 (USD Million)
Table 36 Europe: System Market, By Country, 2013-2020 (Metric Tons)
Table 37 Europe: Market, By Type, 2013-2020 (USD Million)
Table 38 Europe: Market, By Type, 2013-2020 (Metric Tons)
Table 39 Country Wise Import Duty & Taxes
Table 40 U.K.: Market, By Type, 2013-2020 (USD Million)
Table 41 U.K.: Market, By Type, 2013-2020 (Metric Tons)
Table 42 Germany: Kombucha Market, By Type, 2013-2020 (USD Million)
Table 43 Germany: Market, By Type, 2013-2020 (Metric Tons)
Table 44 Spain: Kombucha Market, By Type, 2013-2020 (USD Million)
Table 45 Spain: Market, By Type, 2013-2020 (Metric Tons)
Table 46 Italy: Kombucha Market, By Type, 2013-2020 (USD Million)
Table 47 Italy: Market, By Type, 2013-2020 (Metric Tons)
Table 48 France: Market, By Type, 2013-2020 (USD Million)
Table 49 France: Market, By Type, 2013-2020 (Metric Tons)
Table 50 Rest of Europe: Market, By Type, 2013-2020 (USD Million)
Table 51 Rest of Europe: Market, By Type, 2013-2020 (Metric Tons)
Table 52 Asia-Pacific: Kombucha Market, By Country, 2013-2020 (USD Million)
Table 53 Asia-Pacific: Market, By Country, 2013-2020 (Metric Tons)
Table 54 Asia-Pacific: Market, By Type, 2013-2020 (USD Million)
Table 55 Asia-Pacific: Market, By Type, 2013-2020 (Metric Tons)
Table 56 Country Wise Import Duty & Taxes
Table 57 China: Market, By Type, 2013-2020 (USD Million)
Table 58 China: Market, By Type, 2013-2020 (Metric Tons)
Table 59 Japan: Market, By Type, 2013-2020 (USD Million)
Table 60 Japan: Market, By Type, 2013-2020 (Metric Tons)
Table 61 India: Market, By Type, 2013-2020 (USD Million)
Table 62 India: Market, By Type, 2013-2020 (Metric Tons)
Table 63 Australia: Kombucha Market, By Type, 2013-2020 (USD Million)
Table 64 Australia: Market, By Type, 2013-2020 (Metric Tons)
Table 65 Rest of Asia-Pacific: Kombucha Market, By Type, 2013-2020 (USD Million)
Table 66 Rest of Asia-Pacific: Market, By Type, 2013-2020 (Metric Tons)
Table 67 RoW: Kombucha Market, By Region, 2013-2020 (USD Million)
Table 68 RoW: Kombucha System Market, By Region, 2013-2020 (Metric Tons)
Table 69 RoW: Kombucha Market, By Type, 2013-2020 (USD Million)
Table 70 RoW: Market, By Type, 2013-2020 (Metric Tons)
Table 71 Latin America: Kombucha Market, By Type, 2015-2020 (USD Million)
Table 72 Latin America: Market, By Type, 2013-2020 (Metric Tons)
Table 73 Middle East: Kombucha Market, By Type, 2013-2020 (USD Million)
Table 74 Middle East: Market, By Type, 2013-2020 (Metric Tons)
Table 75 Africa: Kombucha Market, By Type, 2013-2020 (USD Million)
Table 76 Africa: Market, By Type, 2013-2020 (Metric Tons)
Table 77 Global Market: New Product Launch
Table 78 Global Market: Expansions and Investments
Table 79 Global Kombucha Market: Mergers and Acquisitions
List of Figures (61 Figures)
Figure 1 Kombucha Market Segmentation
Figure 2 Geographic Scope
Figure 3 Kombucha Market: Research Design
Figure 4 Market Size Estimation Methodology: Bottom-Up Approach
Figure 5 Market Size Estimation Methodology: Top-Down Approach
Figure 6 Data Triangulation
Figure 7 Kombucha Market Snapshot (2015 vs. 2020): Herbs & Spices is Estimated to Be the Largest Market
Figure 8 Yeast is the Market Leader and Also Growing With Highest CAGR
Figure 9 North America Accounted for the Maximum Share in 2014
Figure 10 Growing Health Consciousness & Rising Disposable Income Drives the Kombucha Market
Figure 11 Herbs & Spices to Grow at the Highest CAGR
Figure 12 Yeast Was the Largest Segment for Kombucha Market in North America, 2014
Figure 13 China Estimated to Be the Fastest-Growing Market, 2015-2020
Figure 14 Yeast Was the Largest Segment in the Market, 2014
Figure 15 The Market in the U.S. Held the Major Share of the Kombucha Market
Figure 16 North America is the Market Leader of Global Kombucha Market, 2014
Figure 17 Logistics and Marketing Contributes the Most to the Value of Overall Price of Kombucha Drink
Figure 18 Supply Chain Analysis of the Kombucha Market
Figure 19 Porter’s Five Forces Analysis
Figure 20 Strategic Benchmarking: Key Market Players Largely Adopted New Product Launches & Expansions
Figure 21 Volution of Kombucha
Figure 22 Kombucha Market, By Type
Figure 23 Market, By Flavor
Figure 24 Market, By Region
Figure 25 Growing Health Awareness & Rising Demand of Fortified Food Drive Market Growth
Figure 26 GDP of Leading Countries, 2013
Figure 27 Main Causes of Death Worldwide Among All Ages, 2005: Published By Who in 2009
Figure 28 Functional Drinks Market Size (Value), By Type, 2009-2015 (USD BN)
Figure 29 Herbs & Spices Segment is Projected to Capture the Largest Share in the Market, By 2020 (USD Million)
Figure 30 Citrus Segment is Expected to Grow With the Highest CAGR During 2015 to 2020
Figure 31 Yeast is Estimated to Account for the Maximum Application in the Production of Kombucha, 2015 (USD Million)
Figure 32 Global Kombucha Market, By Type, 2015–2020 (Metric Tons)
Figure 33 Global Kombucha Market in Yeast, By Region, 2013 - 2020 (USD Million)
Figure 34 Global Kombucha Market in Bacteria, By Region, 2013–2020 (USD Million)
Figure 35 Global Kombucha Market in Mold, By Region, 2013–2020 (USD Million)
Figure 36 Global Kombucha Market, By Region : Others, 2013–2020 (USD Million)
Figure 37 Asia-Pacific Market Growing at High Rate Owing to the Growth in Disposable Income 2015-2020 (USD Million)
Figure 38 North America is the Largest Market for Insoluble Dietary Fibers in 2015 (Metric Tons)
Figure 39 North America is A Key Region for Growth of the Kombucha Market
Figure 40 U.S. is Estimated & Projected to Be the Largest Market for Kombucha, 2015 & 2020 (%)
Figure 41 North America Kombucha System Market, By Country, 2013-2020 (USD Million)
Figure 42 North America Kombucha Market, By Type, 2015-2020 (USD Million)
Figure 43 U.S. Kombucha Market, By Type, 2015 & 2020 (USD Million)
Figure 44 U.K. Dominted the European Kombucha Market in 2014
Figure 45 Europe Kombucha Market Overview, 2015 & 2020 (%)
Figure 46 Europe Kombucha System Market, By Country, 2013-2020 (USD Million)
Figure 47 Europe Kombucha Market, By Type, 2015-2020 (USD Million)
Figure 48 U.K. Kombucha Market, By Type, 2015 & 2020 (USD Million)
Figure 49 China is the Leading Market in the Asia-Pacific Kombucha Market
Figure 50 Asia-Pacific Kombucha Market Overview, 2015 & 2020 (%)
Figure 51 Asia-Pacific Kombucha Market, By Country, 2013-2020 (USD Million)
Figure 52 Asia-Pacific Kombucha Market, By Type, 2015-2020 (USD Million)
Figure 53 China Kombucha Market, By Type, 2015 & 2020 (USD Million)
Figure 54 Latin America is the Largest Market in RoW, 2015
Figure 55 RoW Kombucha Market, By Region, 2013-2020 (USD Million)
Figure 56 RoW Kombucha Market, By Type, 2015-2020 (USD Million)
Figure 57 Latin America Kombucha Market, By Type, 2015 & 2020 (USD Million)
Figure 58 Companies Adopted Acquisitions & Expansions as Key Growth Strategies
Figure 59 Kombucha: Company Product Coverage, By Flavors, 2015
Figure 60 Hain Celestial Group : Company Snapshot
Figure 61 Reed’s Inc. : Company Snapshot


Growth opportunities and latent adjacency in Kombucha Market
I need to get in-depth analysis of the COVID-19 impact on the Kombucha Market
I need to get in-depth analysis of the COVID-19 impact on the Kombucha Market Statistics and information related to Kombucha Drink: growth and exports in imports for European countries, USA and Canada during the previous years in Kombucha drink? What is the average tariff charged, the value of customs tariffs, terms of origin rules, and the amount of taxes, the technical requirements of the country of export and of the potential product for export (export documentation, customs clearance, product technical certificates, packaging and labeling requirements, etc.) And the potential impact of trade agreements, legislation and procedures applied between Jordan, European countries, USA and Canada on Kombucha (such as measures to protect the product and dumping, etc).
Kombucha Market is at a nascent stage. However, your report provides valuable insights into this market. Thank you for the study.