Laminated Busbar Market by Material (Copper, Aluminum), End-User (Utilities, Industrial, Commercial, Residential), Insulation Material (Epoxy Powder Coating, Polyester Film, PVF Film, Polyester Resin, and Others), and Region - Global Forecast to 2025


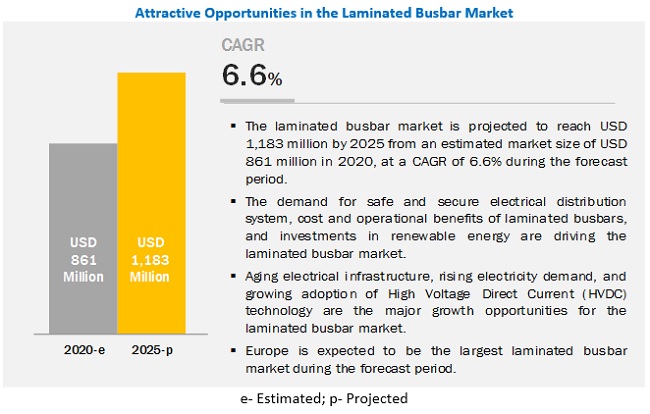
[143 Pages Report] The global laminated busbar market size was valued at $861 million in 2020 and to reach $1,183 million by 2025, growing at a compound annual growth rate (CAGR) of 6.6% from 2020 to 2025. Cost-efficiency and operational benefits of laminated busbars, demand for safe and secure electrical distribution systems, and focus on renewable energy are expected to drive the laminated busbar market during the forecast period.
The copper segment is expected to be the largest contributor to the market, by material, during the forecast period
The report segments the laminated busbar market based on material into copper and aluminum. The copper segment is projected to be the largest market for laminated busbars, by material, during the forecast period. Copper is the most widely used and technically the best material for making laminated busbars as it offers higher conductivity and better load surge withstand capacity.
The utilities segment is expected to be the largest market during the forecast period
The report segments the laminated busbar market based on end-user into utilities, industrial, commercial, and residential. The utilities segment is expected to hold the largest market share during the forecast period. Increasing investments for renewable generation and growing power distribution infrastructure are expected to drive the utilities segment of the laminated busbar market.
The epoxy powder coating segment is expected to be the largest contributor to the laminated busbar market, by insulation material, during the forecast period
The epoxy powder coating segment is expected to dominate the laminated busbar market by insulation material. Epoxy powder-coated laminated busbars are mainly used for switchgear and motor drive applications. These properties make these laminated busbars increasingly preferred by end-use industries and are likely to drive their demand during the forecast period.
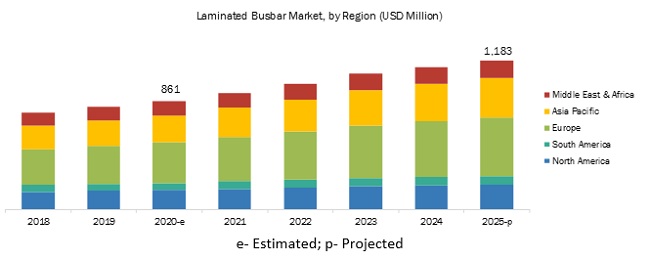
Europe is expected to be the largest laminated busbar market during the forecast period
In this report, the laminated busbar market has been analyzed with respect to five regions, namely, North America, Europe, Asia Pacific, South America, and Middle East & Africa. Europe is expected to dominate the laminated busbar market during the forecast period. Increasing power demand and growing construction activities are likely to drive the laminated busbar market in Europe.
Key Market Players
The major players in the laminated busbar market include Rogers (US), Amphenol (US), Mersen (France), Methode (US), and Sun.King Power Electronics (China).
Mersen (France) is one of the world’s leading providers of products and solutions related to electrical power and advanced materials. The company actively focuses on both organic and inorganic strategies to increase its global market share. For instance, in May 2018, Mersen acquired FTCap. This acquisition broadened the company’s current range of laminated busbars to capacitors. It was expected to strengthen Mersen’s power electronic systems product portfolio.
Another major player in the market is Rogers Corporation (US). The company opts for new product launches as its organic business strategy for increasing its clientele base globally. For instance, in April 2016, the company launched ROLINX CapEasy and ROLINX CapPerformance busbar assemblies of rating voltage 450–1,500 VDC and with a capacitance value of 75–1,600 microfarads.
Get online access to the report on the World's First Market Intelligence Cloud
- Easy to Download Historical Data & Forecast Numbers
- Company Analysis Dashboard for high growth potential opportunities
- Research Analyst Access for customization & queries
- Competitor Analysis with Interactive dashboard
- Latest News, Updates & Trend analysis
Request Sample Scope of the Report
Get online access to the report on the World's First Market Intelligence Cloud
- Easy to Download Historical Data & Forecast Numbers
- Company Analysis Dashboard for high growth potential opportunities
- Research Analyst Access for customization & queries
- Competitor Analysis with Interactive dashboard
- Latest News, Updates & Trend analysis

|
Report Metric |
Details |
|
Market size available for years |
2018–2025 |
|
Base year considered |
2019 |
|
Forecast period considered |
2020–2025 |
|
Forecast units |
Value (USD) |
|
Segments covered |
Material, end-user, insulation material, and region |
|
Geographies covered |
North America, Europe, Asia Pacific, Middle East & Africa, and South America |
|
Key companies covered |
Rogers (US), Amphenol (US), Mersen (France), Methode (US), and Sun.King Power Electronics (China) |
This research report categorizes the laminated busbar market by material, end-user, insulation material, and region.
By Material
- Copper
- Aluminum
By End-User
- Utilities
- Industrial
- Commercial
- Residential
By Insulation Material
- Epoxy Powder Coating
- Polyester Film
- PVF Film
- Polyester Resin
- Heat-Resistant Fiber
- Polyimide Film
By Region
- North America
- Europe
- Asia Pacific
- Middle East & Africa
- South America
Recent Developments
- In June 2018, Methode Electronics introduced ROLINX CapLink Solutions. In this solution, capacitors are united to a laminated busbar, which is ideal for power management applications.
- In May 2018, Mersen acquired FTCap. This acquisition broadened the company’s current range of laminated busbars to capacitors. It was expected to strengthen Mersen’s power electronic systems product portfolio.
- In April 2018, Mersen acquired Idealec SAS. This acquisition strengthened the company’s electrical power segment and expanded its client portfolio. The company would also benefit from Idealec SAS R&D and innovation capabilities in the busbar segment.
Key Questions Addressed by the Report
- What are the industry trends that will be seen over the next 5 years?
- Which of the laminated busbar market material will lead by 2025?
- Which of the application segment will have the maximum opportunity to grow during the forecast period?
- Which will be the leading region with the highest market share by 2025?
- How are companies implementing organic and strategies to gain increased market share?
To speak to our analyst for a discussion on the above findings, click Speak to Analyst
Table of Contents
1 Introduction (Page No. - 17)
1.1 Objectives of the Study
1.2 Definition
1.2.1 Laminated Busbar Market, By Material: Inclusions & Exclusions
1.2.2 Laminated Busbar Market, By End-User: Inclusions & Exclusions
1.3 Market Scope
1.3.1 Market Segmentation
1.3.2 Regional Scope
1.4 Years Considered for the Study
1.5 Currency
1.6 Limitations
1.7 Stakeholders
2 Research Methodology (Page No. - 22)
2.1 Research Data
2.1.1 Secondary Data
2.1.1.1 Key Data From Secondary Sources
2.1.2 Primary Data
2.1.2.1 Key Data From Primary Sources
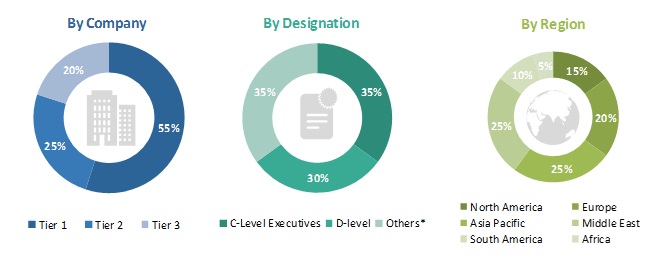
2.1.2.2 Breakdown of Primaries
2.2 Scope
2.3 Market Size Estimation
2.3.1 Supply-Side Analysis
2.3.1.1 Assumptions
2.3.1.1.1 Key Primary Insights
2.3.1.2 Calculation
2.3.2 Demand-Side Analysis
2.3.3 Forecast
2.4 Market Breakdown and Data Triangulation
2.5 Some of the Insights of Industry Experts
3 Executive Summary (Page No. - 29)
4 Premium Insights (Page No. - 33)
4.1 Attractive Opportunities in the Laminated Busbar Market
4.2 Market, By Material
4.3 Market, By End-User
4.4 European Market, By Insulation Material & Country, 2019
4.5 Market, By Region
5 Market Overview (Page No. - 36)
5.1 Introduction
5.2 Market Dynamics
5.2.1 Drivers
5.2.1.1 Demand for Safe and Secure Electrical Distribution Systems
5.2.1.2 Cost-Efficiency and Operational Benefits of Laminated Busbars
5.2.1.3 Increasing Focus on Renewable Energy
5.2.2 Restraints
5.2.2.1 Growing Competition From the Unorganized Sector
5.2.3 Opportunities
5.2.3.1 Aging Electrical Infrastructure and Rising Electricity Demand
5.2.3.2 Adoption of the High-Voltage Direct Current (HVDC) Technology
5.2.4 Challenges
5.2.4.1 Volatility of Raw Material Prices, Especially Copper
5.2.4.2 Delay in Grid Expansion Projects
6 Laminated Busbar Market, By Material (Page No. - 41)
6.1 Introduction
6.2 Copper
6.2.1 Ability to Withstand Load Surges is Expected to Drive the Segment
6.3 Aluminum
6.3.1 Cost-Efficiency of Aluminum-Laminated Busbars is Expected to Drive Their Demand in Price-Sensitive Regions
7 Laminated Busbar Market, By End-User (Page No. - 45)
7.1 Introduction
7.2 Utilities
7.2.1 Increasing Spending in Power Infrastructure Development is Expected to Drive the Laminated Busbar Market
7.3 Industrial
7.3.1 Rising Need for Reliable Power Supply in Industries is Expected to Drive the Market
7.4 Commercial
7.4.1 Operational Benefits Such as Low-Noise and Reliable Power Supply are Expected to Drive the Demand for Laminated Busbars
7.5 Residential
7.5.1 Increasing Focus on Energy-Efficiency in the Residential Sector is Expected to Drive the Demand for Laminated Busbars
8 Laminated Busbar Market, By Insulation Material (Page No. - 50)
8.1 Introduction
8.2 Epoxy Powder Coating
8.2.1 Demand for Cost-Effective Busbars for Switchgears and Motor Drive Applications is Likely to Drive the Market
8.3 Polyester Film
8.3.1 Increasing Demand for Polyester Films Across Industries is Expected to Drive the Market
8.4 PVF Film
8.4.1 Low Cost of PVF Films is Expected to Drive Their Demand in the Market
8.5 Polyester Resin
8.5.1 High Durability of Polyester Resins is Expected to Drive Their Demand in the Market
8.6 Heat-Resistant Fiber
8.6.1 High Resistance to Heat is Expected to Boost the Demand for Heat-Resistant Fiber-Insulated Laminated Busbars in Heavy-Duty Applications
8.7 Polyimide Film
8.7.1 Excellent Heat-Resistance Property is Likely to Drive the Demand for Polyimide Film-Insulated Laminated Busbars
9 Laminated Busbar Market, By Region (Page No. - 57)
9.1 Introduction
9.2 North America
9.2.1 By Material
9.2.2 By End-User
9.2.3 By Insulation Material
9.2.4 By Country
9.2.4.1 US
9.2.4.1.1 Planned Investment in Grid Modernization, Transmission & Distribution Infrastructure, and Construction Sector are Expected to Drive the Demand for Laminated Busbars
9.2.4.2 Canada
9.2.4.2.1 Investment in Electric Vehicle Infrastructure and Growth in Renewable Energy Sources Installation are Expected to Drive the Market
9.2.4.3 Mexico
9.2.4.3.1 Increasing Investments for Developing the Power Infrastructure are Likely to Drive the Market
9.3 Europe
9.3.1 By Material
9.3.2 By End-User
9.3.3 By Insulation Material
9.3.4 By Country
9.3.4.1 UK
9.3.4.1.1 Increasing Power Demand and Expanding Power Distribution Network are Likely to Drive the Market
9.3.4.2 Germany
9.3.4.2.1 Renewable Energy Capacity Development Supported By Smart Grid Development is Driving the Market
9.3.4.3 Russia
9.3.4.3.1 Need for Upgrading Aging Power Infrastructure and Investments in Energy Projects are Likely to Drive the Market
9.3.4.4 France
9.3.4.4.1 Increasing Investments in Renewable Energy Generation Projects are Likely to Boost the Demand for Laminated Busbars
9.3.4.5 Rest of Europe
9.4 Asia Pacific
9.4.1 By Material
9.4.2 By End-User
9.4.3 By Insulation Material
9.4.4 By Country
9.4.4.1 China
9.4.4.1.1 Increased Government Spending in Power Generation Projects and Renewable Energy Projects is Contributing to the Growth of the Market
9.4.4.2 Japan
9.4.4.2.1 Increasing Investments in Renewable Energy Projects and Infrastructure Development are Likely to Create Lucrative Opportunities for the Market
9.4.4.3 India
9.4.4.3.1 Increasing Government Initiatives to Upgrade the Existing Power Grids and Rising Electricity Demand are Likely to Boost the Market
9.4.4.4 South Korea
9.4.4.4.1 Increasing Renewable Energy Infrastructure Developments are Likely to Boost the Demand for Laminated Busbars
9.4.4.5 Rest of Asia Pacific
9.5 South America
9.5.1 By Material
9.5.2 By End-User
9.5.3 By Insulation Material
9.5.4 By Country
9.5.4.1 Brazil
9.5.4.1.1 Robust Transmission & Distribution Infrastructural Development and Increased Demand for Renewable Energy are Likely to Boost the Demand for Laminated Busbars
9.5.4.2 Argentina
9.5.4.2.1 Growing Demand for Power and Increasing Investments in Renewables are Expected to Drive the Market
9.5.4.3 Rest of South America
9.6 Middle East & Africa
9.6.1 By Material
9.6.2 By End-User
9.6.3 By Insulation Material
9.6.4 By Country
9.6.4.1 Saudi Arabia
9.6.4.1.1 Increasing Investments in Power Generation Projects are Driving the Market in Saudi Arabia
9.6.4.2 UAE
9.6.4.2.1 Rising Investments in the Construction Sector are Likely to Drive the Market
9.6.4.3 Qatar
9.6.4.3.1 Increasing Investments in Renewable Energy and Infrastructure Development are Expected to Drive the Market
9.6.4.4 South Africa
9.6.4.4.1 Increasing Demand for Power is Likely to Boost the Growth of the Market in South Africa
9.6.4.5 Rest of Middle East & Africa
10 Competitive Landscape (Page No. - 92)
10.1 Introduction
10.2 Competitive Leadership Mapping
10.2.1 Visionary Leaders
10.2.2 Innovators
10.2.3 Dynamic Differentiators
10.2.4 Emerging Players
10.3 Market Share Analysis, 2018
10.4 Competitive Scenario
10.4.1 New Product Launches
10.4.2 Contracts & Agreements
10.4.3 Investments & Expansions
10.4.4 Mergers & Acquisitions
11 Company Profiles (Page No. - 99)
(Business Overview, Products Offered, Recent Developments, SWOT Analysis, and MnM View)*
11.1 Amphenol
11.2 Methode Electronics
11.3 Mersen
11.4 Rogers
11.5 Sun.King Power Electronics
11.6 Zhuzhou CRRC Times Electric
11.7 Ryoden
11.8 Shanghai Eagtop Electronic Technology
11.9 Shenzhen Busbar Sci-Tech Development
11.10 Storm Power Components
11.11 Suzhou West Deane Machinery
11.12 Electronic Systems Packaging
11.13 Jans Copper
11.14 Molex
11.15 Shenzhen Woer New Energy Electrical Technology
11.16 Raychem Rpg
11.17 Zhejiang Rhi Electric
11.18 Segue Electronics
11.19 Kinto Electric
11.20 EMS Industrial & Service
*Details on Business Overview, Products Offered, Recent Developments, SWOT Analysis, and MnM View Might Not be Captured in Case of Unlisted Companies.
12 Appendix (Page No. - 135)
12.1 Insights of Industry Experts
12.2 Discussion Guide
12.3 Knowledge Store: Marketsandmarkets’ Subscription Portal
12.4 Available Customizations
12.5 Related Reports
12.6 Author Details
List of Tables (82 Tables)
Table 1 Laminated Busbar Market: Industry/Country-Wise Analysis
Table 2 Market Snapshot
Table 3 All Industry Equipment Failure Rate
Table 4 Solar and Wind Renewable Energy Targets By Major Countries
Table 5 Market Size, By Material, 2018–2025 (USD Million)
Table 6 Copper: Market Size, By Region, 2018–2025 (USD Million)
Table 7 Aluminum: Market Size, By Region, 2018–2025 (USD Million)
Table 8 Market Size, By End-User, 2018–2025 (USD Million)
Table 9 Utilities: Market Size, By Region, 2018–2025 (USD Million)
Table 10 Industrial: Market Size, By Region, 2018–2025 (USD Million)
Table 11 Commercial: Market Size, By Region, 2018–2025 (USD Million)
Table 12 Residential: Market Size, By Region, 2018–2025 (USD Million)
Table 13 Market Size, By Insulation Material, 2018–2025 (USD Million)
Table 14 Epoxy Powder Coating: Market Size, By Region, 2018–2025 (USD Million)
Table 15 Polyester Film: Market Size, By Region, 2018–2025 (USD Million)
Table 16 PVF Film: Market Size, By Region, 2018–2025 (USD Million)
Table 17 Polyester Resin: Market Size, By Region, 2018–2025 (USD Million)
Table 18 Heat-Resistant Fiber: Market Size, By Region, 2018–2025 (USD Million)
Table 19 Polyimide Film: Market Size, By Region, 2018–2025 (USD Million)
Table 20 Laminated Busbar Market Size, By Region, 2018–2025 (USD Million)
Table 21 North America: Market Size, By Material, 2018–2025 (USD Million)
Table 22 North America: Market Size, By End-User, 2018–2025 (USD Million)
Table 23 North America: Market Size, By Insulation Material, 2018–2025 (USD Million)
Table 24 North America: Market Size, By Country, 2018–2025 (USD Million)
Table 25 US: Market Size, By Material, 2018–2025 (USD Million)
Table 26 US: Market Size, By End-User, 2018–2025 (USD Million)
Table 27 Canada: Market Size, By Material, 2018–2025 (USD Million)
Table 28 Canada: Market Size, By End-User, 2018–2025 (USD Million)
Table 29 Mexico: Market Size, By Material, 2018–2025 (USD Million)
Table 30 Mexico: Market Size, By End-User, 2018–2025 (USD Million)
Table 31 Europe: Market Size, By Material, 2018–2025 (USD Million)
Table 32 Europe: Market Size, By End-User, 2018–2025 (USD Million)
Table 33 Europe: Market Size, By Insulation Material, 2018–2025 (USD Million)
Table 34 Europe: Market Size, By Country, 2018–2025 (USD Million)
Table 35 UK: Market Size, By Material, 2018–2025 (USD Million)
Table 36 UK: Market Size, By End-User, 2018–2025 (USD Million)
Table 37 Germany: Market Size, By Material, 2018–2025 (USD Million)
Table 38 Germany: Market Size, By End-User, 2018–2025 (USD Million)
Table 39 Russia: Market Size, By Material, 2018–2025 (USD Million)
Table 40 Russia: Market Size, By End-User, 2018–2025 (USD Million)
Table 41 France: Market Size, By Material, 2018–2025 (USD Million)
Table 42 France: Market Size, By End-User, 2018–2025 (USD Million)
Table 43 Rest of Europe: Market Size, By Material, 2018–2025 (USD Million)
Table 44 Rest of Europe: Market Size, By End-User, 2018–2025 (USD Million)
Table 45 Asia Pacific: Market Size, By Material, 2018–2025 (USD Million)
Table 46 Asia Pacific: Market Size, By End-User, 2018–2025 (USD Million)
Table 47 Asia Pacific: Market Size, By Insulation Material 2018–2025 (USD Million)
Table 48 Asia Pacific: Market Size, By Country, 2018–2025 (USD Million)
Table 49 China: Market Size, By Material, 2018–2025 (USD Million)
Table 50 China: Market Size, By End-User, 2018–2025 (USD Million)
Table 51 Japan: Market Size, By Material, 2018–2025 (USD Million)
Table 52 Japan: Market Size, By End-User, 2018–2025 (USD Million)
Table 53 India: Market Size, By Material, 2018–2025 (USD Million)
Table 54 India: Market Size, By End-User, 2018–2025 (USD Million)
Table 55 South Korea: Market Size, By Material, 2018–2025 (USD Million)
Table 56 South Korea: Market Size, By End-User, 2018–2025 (USD Million)
Table 57 Rest of Asia Pacific: Market Size, By Material, 2018–2025 (USD Million)
Table 58 Rest of Asia Pacific: Market Size, By End-User, 2018–2025 (USD Million)
Table 59 South America: Market Size, By Material, 2018–2025 (USD Million)
Table 60 South America: Market Size, By End-User, 2018–2025 (USD Million)
Table 61 South America: Market Size, By Insulation Material, 2018–2025 (USD Million)
Table 62 South America: Market Size, By Country, 2018–2025 (USD Million)
Table 63 Brazil: Market Size, By Material, 2018–2025 (USD Million)
Table 64 Brazil: Market Size, By End-User, 2018–2025 (USD Million)
Table 65 Argentina: Market Size, By Material, 2018–2025 (USD Million)
Table 66 Argentina: Market Size, By End-User, 2018–2025 (USD Million)
Table 67 Rest of South America: Market Size, By Material, 2018–2025 (USD Million)
Table 68 Rest of South America: Market Size, By End-User, 2018–2025 (USD Million)
Table 69 Middle East & Africa: Market Size, By Material, 2018–2025 (USD Million)
Table 70 Middle East & Africa: Market Size, By End-User, 2018–2025 (USD Million)
Table 71 Middle East & Africa: Market Size, By Insulation Material, 2018–2025 (USD Million)
Table 72 Middle East & Africa: Market Size, By Country, 2018–2025 (USD Million)
Table 73 Saudi Arabia: Market Size, By Material, 2018–2025 (USD Million)
Table 74 Saudi Arabia: Market Size, By End-User, 2018–2025 (USD Million)
Table 75 UAE: Market Size, By Material, 2018–2025 (USD Million)
Table 76 UAE: Market Size, By End-User, 2018–2025 (USD Million)
Table 77 Qatar: Market Size, By Material, 2018–2025 (USD Million)
Table 78 Qatar: Market Size, By End-User, 2018–2025 (USD Million)
Table 79 South Africa: Market Size, By Material, 2018–2025 (USD Million)
Table 80 South Africa: Market Size, By End-User, 2018–2025 (USD Million)
Table 81 Rest of Middle East & Africa: Market Size, By Material, 2018–2025 (USD Million)
Table 82 Rest of Middle East & Africa: Market Size, By End-User, 2018–2025 (USD Million)
List of Figures (35 Figures)
Figure 1 Laminated Busbar Market: Research Design
Figure 2 Research Methodology: Revenue Estimation Illustration of a Laminated Busbar Company (2018)
Figure 3 Data Triangulation Methodology
Figure 4 Copper Segment is Expected to Hold the Largest Share of the Market, By Material, During the Forecast Period
Figure 5 Utilities Segment is Expected to Lead the Market, By End-User, During the Forecast Period
Figure 6 Epoxy Powder Coating Segment is Expected to Lead the Market, By Insulation Material, During the Forecast Period
Figure 7 Europe Dominated the Market (By Value) in 2019
Figure 8 Demand for Safe and Secure Electrical Distribution Systems, Cost-Efficiency and Operational Benefits of Laminated Busbars, and Focus on Renewable Energy are Expected to Drive the Market, 2020–2025
Figure 9 Copper Segment is Projected to Dominate the Market, By Material, Until 2025
Figure 10 Utilities Segment is Expected to Dominate the Market, By End-User, Until 2025
Figure 11 Epoxy Powder Coating Segment and Germany Dominated the European Market in 2019
Figure 12 Asia Pacific Market is Expected to Grow at the Highest CAGR During the Forecast Period
Figure 13 Market: Drivers, Restraints, Opportunities, and Challenges
Figure 14 Copper (Lme) Price Trend (In USD Per Metric Ton), January 2016–October 2019
Figure 15 Market (Value), By Material, 2019
Figure 16 Market (Value), By End-User, 2019
Figure 17 Market (Value), By Insulation Material, 2019
Figure 18 Regional Snapshot: Asia Pacific Market is Expected to Grow at the Highest CAGR During the Forecast Period
Figure 19 Market Share (Value), By Region, 2019
Figure 20 Europe: Regional Snapshot
Figure 21 Asia Pacific: Regional Snapshot
Figure 22 Key Developments in the Market, During January 2016–November 2019
Figure 23 Laminated Busbar Market (Global) Competitive Leadership Mapping, 2019
Figure 24 Market Share Analysis, 2018
Figure 25 Amphenol: Company Snapshot
Figure 26 Amphenol: SWOT Analysis:
Figure 27 Methode Electronics: Company Snapshot
Figure 28 Methode Electronics: SWOT Analysis
Figure 29 Mersen: Company Snapshot
Figure 30 Mersen: SWOT Analysis
Figure 31 Rogers: Company Snapshot
Figure 32 Rogers: SWOT Analysis
Figure 33 Sun.King Power Electronics: Company Snapshot
Figure 34 Sun.King Power Electronics: SWOT Analysis
Figure 35 Zhuzhou CRRC Times Electric: Company Snapshot
This study involved four major activities in estimating the current size of the laminated busbar market. Exhaustive secondary research was done to collect information on the market, the peer market, and the parent market. The next step was to validate these findings, assumptions, and market sizing with industry experts across the value chain through rigorous primary research. Both top-down and bottom-up approaches were used to estimate the total market size. The market breakdown and data triangulation techniques were employed to estimate the market size of the segments and the corresponding subsegments.
Secondary Research
This research study involved the use of extensive secondary sources, directories, and databases such as power data, industry publications, several newspaper articles, Statista Industry Journal, Factiva, and laminated busbar journal to identify and collect information useful for a technical, market-oriented, and commercial study of the laminated busbar market. The other secondary sources included annual reports, press releases & investor presentations of companies, white papers, certified publications, articles by recognized authors, manufacturer associations, trade directories, and databases.
Primary Research
The laminated busbar market comprises several stakeholders such as companies related to the industry, consulting companies in the power sector, power companies, government & research organizations, organizations, forums, alliances & associations, laminated busbar service providers, state & national energy authorities, dealers & suppliers, and vendors. The demand side of the market is characterized by the laminated busbar expenditure across regions, investments by key power companies, and maturing of the renewable energy sector. The demand is also driven by a change in rules and regulations, and active participation from environmental bodies have pushed the laminated busbar market. The supply side is characterized by the contracts & agreements, new product launches, investments & expansions, and partnerships & collaborations among big players. Various primary sources from both the supply and demand sides of the market were interviewed to obtain qualitative and quantitative information. The breakdown of primary respondents is given below:
Market Size Estimation
Both top-down and bottom-up approaches have been used to estimate and validate the size of the global laminated busbar market and its dependent submarkets. These methods were also extensively used to estimate the size of various subsegments in the market. The research methodology used to estimate the market size includes the following:
- The key players in the industry and demand have been identified through extensive secondary research, and their market shares in the respective regions have been determined through both primary and secondary research.
- The industry’s supply chain and market size, in terms of value, have been determined through primary and secondary research processes.
- All percentage shares, splits, and breakdowns have been determined using secondary sources and verified through primary sources.
Data Triangulation
After arriving at the overall market size—using the market size estimation processes as explained above—the market was split into several segments and subsegments. To complete the entire market engineering process and arrive at the exact statistics of each market segment and subsegment, the data triangulation, and market breakdown procedures were employed, wherever applicable. The data was triangulated by studying various factors and trends from both the demand and supply sides in laminated busbar activities.
Report Objectives
- To define, describe, segment, and forecast the laminated busbar market based on material, end-user, insulation material, and region
- To provide detailed information on the major factors influencing the growth of the market (drivers, restraints, opportunities, and challenges)
- To strategically analyze the laminated busbar market with respect to individual growth trends, future expansions, and contribution of each segment to the market
- To analyze market opportunities for stakeholders and details of the competitive landscape for market leaders
- To forecast the growth of the laminated busbar market with respect to the main regions (Asia Pacific, Europe, North America, South America, and the Middle East & Africa)
- To strategically profile key players and comprehensively analyze their market ranking and core competencies
- To track and analyze competitive developments such as contracts & agreements, investments & expansions, new product developments, and mergers & acquisitions in the laminated busbar market
Available Customizations:
With the given market data, MarketsandMarkets offers customizations as per the client’s specific needs. The following customization options are available for this report:
Regional Analysis
- Further breakdown of the regions and country-specific analysis
- Further country-specific breakdown of industrial subsegment in the manufacturing and processing industry, food & beverage industry, and other industries
Company Information
- Detailed analyses and profiling of additional market players (up to five)


Growth opportunities and latent adjacency in Laminated Busbar Market
Hi. We want to avail market opportunities in laminated and powder-costed busbar products. Kindly assist.