Machine Safety Market

Machine Safety Market Size, Share and Industry Growth Analysis Report by Component (Presence detection Sensors, Safety Controllers/Modules/Relays, Programmable Safety Systems, Emergency Stop Controls, Two-Hand Safety Controls), offerings, Industry & Region - Global Growth Driver and Industry Forecast to 2028

Report Code: SE 2053 Apr, 2023, by marketsandmarkets.com

Machine Safety Market

Machine Safety Market and Top Companies

  • Schneider Electric offers a diversified machine safety solutions under its Industrial Automation business segment. The company provides SIL 3 function safety solutions that ensure the fail-safe performance of controllers for energize-to-trip and de-energize-to-trip applications. Triconex, a brand of Schneider Electric, provides Trident safety instrumented systems with SIL 3 certification. These safety systems feature high scalability, with applications as low as 32 I/O points per system to as high as 40,000 I/O points. Schneider Electric has a strong portfolio of machine safety-certified emergency stop devices and safety instrumented systems.
  • Honeywell offers a wide range of solutions related to machine safety through its Safety and Productivity segment. The company offers safety systems and solutions such as integrated control and safety systems, distributed control systems, control monitoring and safety systems, and industrial wireless solutions in the control, monitoring, and safety systems category. The company has recently launched various products to diversify its machine safety product portfolio. The launches are a result of extensive R&D conducted by the company.
  • ABB is one of the leader in power and automation technology companies. It focuses on increasing profitability by strengthening competitiveness, driving organic growth, and lowering risks. ABB has launched the innovation & expansion plan (PIE) to drive profitable growth for its businesses. The company is primarily focusing on organic growth through product launches and developments and expansion of its safety product portfolio.
  • Siemens is mainly engaged in the electrical engineering and electronics business. The company is a leading supplier of power transmission, power generation, and infrastructure solutions, coupled with automation, drive, and software solutions. Company provides machine safety-certified SIL-rated products for pressure, temperature, flow, and level measurements for both process and factory automation. It has also launched various innovative machine safety solutions. Safety technology products offered by the company comply with the latest safety standards and have been certified for international applicability. The SIRIUS portfolio of the company features 2 safe evaluation devices—safety relays and modular safety systems.
  • Rockwell Automation is a leading provider of industrial automation and information solutions. The company offers a diverse set of products and services, including industrial control components, information software, sensing devices, and industrial security solutions. Rockwell Automation offers machine safety solutions through its Control Products & Solutions segment. The company offers machine safety products such as safety connection systems, safety drives, safety I/O modules, emergency stop devices, presence sensing safety devices, safety programmable controllers, safety relays, and safety switches.

Machine Safety Market Component


  • Presense Sensing Safety Sensors: Sensor deployed in a safety system are developed and designed to ensure a safe output based on the signals received from the logic circuits. Safety edges, laser scanners, safety light curtains, safety mats, and optoelectronic devices (including hand detection and single & multi-beam) are some of the types of presence sensing sensors.
  • Programmable safety systems: Programmable safety systems are highly reliable logic solvers, which provide both fail-safe and fault-tolerant operations. The market for programmable safety systems is anticipated to grow at a fast rate in the coming years as manufacturers are replacing the existing systems with PLCs to comply with strict machine safety regulatory standards. Programmable safety systems are an integral part of safety instrumented systems.
  • Safety controllers/modules/relays: Numerous safety devices in machine safety require safety controllers/modules/relays to shut down equipment in case of any emergency. Safety relays are devices that implement safety functions. It provides the means to effectively and quickly remove power from machines or equipment in case of an emergency shutdown situation, thereby reducing risks to an acceptable level.
  • Safety interlock switches: Safety interlock switches are designed to protect operators and equipment in automation plants. Electromechanical, hinge pin, limit, non-contact, tongue, and trapped key are the different types of safety interlock switches. These components are intended to protect equipment and end users from injuries during critical situations. They prevent the restart of a shutdown piece of equipment until the fault that caused the shutdown is corrected.
  • Emergency stop controls: Emergency stop controls are crucial elements of the safety-related parts of control systems. These devices provide workers a means of stopping a device during an emergency by pushing a button or pulling a rope. The different types of emergency stop devices include emergency stop buttons, rope pull switches, and flush mount E-stops.

Machine Safety Market Technology Trends


  • Computer Vision: Computer vision helps in automating production processes by controlling different devices. The use of computer vision increases efficiency as it eliminates the requirement of workers in hazardous areas. For example, in the packaging process, computer vision, with the help of barcodes, analyzes products, classifies them, and packages them.
  • Internet of Things (IoT): The use of IoT enables analysis of workplace conditions and helps in keeping workers safer and healthy. IoT analyzes the exposure of workers in hazardous conditions and determines the acceptable limit for exposure levels. Compliance with regulations can be maintained with the help of IoT by monitoring compliance requirements and ensuring its adherence. With the help machine learning algorithm, IoT analyzes data, and checks the pattern of work performed in the plant.
  • Machine Learning: The use of automated machine learning in terms of providing safety to workers and machines is currently trending in the industrial sector. It eliminates the need for any worker in hazardous areas for detecting errors and notifying the user of any abnormalities in the functioning. This helps in reducing processing time and provides safety in the plant.

Updated on : May 30, 2023

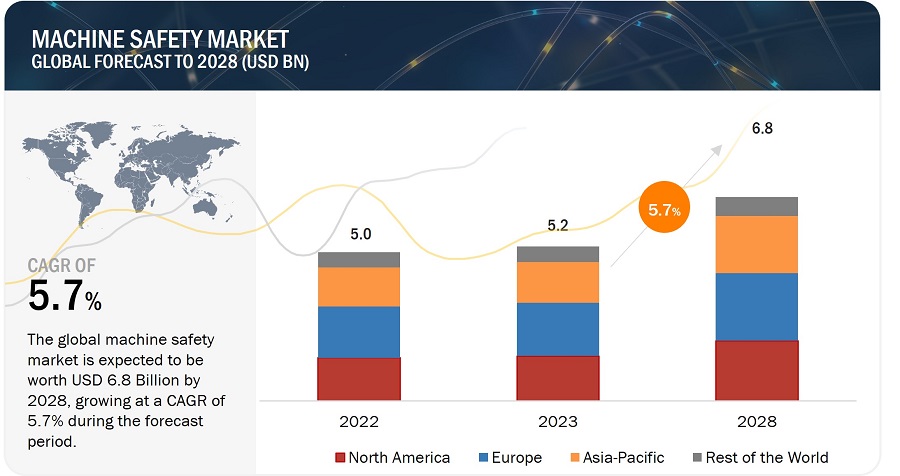
[251 Pages Report] The global machine safety market in terms of revenue was estimated to be worth USD 5.2 billion in 2023 and is poised to reach USD 6.8 billion by 2028, growing at a CAGR of 5.7% from 2023 to 2028. The new research study consists of an industry trend analysis of the market.

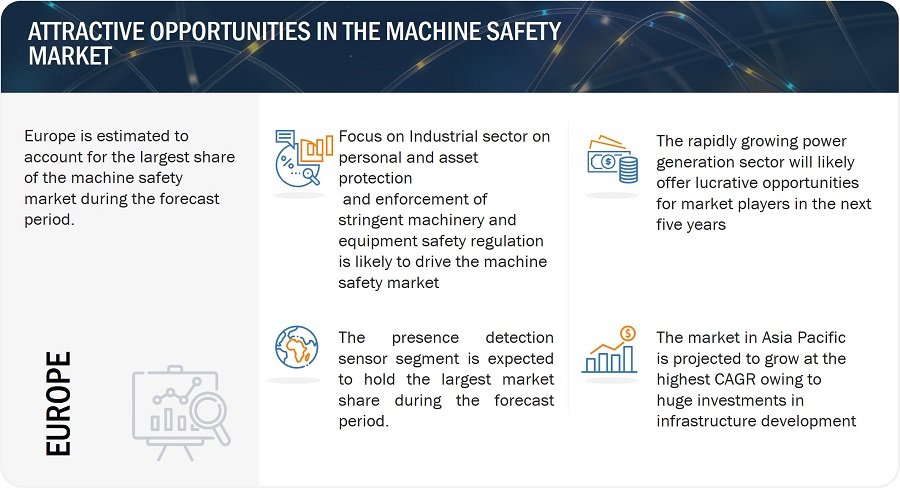
Implementing machine safety ensures that safety-critical control and protective systems are appropriately specified, designed, installed, and maintained. Safety devices such as sensors, programmable safety systems, and final elements are integral to safety instrumented systems and industrial control systems. Increasing emphasis on ensuring workplace safety in oil & gas, power generation, food & beverages, automotive, and chemicals industries would increase the demand for machine safety systems in the coming years.
Machine Safety Market

Machine Safety Market

Machine Safety Market Forecast to 2028

To know about the assumptions considered for the study, Request for Free Sample Report

Growing demand for safety systems in high-risk industries such as oil and gas, chemical, and mining, where the potential for accidents and injuries is higher. All these factors combined are fueling the growth of the machine safety market, which is expected to continue in the coming years.

Market Dynamics

Driver: Increasing demand for modular end effectors by various industries

The industrial sector has long been known for its potential hazards and risks to personnel and assets. With increasing accidents and fatalities caused by machine-related incidents, businesses have started focusing on personnel and asset protection. This trend is driven by several other factors, including the need to comply with government regulations and avoid legal liabilities and the desire to improve workplace safety and productivity. Companies are adopting advanced industrial safety-certified systems in their production lines to reduce industrial accidents. These safety systems, such as physical barriers and safety interlocks, safeguard operators/users from accidents, prevent or minimize the risk of injury or harm, and offer an emergency shutdown solution in case of breakdown or downtime. Manufacturers are increasingly adopting industrial safety products, such as emergency shutdown devices and safety controller modules, to prevent the probability of occurrence of any possible accident and provide an added layer of protection for personnel and assets. Owing to this, process industries are adopting several security technologies and equipment that help reduce workplace accidents. Thus, rising emphasis on implementing proactive safety measures to prevent accidents drives the growth of the machine safety market.

Restraint: Huge capital requirement to install and automate machine safety systems

In an emergency, machine safety systems must be installed to safeguard employees, machines, and production lines. However, the installation, maintenance, and repair costs of machine safety components substantially burden the organization's budget. Though large organizations can manage these expenses, it can be difficult for small and mid-sized organizations. In addition, industrial safety has to comply with regulatory standards. The safety standards are frequently updated according to technological advancements and new mandates, resulting in the obligation on organizations to upgrade their safety systems, incurring additional costs. Usually, investments toward safety equipment are never considered in budget allocations while building plants and production facilities. However, the installation and maintenance of industrial safety systems add a substantial economic burden, restraining the growth of the machine safety market.

Opportunity: Rising use of IIoT to ensure improved performance and extend lifespan of industrial assets

IIoT can provide real-time data on the performance and condition of industrial assets, enabling predictive maintenance and reducing downtime. It helps companies manage their assets better, improve performance, and extend their lifespan. IIoT can also help improve workplace safety by providing real-time data on the condition of machines and equipment. This allows companies to identify potential safety hazards and take corrective/preventive actions before accidents occur. IIoT is offering new opportunities for integrated safety and compliance services. The technology can acquire sensor data and send the collected information to monitoring systems. The data is transmitted through wired and wireless networks that provide real-time analysis, alerts, and possible emergency solutions. Using IIoT, companies can integrate their processes with safety systems and monitor them in real time. Thus, IIoT facilitates quick monitoring, analysis and control, offering effective virtual physical system management, ultimately improving overall performance.

Challenge: Difficulties in designing machine safety products due to ongoing technological advancements

While technological advancements in machines can bring many benefits, they also pose challenges to machine safety. As machines become more advanced, they often become more complex, making it more challenging to ensure they are operating safely. Many modern machines rely on complex systems and software to operate, making integrating safety features into the machine design harder. With so many different types of advanced machines on the market, it can be difficult to establish consistent safety standards and guidelines that apply across various industries and regions. Overall, the continuous technological advances pose challenges for machine safety industry providers that must be addressed through ongoing research, innovation, and collaboration between industry stakeholders and safety regulators. By working together, manufacturers can ensure that advanced machines are designed and operated safely, protecting workers, and preventing accidents and injuries.

Machine Safety Market Ecosystem

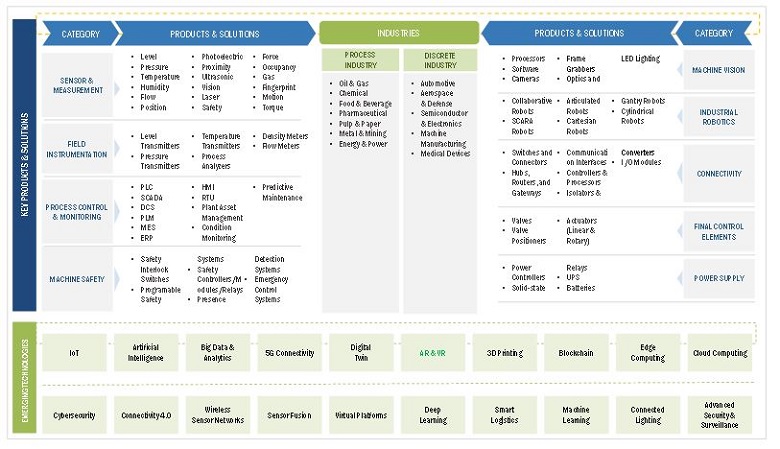
Component suppliers and system integrators have witnessed a decline in production activities. Consequently, OEMs have faced a shortage of essential components. The figure below shows the Machine Safety ecosystem.
Machine Safety Market by Ecosystem

System segment to hold largest market share in the year 2022

The machine safety market is experiencing rapid growth as the companies in this market strive to provide safety solutions for machinery and equipment to prevent accidents and injuries at workplaces. A variety of machine safety systems, such as safety controllers/modules/relays, programmable safety systems, safety interlock switches, and emergency stop controls, play a crucial role in protecting personnel and preventing accidents at industrial plants. These systems are constantly upgraded to ensure compliance with the latest safety standards and stay abreast of technology trends. These systems enable workers to carry out their duties safely and efficiently. Adopting safety standards such as ISO 13849 and IEC 61508, which require integrating safety systems into machinery and equipment, has been a driving force behind the growth of the machine safety market.

Programmable safety system segment to hold largest market share in the year 2022

In the forecast period, the programmable safety system is expected to experience the highest CAGR. This growth can be attributed to multiple factors, including the escalating requirement for safety automation across a variety of industries, the increasing demand for safety devices that can be more flexible and customizable, and the growing adoption of Industry 4.0 and Industrial Internet of Things (IIoT) technologies. Programmable safety systems offer several advantages such as enhanced flexibility, simpler customization, and superior integration with other industrial automation systems. Moreover, they allow remote monitoring and control, which can elevate safety levels and reduce the chances of accidents occurring. Overall, due to the rising need for safety automation and the advantages that programmable safety systems offer, these systems are expected to observe robust growth in the future.

Food & beverage industry is expected to register highest CAGR during the forecast period.

The machine safety market is set to experience significant growth in the food and beverage industry, with the highest CAGR projected in this sector. This growth can be attributed to several factors, including the rising demand for packaged and processed foods, the growing focus on ensuring worker safety in the food industry, and the strict safety regulations and standards imposed by regulatory agencies. Given the high-risk nature of the food and beverage industry, ensuring worker safety is crucial in this sector. To mitigate potential hazards associated with operating machinery and equipment, food manufacturers are increasingly adopting machine safety solutions. Moreover, the adoption of automation in the food industry has increased the demand for safety measures that can protect workers from potential risks. Overall, due to the rising demand for worker safety, the adoption of automation, and the need to comply with safety regulations and standards, the food and beverage industry is expected to drive significant growth in the machine safety market.
Machine Safety Market by Region

Machine Safety Market by Region

To know about the assumptions considered for the study, download the pdf brochure

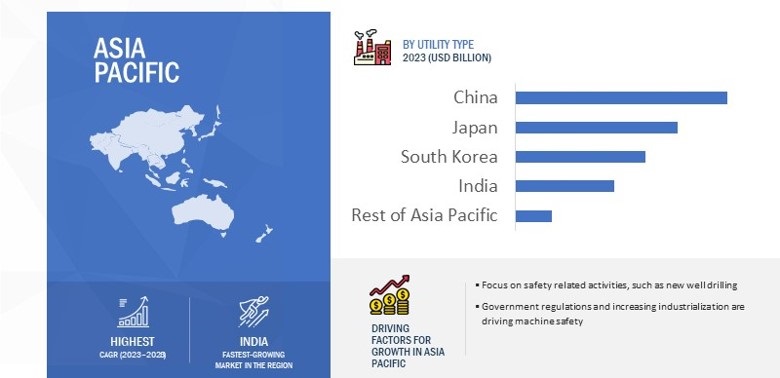
Asia Pacific to grow at highest CAGR during the forecast period

The Asia Pacific region is witnessing significant growth in the machine safety market, fueled by various factors. One key driver is government regulations mandating the implementation of safety measures, which is promoting the adoption of machine safety solutions. Furthermore, with the region's increasing industrialization, there is a growing need for safety systems to protect workers and equipment. The rise in awareness of worker safety and the implementation of Industry 4.0 technologies are also contributing to the demand for machine safety solutions. Overall, these factors are fueling the growth of the machine safety market in the Asia Pacific region.

Machine Safety Market Key Players

The machine safety companies have implemented various organic and inorganic growth strategies, such as product launches, collaborations, partnerships, and acquisitions, to strengthen their offerings in the market. The major players in the market are Schneider Electric (France), Honeywell International Inc (US), ABB (Switzerland), Rockwell Automation, Inc. (US), Siemens AG (Germany), Omron Corporation (Japan), Keyence Corporation (Japan), Yokogawa Electric Corporation (Japan), Emerson Electric Co. (US), and General Electric (US)

The study includes an in-depth competitive analysis of these key players in the Machine Safety market with their company profiles, recent developments, and key market strategies.

Get online access to the report on the World's First Market Intelligence Cloud

  • Easy to Download Historical Data & Forecast Numbers
  • Company Analysis Dashboard for high growth potential opportunities
  • Research Analyst Access for customization & queries
  • Competitor Analysis with Interactive dashboard
  • Latest News, Updates & Trend analysis
Request Sample

Scope of the Report

Segment

Subsegment

Estimated Market Size USD 5.2 Billion
Projected Market Size USD 6.8 Billion
Growth Rate 5.7%

Years Considered

2019–2028

Base Year Considered

2022

Forecast Period

2023–2028

Forecast Units

Value (USD Million/Billion)

Segments Covered

Offerings, Components, Industry, and Region

Regions Covered

North America, Asia Pacific, Europe, and the Rest of the World

Companies Covered

Emerson Electric Co. (US), Schneider Electric (France), Honeywell International Inc (US), Rockwell Automation, Inc. (US), and Siemens AG (Germany)
A total of 29 players covered

Machine Safety Market Highlights

This report has segmented the overall Machine Safety market based on Offerings, components, industry, and region.

Segment

Subsegment

By Offerings

  • Systems
  • Sensors

By Components

  • Presence detection Sensors
  •  Safety Controllers/Modules/Relays
  •  Programmable Safety Systems
  •  Safety Interlock Switches
  •  Emergency Stop Controls
  •  Two-Hand Safety Controls

By Industry

  • Process Industry
  • Discrete Industry

By Process Industry

  • Chemicals
  • Food & Beverages
  • Metals & Mining
  • Oil & Gas
  • Pharmaceuticals
  • Power Generation
  • Others Process Industries

By Discrete Industry

  • Aerospace
  • Automotive
  • Semiconductor & Electronics
  • Others Discrete Industries

By Region

  • North America
    • US
    • Canada
    • Mexico
  • Europe
    • UK
    • Germany
    • France
    • Rest of Europe
  • Asia Pacific
    • China
    • Japan
    • South Korea
    • India
    • Rest of Asia Pacific
  • Rest of the World
    • Middle East & Africa
    • South America

Recent Developments:

  • In May 2022, Emerson introduced the TopWorx DX PST with HART 7. The units enable the digital transformation of process applications by providing valuable valve data and diagnostic information. Operators can access vital valve data, trends, and diagnostics to anticipate and plan maintenance owing to the DX PST's seamless integration with current valves and control systems.
  • In October 2021, Emerson introduced valve assemblies that meet the design process requirements of Safety Integrity Level (SIL) 3 according to the International Electrotechnical Commission's IEC 61508 standard. These Fisher Digital Isolation final element solutions serve customers' needs for shutdown valves in critical safety instrumented system (SIS) applications.
  • In May 2021, Emerson introduced valve assemblies that meet the design process requirements of Safety Integrity Level (SIL) 3 according to the International Electrotechnical Commission's IEC 61508 standard. These Fisher Digital Isolation final element solutions serve customers' needs for shutdown valves in critical safety instrumented system (SIS) applications.

Frequently Asked Questions (FAQ):

To speak to our analyst for a discussion on the above findings, click Speak to Analyst

TABLE OF CONTENTS
 
1 INTRODUCTION (Page No. - 32)
    1.1 STUDY OBJECTIVES 
    1.2 MARKET DEFINITION AND SCOPE 
    1.3 INCLUSIONS AND EXCLUSIONS 
    1.4 STUDY SCOPE 
           1.4.1 MARKETS COVERED
           1.4.2 YEARS CONSIDERED
    1.5 CURRENCY CONSIDERED 
    1.6 LIMITATIONS 
    1.7 STAKEHOLDERS 
    1.8 SUMMARY OF CHANGES 
           1.8.1 RECESSION IMPACT
 
2 RESEARCH METHODOLOGY (Page No. - 37)
    2.1 RESEARCH DATA 
           FIGURE 1 MACHINE SAFETY MARKET: RESEARCH DESIGN
           2.1.1 SECONDARY DATA
                    2.1.1.1 Major secondary sources
                    2.1.1.2 Key data from secondary sources
           2.1.2 PRIMARY DATA
                    2.1.2.1 Breakdown of primaries
                    2.1.2.2 Key data from primary sources
           2.1.3 SECONDARY AND PRIMARY RESEARCH
                    2.1.3.1 Key industry insights
    2.2 MARKET SIZE ESTIMATION 
           FIGURE 2 MARKET SIZE ESTIMATION METHODOLOGY (SUPPLY SIDE): REVENUE FROM MACHINE SAFETY COMPONENTS
           2.2.1 BOTTOM-UP APPROACH
                    2.2.1.1 Bottom-up approach used to arrive at market size
                               FIGURE 3 MARKET SIZE ESTIMATION METHODOLOGY: BOTTOM-UP APPROACH
           2.2.2 TOP-DOWN APPROACH
                    2.2.2.1 Top-down approach used to arrive at market size
                               FIGURE 4 MARKET SIZE ESTIMATION METHODOLOGY: TOP-DOWN APPROACH
    2.3 MARKET BREAKDOWN AND DATA TRIANGULATION 
           FIGURE 5 MARKET BREAKDOWN AND DATA TRIANGULATION
    2.4 RESEARCH ASSUMPTIONS 
           FIGURE 6 ASSUMPTIONS FOR RESEARCH STUDY
    2.5 PARAMETERS CONSIDERED TO ANALYZE IMPACT OF RECESSION ON MACHINE SAFETY MARKET 
    2.6 RISK ASSESSMENT 
           TABLE 1 LIMITATIONS AND ASSOCIATED RISKS
 
3 EXECUTIVE SUMMARY (Page No. - 49)
    FIGURE 7 SYSTEMS SEGMENT TO HOLD LARGER MARKET SHARE IN 2023
    FIGURE 8 PRESENCE DETECTION SENSORS SEGMENT TO ACCOUNT FOR LARGEST MARKET SHARE IN 2023
    FIGURE 9 PROCESS INDUSTRY SEGMENT TO CAPTURE LARGER MARKET SHARE IN 2028
    FIGURE 10 POWER GENERATION SEGMENT TO HOLD LARGEST SHARE OF PROCESS INDUSTRIES IN MACHINE SAFETY MARKET IN 2023
    FIGURE 11 AEROSPACE SEGMENT TO HOLD LARGEST SHARE OF DISCRETE INDUSTRIES IN MACHINE SAFETY MARKET IN 2023
    FIGURE 12 ASIA PACIFIC TO BE FASTEST-GROWING MARKET DURING FORECAST PERIOD
 
4 PREMIUM INSIGHTS (Page No. - 54)
    4.1 ATTRACTIVE GROWTH OPPORTUNITIES FOR PLAYERS IN MACHINE SAFETY MARKET 
           FIGURE 13 THRIVING FOOD & BEVERAGE INDUSTRY TO CREATE LUCRATIVE OPPORTUNITIES FOR PLAYERS IN MACHINE SAFETY MARKET
    4.2 MACHINE SAFETY MARKET, BY OFFERING 
           FIGURE 14 SYSTEMS SEGMENT TO COMMAND MACHINE SAFETY MARKET THROUGHOUT FORECAST PERIOD
    4.3 MACHINE SAFETY MARKET, BY COMPONENT 
           FIGURE 15 PRESENCE DETECTION SENSORS SEGMENT TO CAPTURE MAJORITY OF MACHINE SAFETY MARKET SHARE IN 2028
    4.4 MACHINE SAFETY MARKET, BY INDUSTRY 
           FIGURE 16 PROCESS INDUSTRY SEGMENT TO EXHIBIT HIGHER CAGR IN MACHINE SAFETY MARKET DURING FORECAST PERIOD
    4.5 MACHINE SAFETY MARKET, BY PROCESS INDUSTRY 
           FIGURE 17 POWER GENERATION SEGMENT TO ACCOUNT FOR LARGEST MARKET SHARE FOR PROCESS INDUSTRIES IN 2023
    4.6 MACHINE SAFETY MARKET, BY DISCRETE INDUSTRY 
           FIGURE 18 AEROSPACE SEGMENT TO HOLD LARGEST MARKET SHARE FOR DISCRETE INDUSTRIES IN 2028
    4.7 MACHINE SAFETY MARKET, BY REGION 
           FIGURE 19 EUROPE TO HOLD LARGEST SHARE OF GLOBAL MACHINE SAFETY MARKET IN 2028
    4.8 MACHINE SAFETY MARKET, BY COUNTRY 
           FIGURE 20 US TO RECORD HIGHEST CAGR IN GLOBAL MACHINE SAFETY MARKET FROM 2023 TO 2028
 
5 MARKET OVERVIEW (Page No. - 58)
    5.1 INTRODUCTION 
    5.2 MARKET DYNAMICS 
           FIGURE 21 MACHINE SAFETY MARKET DYNAMICS
           5.2.1 DRIVERS
                    5.2.1.1 Focus of industrial sector on personnel and asset protection
                    5.2.1.2 Enforcement of stringent machinery and equipment safety regulations
                    5.2.1.3 Adoption of automation to improve efficiency and productivity
                               FIGURE 22 DRIVERS FOR MACHINE SAFETY MARKET AND THEIR IMPACT
           5.2.2 RESTRAINTS
                    5.2.2.1 Huge capital requirement to install and automate machine safety systems
                    5.2.2.2 Complexities associated with machine safety systems
                               FIGURE 23 RESTRAINTS FOR MACHINE SAFETY MARKET AND THEIR IMPACT
           5.2.3 OPPORTUNITIES
                    5.2.3.1 Increasing awareness about workplace safety standards in emerging economies
                    5.2.3.2 Rising use of IIoT to ensure improved performance and extend lifespan of industrial assets
                               FIGURE 24 OPPORTUNITIES FOR MACHINE SAFETY MARKET AND THEIR IMPACT
           5.2.4 CHALLENGES
                    5.2.4.1 Difficulties in designing machine safety products due to ongoing technological advancements
                    5.2.4.2 Failure to assess and anticipate all potential risks associated with machinery setup
                               FIGURE 25 CHALLENGES FOR MACHINE SAFETY MARKET AND THEIR IMPACT
    5.3 VALUE CHAIN ANALYSIS 
           FIGURE 26 MACHINE SAFETY VALUE CHAIN ANALYSIS
           5.3.1 RAW MATERIAL PROVIDERS
           5.3.2 COMPONENT MANUFACTURERS
           5.3.3 SYSTEM INTEGRATORS
           5.3.4 DISTRIBUTORS AND RETAILERS
           5.3.5 END-USER INDUSTRIES
           5.3.6 POST-SALES SERVICE PROVIDERS
    5.4 ECOSYSTEM MAPPING 
           FIGURE 27 GLOBAL MACHINE SAFETY MARKET: ECOSYSTEM
           TABLE 2 ROLE OF PLAYERS IN ECOSYSTEM
    5.5 PRICING ANALYSIS 
           5.5.1 AVERAGE SELLING PRICE OF MACHINE SAFETY COMPONENTS OFFERED BY MAJOR PLAYERS
                    FIGURE 28 AVERAGE SELLING PRICES OF COMPONENTS OFFERED BY KEY PLAYERS
                    TABLE 3 AVERAGE SELLING PRICE OF MACHINE SAFETY COMPONENTS PROVIDED BY KEY PLAYERS (USD)
                    TABLE 4 AVERAGE SELLING PRICES OF PROGRAMMABLE SAFETY SYSTEMS, BY REGION (USD)
    5.6 TRENDS/DISRUPTIONS IMPACTING CUSTOMER BUSINESS 
           FIGURE 29 TRENDS/DISRUPTION IMPACTING CUSTOMER BUSINESS
    5.7 PORTER’S FIVE FORCES ANALYSIS 
           FIGURE 30 MACHINE SAFETY MARKET: PORTER’S FIVE FORCES ANALYSIS
           TABLE 5 IMPACT OF PORTER’S FIVE FORCES ON MACHINE SAFETY MARKET
           5.7.1 THREAT OF NEW ENTRANTS
           5.7.2 THREAT OF SUBSTITUTES
           5.7.3 BARGAINING POWER OF SUPPLIERS
           5.7.4 BARGAINING POWER OF BUYERS
           5.7.5 INTENSITY OF COMPETITIVE RIVALRY
    5.8 CASE STUDY ANALYSIS 
           5.8.1 ELOPAK INSTALLS FULLY ASEPTIC FILLING MACHINE FOR GABLE TOP PACKAGING WITH ROBUST PNEUMATICS FROM EMERSON AVENTICS
           5.8.2 MP EQUIPMENT JOINS HANDS WITH ROCKWELL AUTOMATION SAFETY CONSULTANTS TO RE-EVALUATE PROTEIN PORTIONING MACHINE DESIGN
           5.8.3 MOLLART ENGINEERING SELECTS PROCTER MACHINE SAFETY’S ENCLOSED GUARDS TO INSTALL IN ITS MACHINE TOOLS
    5.9 TECHNOLOGY TRENDS 
           5.9.1 COMPUTER VISION
           5.9.2 AUTOMATED MACHINE LEARNING
           5.9.3 INTERNET OF THINGS
           5.9.4 VIRTUAL REALITY
    5.10 KEY STAKEHOLDERS AND BUYING CRITERIA 
           5.10.1 KEY STAKEHOLDERS IN BUYING PROCESS
                    FIGURE 31 INFLUENCE OF STAKEHOLDERS FROM TOP 3 INDUSTRIES ON BUYING PROCESS
                    TABLE 6 INFLUENCE OF STAKEHOLDERS FROM TOP 3 INDUSTRIES ON BUYING MACHINE SAFETY SYSTEMS
           5.10.2 BUYING CRITERIA
                    FIGURE 32 BUYING CRITERIA OF TOP 3 INDUSTRIES
                    TABLE 7 KEY BUYING CRITERIA OF TOP 3 INDUSTRIES
    5.11 TRADE ANALYSIS 
           5.11.1 TRADE ANALYSIS FOR HS CODE 8536
                    FIGURE 33 IMPORT DATA FOR HS CODE 8536, BY KEY COUNTRY, 2017–2021 (USD MILLION)
                    FIGURE 34 EXPORT DATA FOR HS CODE 8536, BY KEY COUNTRY, 2017–2021 (USD MILLION)
    5.12 PATENT ANALYSIS 
           FIGURE 35 TOP 10 COMPANIES WITH HIGHEST NUMBER OF PATENT APPLICATIONS IN LAST 10 YEARS
           FIGURE 36 PATENT ANALYSIS RELATED TO MACHINE SAFETY MARKET
           5.12.1 LIST OF MAJOR PATENTS
    5.13 KEY CONFERENCES AND EVENTS, 2023–2024 
           TABLE 8 MACHINE SAFETY MARKET: REGION-WISE LIST OF KEY CONFERENCES AND EVENTS
    5.14 STANDARDS AND REGULATORY LANDSCAPE 
           5.14.1 REGULATORY BODIES, GOVERNMENT AGENCIES, AND OTHER ORGANIZATIONS
                    TABLE 9 NORTH AMERICA: LIST OF REGULATORY BODIES, GOVERNMENT AGENCIES, AND OTHER ORGANIZATIONS
                    TABLE 10 EUROPE: LIST OF REGULATORY BODIES, GOVERNMENT AGENCIES, AND OTHER ORGANIZATIONS
                    TABLE 11 ASIA PACIFIC: LIST OF REGULATORY BODIES, GOVERNMENT AGENCIES, AND OTHER ORGANIZATIONS
                    TABLE 12 REST OF THE WORLD: LIST OF REGULATORY BODIES, GOVERNMENT AGENCIES, AND OTHER ORGANIZATIONS
           5.14.2 MACHINE SAFETY-RELATED STANDARDS FOR PROCESS INDUSTRIES
                    5.14.2.1 I EC 61508
                    5.14.2.2 I EC 61511
           5.14.3 MACHINERY
                    5.14.3.1 IEC 62061
 
6 IMPLEMENTATION TYPES OF MACHINE SAFETY PRODUCTS (Page No. - 86)
    6.1 INTRODUCTION 
           FIGURE 37 IMPLEMENTATION TYPES OF MACHINE SAFETY SYSTEMS
    6.2 INDIVIDUAL 
           6.2.1 EASY TO INSTALL AND CONTROL FEATURES TO BOOST DEMAND
    6.3 EMBEDDED 
           6.3.1 BETTER PERFORMANCE AND ADVANCED SAFETY FEATURES TO DRIVE MARKET
 
7 INSIGHTS ON SALES CHANNELS OF MACHINE SAFETY COMPONENTS (Page No. - 88)
    7.1 INTRODUCTION 
           FIGURE 38 MACHINE SAFETY SALES CHANNEL OUTLOOK
    7.2 DIRECT 
    7.3 INDIRECT 
 
8 APPLICATIONS OF MACHINE SAFETY COMPONENTS (Page No. - 89)
    8.1 INTRODUCTION 
           FIGURE 39 MACHINE SAFETY SYSTEM APPLICATIONS
    8.2 ASSEMBLY 
           8.2.1 FOCUS ON ASSEMBLY LINE SAFETY AND SECURITY TO BOOST DEMAND FOR MACHINE SAFETY MEASURES
    8.3 ROBOTICS 
           8.3.1 SAFETY REGULATIONS TO PROMPT DEPLOYMENT OF MACHINE SAFETY SYSTEMS IN ROBOTICS APPLICATIONS
    8.4 PACKAGING 
           8.4.1 INCREASING NUMBER OF MACHINERY-RELATED ACCIDENTS WHILE HANDLING PACKAGING MACHINES TO PROMOTE ADOPTION OF MACHINE SAFETY SYSTEMS
    8.5 MATERIAL HANDLING 
           8.5.1 REDUCTION IN RISK OF DAMAGING MATERIAL-HANDLING EQUIPMENT TO ENCOURAGE USE OF MACHINE SAFETY SOLUTIONS
    8.6 METALWORKING 
           8.6.1 ELIMINATION OF MECHANICAL HAZARDS IN METALWORKING TO DRIVE ADOPTION OF MACHINE SAFETY MEASURES
    8.7 WELDING & SHIELDING 
           8.7.1 LIGHT CURTAINS, PROTECTIVE SHIELDS, AND SAFETY INTERLOCK FEATURES TO DRIVE DEMAND FOR WELDING & SHIELDING APPLICATIONS
 
9 MACHINE SAFETY MARKET, BY COMPONENT (Page No. - 93)
    9.1 INTRODUCTION 
           FIGURE 40 MACHINE SAFETY MARKET, BY COMPONENTS
           FIGURE 41 PRESENCE DETECTION SENSORS TO HOLD LARGEST SHARE OF MACHINE SAFETY MARKET IN 2028
           TABLE 13 MACHINE SAFETY MARKET, BY COMPONENT, 2019–2022 (USD MILLION)
           TABLE 14 MACHINE SAFETY MARKET BY COMPONENT, 2023–2028 (USD MILLION)
           TABLE 15 MACHINE SAFETY MARKET, BY COMPONENT, 2022 (THOUSAND UNITS)
    9.2 PRESENCE DETECTION SENSORS 
           TABLE 16 PRESENCE DETECTION SENSORS: MACHINE SAFETY MARKET, BY PROCESS INDUSTRY, 2019–2022 (USD MILLION)
           TABLE 17 PRESENCE DETECTION SENSORS: MACHINE SAFETY MARKET, BY PROCESS INDUSTRY, 2023–2028 (USD MILLION)
           TABLE 18 PRESENCE DETECTION SENSORS: MACHINE SAFETY MARKET, BY DISCRETE INDUSTRY, 2019–2022 (USD MILLION)
           TABLE 19 PRESENCE DETECTION SENSORS: MACHINE SAFETY MARKET, BY DISCRETE INDUSTRY, 2023–2028 (USD MILLION)
           TABLE 20 PRESENCE DETECTION SENSORS: MACHINE SAFETY MARKET, BY REGION, 2019–2022 (USD MILLION)
           TABLE 21 PRESENCE DETECTION SENSORS: MACHINE SAFETY MARKET, BY REGION, 2023–2028 (USD MILLION)
           9.2.1 SAFETY EDGES
                    9.2.1.1 Need to safeguard closing edges at potential crushing or shearing points to promote use of safety edges
           9.2.2 LASER SCANNERS
                    9.2.2.1 Adoption of laser scanners to prohibit entry of unauthorized entities to drive segmental growth
           9.2.3 SAFETY LIGHT CURTAINS
                    9.2.3.1 Necessity to prevent external threats to machinery and other tools to increase demand for safety light curtains
                    9.2.3.2 Light-emitting diodes (LEDs)
                    9.2.3.3 Photoelectric cells
                    9.2.3.4 Control units
                    9.2.3.5 Displays
                    9.2.3.6 Enclosures
           9.2.4 SAFETY MATS
                    9.2.4.1 Focus on safeguarding workers handling textile machines, water jet machines, etc., to stimulate demand for safety mats
           9.2.5 OTHER DEVICES
    9.3 PROGRAMMABLE SAFETY SYSTEMS 
           9.3.1 DEPLOYMENT OF PROGRAMMABLE SAFETY SYSTEMS FOR PREVENTION OF ACCIDENTS IN INDUSTRIAL SETTINGS TO BOOST SEGMENTAL GROWTH
                    TABLE 22 PROGRAMMABLE SAFETY SYSTEMS: MACHINE SAFETY MARKET, BY PROCESS INDUSTRY, 2019–2022 (USD MILLION)
                    TABLE 23 PROGRAMMABLE SAFETY SYSTEMS: MACHINE SAFETY MARKET, BY PROCESS INDUSTRY, 2023–2028 (USD MILLION)
                    TABLE 24 PROGRAMMABLE SAFETY SYSTEMS: MACHINE SAFETY MARKET, BY DISCRETE INDUSTRY, 2019–2022 (USD MILLION)
                    TABLE 25 PROGRAMMABLE SAFETY SYSTEMS: MACHINE SAFETY MARKET, BY DISCRETE INDUSTRY, 2023–2028 (USD MILLION)
                    TABLE 26 PROGRAMMABLE SAFETY SYSTEMS: MACHINE SAFETY MARKET, BY REGION, 2019–2022 (USD MILLION)
                    TABLE 27 PROGRAMMABLE SAFETY SYSTEMS: MACHINE SAFETY MARKET, BY REGION, 2023–2028 (USD MILLION)
    9.4 SAFETY CONTROLLERS/MODULES/RELAYS 
           9.4.1 UTILIZATION OF SAFETY CONTROLLERS/MODULES/RELAYS FOR EMERGENCY SHUTDOWN OF EQUIPMENT TO FUEL DEMAND
                    TABLE 28 SAFETY CONTROLLERS/MODULES/RELAYS: MACHINE SAFETY MARKET, BY PROCESS INDUSTRY, 2019–2022 (USD MILLION)
                    TABLE 29 SAFETY CONTROLLERS/MODULES/RELAYS: MACHINE SAFETY MARKET, BY PROCESS INDUSTRY, 2023–2028 (USD MILLION)
                    TABLE 30 SAFETY CONTROLLERS/MODULES/RELAYS: MACHINE SAFETY MARKET, BY DISCRETE INDUSTRY, 2019–2022 (USD MILLION)
                    TABLE 31 SAFETY CONTROLLERS/MODULES/RELAYS: MACHINE SAFETY MARKET, BY DISCRETE INDUSTRY, 2023–2028 (USD MILLION)
                    TABLE 32 SAFETY CONTROLLERS/MODULES/RELAYS: MACHINE SAFETY MARKET, BY REGION, 2019–2022 (USD MILLION)
                    TABLE 33 SAFETY CONTROLLERS/MODULES/RELAYS: MACHINE SAFETY MARKET, BY REGION, 2023–2028 (USD MILLION)
    9.5 SAFETY INTERLOCK SWITCHES 
           9.5.1 ELECTROMECHANICAL SWITCHES
                    9.5.1.1 Use of electromechanical switches to lock equipment doors and panels in closed positions during equipment operations
           9.5.2 HINGE PIN SWITCHES
                    9.5.2.1 Integration of tamper-resistant actuators into hinge pin switches for hinging machine guards
           9.5.3 LIMIT SWITCHES
                    9.5.3.1 Adoption of limit switches to break connection between machine and power supplies
           9.5.4 NON-CONTACT INTERLOCK SWITCHES
                    9.5.4.1 Installation of non-contact safety interlock switches wherein implementation of safety systems is difficult
           9.5.5 TONGUE INTERLOCK SWITCHES
                    9.5.5.1 Execution of tongue interlock switches to detect movement of hinged, sliding, or lift-off guard
           9.5.6 TRAPPED KEY INTERLOCK SWITCHES
                    9.5.6.1 Use of trapped key switches in applications wherein equipment to be started or shut down in prescribed sequence
                               TABLE 34 SAFETY INTERLOCK SWITCHES: MACHINE SAFETY MARKET, BY PROCESS INDUSTRY, 2019–2022 (USD MILLION)
                               TABLE 35 SAFETY INTERLOCK SWITCHES: MACHINE SAFETY MARKET, BY PROCESS INDUSTRY, 2023–2028 (USD MILLION)
                               TABLE 36 SAFETY INTERLOCK SWITCHES: MACHINE SAFETY MARKET, BY DISCRETE INDUSTRY, 2019–2022 (USD MILLION)
                               TABLE 37 SAFETY INTERLOCK SWITCHES: MACHINE SAFETY MARKET, BY DISCRETE INDUSTRY, 2023–2028 (USD MILLION)
                               TABLE 38 SAFETY INTERLOCK SWITCHES: MACHINE SAFETY MARKET, BY REGION, 2019–2022 (USD MILLION)
                               TABLE 39 SAFETY INTERLOCK SWITCHES: MACHINE SAFETY MARKET, BY REGION, 2023–2028 (USD MILLION)
    9.6 EMERGENCY STOP CONTROLS 
           TABLE 40 EMERGENCY STOP CONTROLS: MACHINE SAFETY MARKET, BY PROCESS INDUSTRY, 2019–2022 (USD MILLION)
           TABLE 41 EMERGENCY STOP CONTROLS: MACHINE SAFETY MARKET, BY PROCESS INDUSTRY, 2023–2028 (USD MILLION)
           TABLE 42 EMERGENCY STOP CONTROLS: MACHINE SAFETY MARKET, BY DISCRETE INDUSTRY, 2019–2022 (USD MILLION)
           TABLE 43 EMERGENCY STOP CONTROLS: MACHINE SAFETY MARKET, BY DISCRETE INDUSTRY, 2023–2028 (USD MILLION)
           TABLE 44 EMERGENCY STOP CONTROLS: MACHINE SAFETY MARKET, BY REGION, 2019–2022 (USD MILLION)
           TABLE 45 EMERGENCY STOP CONTROLS: MACHINE SAFETY MARKET, BY REGION, 2023–2028 (USD MILLION)
           9.6.1 PUSH BUTTONS
                    9.6.1.1 Compact housing and easy connection and troubleshooting features to increase adoption of push buttons
           9.6.2 ROPE (CABLE) PULL BUTTONS
                    9.6.2.1 Immediate plant shutdown using rope pull buttons in case of emergency to drive segmental growth
    9.7 TWO-HAND SAFETY CONTROLS 
           9.7.1 USE OF TWO-HAND SAFETY CONTROLS IN POWER GENERATION APPLICATIONS TO PROPEL MARKET
                    TABLE 46 TWO-HAND SAFETY CONTROLS: MACHINE SAFETY MARKET, BY PROCESS INDUSTRY, 2019–2022 (USD MILLION)
                    TABLE 47 TWO-HAND SAFETY CONTROLS: MACHINE SAFETY MARKET, BY PROCESS INDUSTRY, 2023–2028 (USD MILLION)
                    TABLE 48 TWO-HAND SAFETY CONTROLS: MACHINE SAFETY MARKET, BY DISCRETE INDUSTRY, 2019–2022 (USD MILLION)
                    TABLE 49 TWO-HAND SAFETY CONTROLS: MACHINE SAFETY MARKET, BY DISCRETE INDUSTRY, 2023–2028 (USD MILLION)
                    TABLE 50 TWO-HAND SAFETY CONTROLS: MACHINE SAFETY MARKET, BY REGION, 2019–2022 (USD MILLION)
                    TABLE 51 TWO-HAND SAFETY CONTROLS: MACHINE SAFETY MARKET, BY REGION, 2023–2028 (USD MILLION)
 
10 MACHINE SAFETY MARKET, BY INDUSTRY (Page No. - 116)
     10.1 INTRODUCTION 
             FIGURE 42 MACHINE SAFETY MARKET, BY INDUSTRY
             FIGURE 43 PROCESS INDUSTRY SEGMENT TO DOMINATE MACHINE SAFETY MARKET THROUGHOUT FORECAST PERIOD
             TABLE 52 MACHINE SAFETY MARKET, BY INDUSTRY, 2019–2022 (USD MILLION)
             TABLE 53 MACHINE SAFETY MARKET, BY INDUSTRY, 2023–2028 (USD MILLION)
     10.2 PROCESS INDUSTRY 
             TABLE 54 MACHINE SAFETY MARKET, BY PROCESS INDUSTRY, 2019–2022 (USD MILLION)
             TABLE 55 MACHINE SAFETY MARKET, BY PROCESS INDUSTRY, 2023–2028 (USD MILLION)
             10.2.1 CHEMICAL
                        10.2.1.1 Need for safe and reliable operations in chemical industry to propel growth
                                     TABLE 56 CHEMICAL: MACHINE SAFETY MARKET, BY REGION, 2019–2022 (USD MILLION)
                                     TABLE 57 CHEMICAL: MACHINE SAFETY MARKET, BY REGION, 2023–2028 (USD MILLION)
             10.2.2 FOOD & BEVERAGE
                        10.2.2.1 Process automation in food & beverage industry to fuel demand for machine safety systems
                                     TABLE 58 FOOD & BEVERAGE: MACHINE SAFETY MARKET, BY REGION, 2019–2022 (USD MILLION)
                                     TABLE 59 FOOD & BEVERAGE: MACHINE SAFETY MARKET, BY REGION, 2023–2028 (USD MILLION)
             10.2.3 METAL & MINING
                        10.2.3.1 Installation of machine safety systems to prevent hazardous gas leakage to stimulate segmental growth
                                     TABLE 60 METAL & MINING: MACHINE SAFETY MARKET, BY REGION, 2019–2022 (USD MILLION)
                                     TABLE 61 METAL & MINING: MACHINE SAFETY MARKET, BY REGION, 2023–2028 (USD MILLION)
             10.2.4 OIL & GAS
                        10.2.4.1 Stringent regulations and standards to drive requirement for machine safety systems in oil & gas plants
                                     TABLE 62 OIL & GAS: MACHINE SAFETY MARKET, BY REGION, 2019–2022 (USD MILLION)
                                     TABLE 63 OIL & GAS: MACHINE SAFETY MARKET, BY REGION, 2023–2028 (USD MILLION)
             10.2.5 PHARMACEUTICAL
                        10.2.5.1 Deployment of machine safety measures to improve plant efficiency and productivity to fuel market growth
                                     TABLE 64 PHARMACEUTICAL: MACHINE SAFETY MARKET, BY REGION, 2019–2022 (USD MILLION)
                                     TABLE 65 PHARMACEUTICAL: MACHINE SAFETY MARKET, BY REGION, 2023–2028 (USD MILLION)
             10.2.6 POWER GENERATION
                        10.2.6.1 Adoption of machine safety measures to ensure well-being of workers and efficient functioning of equipment to boost market
                                     TABLE 66 POWER GENERATION: MACHINE SAFETY MARKET, BY REGION, 2019–2022 (USD MILLION)
                                     TABLE 67 POWER GENERATION: MACHINE SAFETY MARKET, BY REGION, 2023–2028 (USD MILLION)
             10.2.7 OTHER PROCESS INDUSTRIES
                        TABLE 68 OTHER PROCESS INDUSTRIES: MACHINE SAFETY MARKET, BY REGION, 2019–2022 (USD MILLION)
                        TABLE 69 OTHER PROCESS INDUSTRIES: MACHINE SAFETY MARKET, BY REGION, 2023–2028 (USD MILLION)
     10.3 DISCRETE INDUSTRY 
             TABLE 70 MACHINE SAFETY MARKET, BY DISCRETE INDUSTRY, 2019–2022 (USD MILLION)
             TABLE 71 MACHINE SAFETY MARKET, BY DISCRETE INDUSTRY, 2023–2028 (USD MILLION)
             10.3.1 AEROSPACE
                        10.3.1.1 Automated processes in aerospace manufacturing plants to create opportunities for machine safety system providers
                                     TABLE 72 AEROSPACE: MACHINE SAFETY MARKET, BY REGION, 2019–2022 (USD MILLION)
                                     TABLE 73 AEROSPACE: MACHINE SAFETY MARKET, BY REGION, 2023–2028 (USD MILLION)
             10.3.2 AUTOMOTIVE
                        10.3.2.1 Use of machine safety systems by automakers to prevent unsafe conditions by overreliance on IT capabilities to foster growth
                                     TABLE 74 AUTOMOTIVE: MACHINE SAFETY MARKET, BY REGION, 2019–2022 (USD MILLION)
                                     TABLE 75 AUTOMOTIVE: MACHINE SAFETY MARKET, BY REGION, 2023–2028 (USD MILLION)
             10.3.3 SEMICONDUCTOR & ELECTRONICS
                        10.3.3.1 Increased use of safety light curtains in semiconductor fabs to boost market
                                     TABLE 76 SEMICONDUCTOR & ELECTRONICS: MACHINE SAFETY MARKET, BY REGION, 2019–2022 (USD MILLION)
                                     TABLE 77 SEMICONDUCTOR & ELECTRONICS: MACHINE SAFETY MARKET, BY REGION, 2023–2028 (USD MILLION)
             10.3.4 OTHER DISCRETE INDUSTRIES
                        TABLE 78 OTHER DISCRETE INDUSTRIES: MACHINE SAFETY MARKET, BY REGION, 2019–2022 (USD MILLION)
                        TABLE 79 OTHER DISCRETE INDUSTRIES: MACHINE SAFETY MARKET, BY REGION, 2023–2028 (USD MILLION)
 
11 MACHINE SAFETY MARKET, BY REGION (Page No. - 133)
     11.1 INTRODUCTION 
           FIGURE 44 MACHINE SAFETY MARKET, BY REGION
           FIGURE 45 MACHINE SAFETY MARKET IN ASIA PACIFIC TO GROW AT HIGHEST CAGR DURING FORECAST PERIOD
           TABLE 80 MACHINE SAFETY MARKET, BY REGION, 2019–2022 (USD MILLION)
           TABLE 81 MACHINE SAFETY MARKET, BY REGION, 2023–2028 (USD MILLION)
     11.2 NORTH AMERICA 
             11.2.1 IMPACT OF RECESSION ON MACHINE SAFETY MARKET IN NORTH AMERICA
                        FIGURE 46 NORTH AMERICA: SNAPSHOT OF MACHINE SAFETY MARKET
                        TABLE 82 NORTH AMERICA: MACHINE SAFETY MARKET, BY COUNTRY, 2019–2022 (USD MILLION)
                        TABLE 83 NORTH AMERICA: MACHINE SAFETY MARKET, BY COUNTRY, 2023–2028 (USD MILLION)
                        TABLE 84 NORTH AMERICA: MACHINE SAFETY MARKET, BY COMPONENT, 2019–2022 (USD MILLION)
                        TABLE 85 NORTH AMERICA: MACHINE SAFETY MARKET, BY COMPONENT, 2023–2028 (USD MILLION)
                        TABLE 86 NORTH AMERICA: MACHINE SAFETY MARKET, BY PROCESS INDUSTRY, 2019–2022 (USD MILLION)
                        TABLE 87 NORTH AMERICA: MACHINE SAFETY MARKET, BY PROCESS INDUSTRY, 2023–2028 (USD MILLION)
                        TABLE 88 NORTH AMERICA: MACHINE SAFETY MARKET, BY DISCRETE INDUSTRY, 2019–2022 (USD MILLION)
                        TABLE 89 NORTH AMERICA: MACHINE SAFETY MARKET, BY DISCRETE INDUSTRY, 2023–2028 (USD MILLION)
             11.2.2 US
                        11.2.2.1 Implementation of machine safety measures to avoid injuries and fatalities to drive market
             11.2.3 CANADA
                        11.2.3.1 Enforcement of strict government regulations to ensure workplace safety to boost demand for machine safety measures
             11.2.4 MEXICO
                        11.2.4.1 Industrial growth and technological advancements to accelerate market growth
     11.3 EUROPE 
             11.3.1 IMPACT OF RECESSION ON MACHINE SAFETY MARKET IN EUROPE
                        FIGURE 47 EUROPE: SNAPSHOT OF MACHINE SAFETY MARKET
                        TABLE 90 EUROPE: MACHINE SAFETY MARKET, BY COUNTRY, 2019–2022 (USD MILLION)
                        TABLE 91 EUROPE: MACHINE SAFETY MARKET, BY COUNTRY, 2023–2028 (USD MILLION)
                        TABLE 92 EUROPE: MACHINE SAFETY MARKET, BY COMPONENT, 2019–2022 (USD MILLION)
                        TABLE 93 EUROPE: MACHINE SAFETY MARKET, BY COMPONENT, 2023–2028 (USD MILLION)
                        TABLE 94 EUROPE: MACHINE SAFETY MARKET, BY PROCESS INDUSTRY, 2019–2022 (USD MILLION)
                        TABLE 95 EUROPE: MACHINE SAFETY MARKET, BY PROCESS INDUSTRY, 2023–2028 (USD MILLION)
                        TABLE 96 EUROPE: MACHINE SAFETY MARKET, BY DISCRETE INDUSTRY, 2019–2022 (USD MILLION)
                        TABLE 97 EUROPE: MACHINE SAFETY MARKET, BY DISCRETE INDUSTRY, 2023–2028 (USD MILLION)
             11.3.2 UK
                        11.3.2.1 Solid legal framework for workplace safety to drive demand for machine safety systems
             11.3.3 GERMANY
                        11.3.3.1 Adoption of automation in manufacturing processes to drive need for machine safety measures
             11.3.4 FRANCE
                        11.3.4.1 Implementation of occupational health and safety policy to fuel growth
             11.3.5 REST OF EUROPE
     11.4 ASIA PACIFIC 
             11.4.1 IMPACT OF RECESSION ON MACHINE SAFETY MARKET IN ASIA PACIFIC
                        FIGURE 48 ASIA PACIFIC: SNAPSHOT OF MACHINE SAFETY MARKET
                        TABLE 98 ASIA PACIFIC: MACHINE SAFETY MARKET, BY COUNTRY, 2019–2022 (USD MILLION)
                        TABLE 99 ASIA PACIFIC: MACHINE SAFETY MARKET, BY COUNTRY, 2023–2028 (USD MILLION)
                        TABLE 100 ASIA PACIFIC: MACHINE SAFETY MARKET, BY COMPONENT, 2019–2022 (USD MILLION)
                        TABLE 101 ASIA PACIFIC: MACHINE SAFETY MARKET, BY COMPONENT, 2023–2028 (USD MILLION)
                        TABLE 102 ASIA PACIFIC: MACHINE SAFETY MARKET, BY PROCESS INDUSTRY, 2019–2022 (USD MILLION)
                        TABLE 103 ASIA PACIFIC: MACHINE SAFETY MARKET, BY PROCESS INDUSTRY, 2023–2028 (USD MILLION)
                        TABLE 104 ASIA PACIFIC: MACHINE SAFETY MARKET, BY DISCRETE INDUSTRY, 2019–2022 (USD MILLION)
                        TABLE 105 ASIA PACIFIC: MACHINE SAFETY MARKET, BY DISCRETE INDUSTRY, 2023–2028 (USD MILLION)
             11.4.2 CHINA
                        11.4.2.1 Growth of manufacturing sector to drive market
             11.4.3 JAPAN
                        11.4.3.1 Fast-growing process industries to fuel adoption of machine safety products
             11.4.4 INDIA
                        11.4.4.1 Power for All and Make in India initiatives by Indian government to boost deployment of machine safety systems
             11.4.5 SOUTH KOREA
                        11.4.5.1 Enforcement of KOSHA and Machine Safety and Health Law to drive need for machine safety measures
             11.4.6 REST OF ASIA PACIFIC
     11.5 ROW 
             11.5.1 IMPACT OF RECESSION ON MACHINE SAFETY MARKET IN ROW
                        FIGURE 49 SOUTH AMERICA TO WITNESS HIGHER CAGR IN MACHINE SAFETY MARKET IN ROW DURING FORECAST PERIOD
                        TABLE 106 ROW: MACHINE SAFETY MARKET, BY REGION, 2019–2022 (USD MILLION)
                        TABLE 107 ROW: MACHINE SAFETY MARKET, BY REGION, 2023–2028 (USD MILLION)
                        TABLE 108 ROW: MACHINE SAFETY MARKET, BY COMPONENT, 2019–2022 (USD MILLION)
                        TABLE 109 ROW: MACHINE SAFETY MARKET, BY COMPONENT, 2023–2028 (USD MILLION)
                        TABLE 110 ROW: MACHINE SAFETY MARKET, BY PROCESS INDUSTRY, 2019–2022 (USD MILLION)
                        TABLE 111 ROW: MACHINE SAFETY MARKET, BY PROCESS INDUSTRY, 2023–2028 (USD MILLION)
                        TABLE 112 ROW: MACHINE SAFETY MARKET, BY DISCRETE INDUSTRY, 2019–2022 (USD MILLION)
                        TABLE 113 ROW: MACHINE SAFETY MARKET, BY DISCRETE INDUSTRY, 2023–2028 (USD MILLION)
             11.5.2 SOUTH AMERICA
                        11.5.2.1 South America to emerge as lucrative market for machine safety solution providers
             11.5.3 MIDDLE EAST & AFRICA
                        11.5.3.1 Oil & gas industry registered largest share of Middle Eastern market in 2022
 
12 COMPETITIVE LANDSCAPE (Page No. - 159)
     12.1 INTRODUCTION 
             TABLE 114 KEY DEVELOPMENTS IN MACHINE SAFETY MARKET, 2021–2022
     12.2 REVENUE ANALYSIS OF TOP 5 COMPANIES 
             FIGURE 50 MACHINE SAFETY MARKET: REVENUE ANALYSIS, 2022
     12.3 MARKET SHARE ANALYSIS OF TOP PLAYERS, 2022 
             TABLE 115 MACHINE SAFETY MARKET: DEGREE OF COMPETITION
             FIGURE 51 MACHINE SAFETY MARKET: MARKET SHARE ANALYSIS, 2022
     12.4 COMPETITIVE EVALUATION QUADRANT, 2022 
             12.4.1 STARS
             12.4.2 EMERGING LEADERS
             12.4.3 PERVASIVE PLAYERS
             12.4.4 PARTICIPANTS
                        FIGURE 52 MACHINE SAFETY MARKET (GLOBAL) COMPANY EVALUATION QUADRANT, 2022
     12.5 SMALL AND MEDIUM-SIZED ENTERPRISES EVALUATION QUADRANT, 2022 
             12.5.1 PROGRESSIVE COMPANIES
             12.5.2 RESPONSIVE COMPANIES
             12.5.3 DYNAMIC COMPANIES
             12.5.4 STARTING BLOCKS
                        FIGURE 53 MACHINE SAFETY MARKET (GLOBAL) SME EVALUATION QUADRANT, 2022
             12.5.5 MACHINE SAFETY MARKET: COMPANY FOOTPRINT
                        TABLE 116 COMPANY COMPONENT FOOTPRINT
                        TABLE 117 COMPANY INDUSTRY FOOTPRINT
                        TABLE 118 COMPANY PROCESS INDUSTRY FOOTPRINT
                        TABLE 119 COMPANY DISCRETE INDUSTRY FOOTPRINT
                        TABLE 120 COMPANY REGION FOOTPRINT
                        TABLE 121 COMPANY FOOTPRINT
     12.6 COMPETITIVE BENCHMARKING 
             12.6.1 MACHINE SAFETY MARKET: LIST OF KEY STARTUPS/SMES
                        TABLE 122 KEY STARTUPS
             12.6.2 MACHINE SAFETY MARKET: COMPETITIVE BENCHMARKING OF KEY STARTUPS/SMES, BY INDUSTRY
                        TABLE 123 COMPETITIVE BENCHMARKING OF KEY STARTUPS/SMES, BY TYPE
             12.6.3 MACHINE SAFETY MARKET: COMPETITIVE BENCHMARKING OF KEY STARTUPS/SMES, BY PROCESS INDUSTRY
                        TABLE 124 COMPETITIVE BENCHMARKING OF KEY STARTUPS/SMES, BY PROCESS INDUSTRY
             12.6.4 MACHINE SAFETY MARKET: COMPETITIVE BENCHMARKING OF KEY STARTUPS/SMES, BY DISCRETE INDUSTRY
                        TABLE 125 COMPETITIVE BENCHMARKING OF KEY STARTUPS/SMES, BY DISCRETE INDUSTRY
             12.6.5 MACHINE SAFETY MARKET: COMPETITIVE BENCHMARKING OF KEY STARTUPS/SMES, BY REGION
                        TABLE 126 COMPETITIVE BENCHMARKING OF KEY STARTUPS/SMES, BY REGION
     12.7 COMPETITIVE SITUATIONS AND TRENDS 
             12.7.1 PRODUCT LAUNCHES
                        TABLE 127 MACHINE SAFETY MARKET: PRODUCT LAUNCHES, JANUARY 2021–MARCH 2023
             12.7.2 DEALS
                        TABLE 128 MACHINE SAFETY MARKET: DEALS
             12.7.3 OTHER DEVELOPMENTS
                        TABLE 129 MACHINE SAFETY MARKET: OTHER DEVELOPMENTS
 
13 COMPANY PROFILES (Page No. - 183)
*Details on Business Overview, Products/Solutions/Services Offered, Recent Developments, SWOT Analysis, and MnM View might not be captured in case of unlisted companies.  
     13.1 KEY PLAYERS 
             13.1.1 SCHNEIDER ELECTRIC
                        TABLE 130 SCHNEIDER ELECTRIC: BUSINESS OVERVIEW
                        FIGURE 54 SCHNEIDER ELECTRIC: COMPANY SNAPSHOT
                        TABLE 131 SCHNEIDER ELECTRIC: PRODUCT/SOLUTION/SERVICE OFFERINGS
                        TABLE 132 SCHNEIDER ELECTRIC: PRODUCT LAUNCHES AND DEVELOPMENTS
                        TABLE 133 SCHNEIDER ELECTRIC: DEALS
             13.1.2 HONEYWELL INTERNATIONAL INC.
                        TABLE 134 HONEYWELL INTERNATIONAL INC.: BUSINESS OVERVIEW
                        FIGURE 55 HONEYWELL INTERNATIONAL INC.: COMPANY SNAPSHOT
                        TABLE 135 HONEYWELL INTERNATIONAL INC.: PRODUCT/SOLUTION/SERVICE OFFERINGS
                        TABLE 136 HONEYWELL INTERNATIONAL INC.: DEALS
             13.1.3 ABB
                        TABLE 137 ABB: BUSINESS OVERVIEW
                        FIGURE 56 ABB: COMPANY SNAPSHOT
                        TABLE 138 ABB: PRODUCT/SOLUTION/SERVICE OFFERINGS
                        TABLE 139 ABB: DEALS
             13.1.4 ROCKWELL AUTOMATION, INC.
                        TABLE 140 ROCKWELL AUTOMATION, INC.: BUSINESS OVERVIEW
                        FIGURE 57 ROCKWELL AUTOMATION, INC.: COMPANY SNAPSHOT
                        TABLE 141 ROCKWELL AUTOMATION, INC.: PRODUCT/SOLUTION/SERVICE OFFERINGS
                        TABLE 142 ROCKWELL AUTOMATION, INC.: PRODUCT LAUNCHES AND DEVELOPMENTS
                        TABLE 143 ROCKWELL AUTOMATION, INC.: OTHER DEVELOPMENTS
             13.1.5 SIEMENS AG
                        TABLE 144 SIEMENS AG: BUSINESS OVERVIEW
                        FIGURE 58 SIEMENS AG: COMPANY SNAPSHOT
                        TABLE 145 SIEMENS AG: PRODUCT/SOLUTION/SERVICE OFFERINGS
                        TABLE 146 SIEMENS AG: PRODUCT LAUNCHES AND DEVELOPMENTS
                        TABLE 147 SIEMENS AG: OTHER DEVELOPMENTS
             13.1.6 OMRON CORPORATION
                        TABLE 148 OMRON CORPORATION: BUSINESS OVERVIEW
                        FIGURE 59 OMRON CORPORATION: COMPANY SNAPSHOT
                        TABLE 149 OMRON CORPORATION: PRODUCT/SOLUTION/SERVICE OFFERINGS
                        TABLE 150 OMRON CORPORATION: PRODUCT LAUNCHES AND DEVELOPMENTS
                        TABLE 151 OMRON CORPORATION: DEALS
             13.1.7 KEYENCE CORPORATION
                        TABLE 152 KEYENCE CORPORATION: BUSINESS OVERVIEW
                        FIGURE 60 KEYENCE CORPORATION: COMPANY SNAPSHOT
                        TABLE 153 KEYENCE CORPORATION: PRODUCT/SOLUTION/SERVICE OFFERINGS
                        TABLE 154 KEYENCE CORPORATION: PRODUCT LAUNCHES AND DEVELOPMENTS
             13.1.8 YOKOGAWA ELECTRIC CORPORATION
                        TABLE 155 YOKOGAWA ELECTRIC CORPORATION: BUSINESS OVERVIEW
                        FIGURE 61 YOKOGAWA ELECTRIC CORPORATION: COMPANY SNAPSHOT
                        TABLE 156 YOKOGAWA ELECTRIC CORPORATION: PRODUCT/SOLUTION/SERVICE OFFERINGS
                        TABLE 157 YOKOGAWA ELECTRIC CORPORATION: OTHER DEVELOPMENTS
             13.1.9 EMERSON ELECTRIC CO.
                        TABLE 158 EMERSON ELECTRIC CO.: BUSINESS OVERVIEW
                        FIGURE 62 EMERSON ELECTRIC CO.: COMPANY SNAPSHOT
                        TABLE 159 EMERSON ELECTRIC CO.: PRODUCT/SOLUTION/SERVICE OFFERINGS
                        TABLE 160 EMERSON ELECTRIC CO.: PRODUCT LAUNCHES AND DEVELOPMENTS
                        TABLE 161 EMERSON ELECTRIC CO.: DEALS
             13.1.10 GENERAL ELECTRIC
                        TABLE 162 GENERAL ELECTRIC: BUSINESS OVERVIEW
                        FIGURE 63 GENERAL ELECTRIC: COMPANY SNAPSHOT
                        TABLE 163 GENERAL ELECTRIC: PRODUCT/SOLUTION/SERVICE OFFERINGS
             13.1.11 MITSUBISHI ELECTRIC CORPORATION
                        TABLE 164 MITSUBISHI ELECTRIC CORPORATION: BUSINESS OVERVIEW
                        FIGURE 64 MITSUBISHI ELECTRIC CORPORATION: COMPANY SNAPSHOT
                        TABLE 165 MITSUBISHI ELECTRIC CORPORATION: PRODUCT/SOLUTION/SERVICE OFFERINGS
             13.1.12 SICK AG
                        TABLE 166 SICK AG: BUSINESS OVERVIEW
                        FIGURE 65 SICK AG: COMPANY SNAPSHOT
                        TABLE 167 SICK AG: PRODUCT/SOLUTION/SERVICE OFFERINGS
                        TABLE 168 SICK AG: PRODUCT LAUNCHES AND DEVELOPMENTS
                        TABLE 169 SICK AG: DEALS
             13.1.13 HIMA
                        TABLE 170 HIMA: BUSINESS OVERVIEW
                        TABLE 171 HIMA: PRODUCT/SOLUTION/SERVICE OFFERINGS
             13.1.14 IDEC CORPORATION
                        TABLE 172 IDEC CORPORATION: BUSINESS OVERVIEW
                        FIGURE 66 IDEC CORPORATION: COMPANY SNAPSHOT
                        TABLE 173 IDEC CORPORATION: PRODUCT/SOLUTION/SERVICE OFFERINGS
                        TABLE 174 IDEC CORPORATION: PRODUCT LAUNCHES AND DEVELOPMENTS
     13.2 OTHER MAJOR PLAYERS 
             13.2.1 BALLUFF GMBH
             13.2.2 BANNER ENGINEERING
             13.2.3 BAUMER
             13.2.4 PILZ
             13.2.5 PEPPERL+FUCHS
     13.3 OTHER SMALL AND MEDIUM-SIZED ENTERPRISES 
             13.3.1 EUCHNER GMBH + CO. KG
             13.3.2 DATALOGIC S.P.A.
             13.3.3 LEUZE ELECTRONIC PVT. LTD.
             13.3.4 FORTRESS INTERLOCKS
             13.3.5 K.A. SCHMERSAL GMBH & CO. KG
             13.3.6 ROCKFORD SYSTEMS
             13.3.7 STEUTE TECHNOLOGIES GMBH & CO. KG
             13.3.8 CARLO GAVAZZI HOLDING AG
             13.3.9 MURRELEKTRONIK GMBH
             13.3.10 EAO AG
(Business Overview, Products/Solutions/Services Offered, Recent Developments, and MnM View (Key strengths/Right to Win, Strategic Choices Made, and Weaknesses and Competitive Threats))*  
 
14 ADJACENT AND RELATED MARKETS (Page No. - 237)
     14.1 INTRODUCTION 
     14.2 STUDY LIMITATIONS 
     14.3 HIGH-INTEGRITY PRESSURE PROTECTION SYSTEM (HIPPS) MARKET, BY OFFERING 
             14.3.1 INTRODUCTION
                        TABLE 175 HIPPS MARKET, BY OFFERING, 2018–2021 (USD MILLION)
                        TABLE 176 HIPPS MARKET, BY OFFERING, 2022–2027 (USD MILLION)
     14.4 COMPONENTS 
             TABLE 177 HIPPS MARKET, BY COMPONENT, 2018–2021 (USD MILLION)
             TABLE 178 HIPPS MARKET, BY COMPONENT, 2022–2027 (USD MILLION)
             TABLE 179 HIPPS MARKET FOR COMPONENT, BY INDUSTRY, 2018–2021 (USD MILLION)
             TABLE 180 HIPPS MARKET FOR COMPONENT, BY INDUSTRY, 2022–2027 (USD MILLION)
             14.4.1 FILED INITIATORS
                        14.4.1.1 Pressure transmitters function as field initiators for HIPPS
             14.4.2 LOGIC SOLVERS
                        14.4.2.1 Solid-state logic solvers
                                     14.4.2.1.1 Featured with superior fault tolerance and high reliability
                        14.4.2.2 Others
                                     TABLE 181 HIPPS MARKET FOR LOGIC SOLVERS, BY TYPE, 2018–2021 (USD MILLION)
                                     TABLE 182 HIPPS MARKET FOR LOGIC SOLVERS, BY TYPE, 2022–2027 (USD MILLION)
             14.4.3 FINAL CONTROL ELEMENTS
                        14.4.3.1 Valves
                                     14.4.3.1.1 Key component of HIPPS
                        14.4.3.2 Actuators
                                     14.4.3.2.1 Enable valves to perform closing and opening functions
             14.4.4 OTHER COMPONENTS
     14.5 SERVICES 
             TABLE 183 HIPPS MARKET, BY SERVICE, 2018–2021 (USD MILLION)
             TABLE 184 HIPPS MARKET, BY SERVICE, 2022–2027 (USD MILLION)
             TABLE 185 HIPPS MARKET FOR SERVICE, BY INDUSTRY, 2018–2021 (USD MILLION)
             TABLE 186 HIPPS MARKET FOR SERVICE, BY INDUSTRY, 2022–2027 (USD MILLION)
             14.5.1 TESTING, INSPECTION, AND CERTIFICATION (TIC)
                        14.5.1.1 Reliance of end users on testing, inspection, and certification services to examine quality of HIPPS before implementation to boost demand
             14.5.2 MAINTENANCE
                        14.5.2.1 Focus on ensuring efficient functionality of HIPPS over extended period to drive need for regular maintenance
             14.5.3 TRAINING & CONSULTATION
                        14.5.3.1 Requirement for customized systems to fuel demand for consultation services
 
15 APPENDIX (Page No. - 245)
     15.1 INSIGHTS FROM INDUSTRY EXPERTS 
     15.2 DISCUSSION GUIDE 
     15.3 KNOWLEDGESTORE: MARKETSANDMARKETS’ SUBSCRIPTION PORTAL 
     15.4 CUSTOMIZATION OPTIONS 
     15.5 RELATED REPORTS 
     15.6 AUTHOR DETAILS 
 

The study involves four major activities for estimating the size of the Machine Safety market. Exhaustive secondary research has been conducted to collect information related to the market. The next step is to validate these findings and assumptions related to the market size with industry experts across the value chain through primary research. Both top-down and bottom-up approaches have been employed to estimate the overall size of the Machine Safety market. After that, market breakdown and data triangulation procedures were used to determine the extent of different segments and subsegments of the market.

Secondary Research

Secondary sources referred to for this research study included corporate filings (such as annual reports, investor presentations, and financial statements); trade, business, and professional associations; white papers; certified publications; articles by recognized authors; directories; and databases. The secondary data has been collected and analyzed to arrive at the overall market size, which has been further validated through primary research.

Primary Research

Extensive primary research has been conducted after gaining knowledge about the current scenario of the Machine Safety market through secondary research. Several primary interviews have been conducted with experts from the demand and supply sides across four major regions—Americas, Europe, Asia Pacific, and RoW. This primary data has been collected through questionnaires, emails, and telephonic interviews.
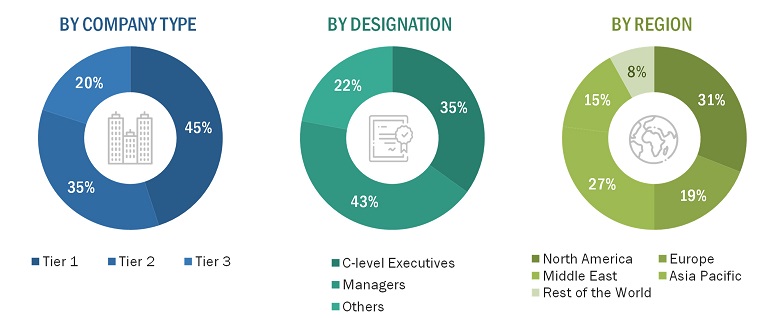
Machine Safety Market Size, and Share

To know about the assumptions considered for the study, download the pdf brochure

Market Size Estimation

In the complete market engineering process, both top-down and bottom-up approaches have been implemented, along with several data triangulation methods, to estimate and validate the size of the Machine Safety market and other dependent submarkets listed in this report.

  • The key players in the industry and markets have been identified through extensive secondary research.
  • The supply chain of the industry and the market size, in terms of value, have been determined through primary and secondary research.
  • All percentage shares, splits, and breakdowns have been determined using secondary sources and verified through primary sources.

Machine Safety Market: Top-Down Approach

  • In the top-down approach, the overall market size has been used to estimate the size of the individual markets (mentioned in the market segmentation) through percentage splits obtained from secondary and primary research.
  •  For the calculation of the Machine Safety market segments, the market size obtained by implementing the bottom-up approach has been used to implement the top-down approach, which has then been later confirmed with the primary respondents across different regions.
  • The bottom-up approach has also been implemented for the data extracted from secondary research to validate the market size of various segments.
  • The market share of each company has been estimated to verify the revenue shares used earlier in the bottom-up approach. With the help of data triangulation and validation of data through primaries, the size of the overall Machine Safety and each individual markets have been determined and confirmed in this study.

Machine Safety Market Size, and Top-Down Approach

Data Triangulation

After arriving at the overall market size, the total market has been split into several segments. The market breakdown and data triangulation procedures have been employed wherever applicable to complete the overall market engineering process and arrive at exact statistics for all segments. The data has then been triangulated by studying various factors and trends from both the demand and supply sides. The market has also been validated using both top-down and bottom-up approaches.

Market Definition

A machine safety system is a set of measures and components designed to ensure the safety of operators and other personnel working with or near machines. These systems typically include physical guards, safety interlocks, emergency stops, warning signs, and other devices intended to prevent or minimize the risks of injury or harm.The primary goal of a machine safety system is to prevent accidents and injuries by reducing or eliminating the potential hazards associated with operating machines. The machine safety market is likely to witness significant growth in the coming years because it is essential for companies in the automotive, food & beverage, oil & gas, power generation, and chemical industries to invest in safety measures to reduce the risk of accidents and promote a safe working environment. Schneider Electric (France), Honeywell International Inc. (US), ABB (Switzerland), Rockwell Automation, Inc. (US), Siemens AG (Germany), Omron Corporation (Japan), Keyence Corporation (Japan), Yokogawa Electric Corporation (Japan), Emerson Electric Co. (US), and General Electric (US) are among a few key companies in this market.

Key Stakeholders

  • Original equipment manufacturers (OEMs)
  • Providers of technology solutions
  • Research institutes
  • Market research and consulting firms
  • Forums, alliances, and associations related to Machine Safety
  • Technology investors
  • Governments and financial institutions
  • Analysts and strategic business planners
  • Existing end users and prospective ones

Report Objectives:

  • To describe and forecast the Machine Safety market in terms of value based on offerings, components and industry
  • To describe and forecast the Machine Safety market size in terms of value with respect to 4 main regions, namely, North America, Europe, Asia Pacific, and the Rest of the World (RoW)
  • To provide detailed information regarding the drivers, restraints, opportunities, and challenges influencing the growth of the machine safety market
  • To provide a detailed overview of the supply chain of the s ecosystem
  • To analyze opportunities in the market for various stakeholders by identifying the high-growth segments of the market
  • To analyze the probable impact of the recession on the market in future
  • To benchmark the market players using the proprietary company evaluation matrix framework, which analyzes the market players on various parameters within the broad categories of market ranking/share and product portfolio
  • To analyze competitive developments such as acquisitions, product launches, partnerships, expansions, and collaborations undertaken in the Machine Safety market

Available Customization:

With the given market data, MarketsandMarkets offers customizations according to the company's specific needs. The following customization options are available for this report:

Company Information:

  • Detailed analysis and profiling of additional five market players
Custom Market Research Services

We will customize the research for you, in case the report listed above does not meet with your exact requirements. Our custom research will comprehensively cover the business information you require to help you arrive at strategic and profitable business decisions.

Request Customization

Instant Answers with GPT - Ask Now!

Ask real questions. Get complete answers !
Report Code
SE 2053
Published ON
Apr, 2023
Choose License Type
BUY NOW
  • SHARE
X
Request Customization
Speak to Analyst
Speak to Analyst
OR FACE-TO-FACE MEETING
PERSONALIZE THIS RESEARCH
  • Triangulate with your Own Data
  • Get Data as per your Format and Definition
  • Gain a Deeper Dive on a Specific Application, Geography, Customer or Competitor
  • Any level of Personalization
REQUEST A FREE CUSTOMIZATION
LET US HELP YOU!
  • What are the Known and Unknown Adjacencies Impacting the Machine Safety Market
  • What will your New Revenue Sources be?
  • Who will be your Top Customer; what will make them switch?
  • Defend your Market Share or Win Competitors
  • Get a Scorecard for Target Partners
CUSTOMIZED WORKSHOP REQUEST
+1-888-600-6441
  • Call Us
  • +1-888-600-6441 (Corporate office hours)
  • +1-888-600-6441 (US/Can toll free)
  • +44-800-368-9399 (UK office hours)
CONNECT WITH US
ABOUT TRUST ONLINE
©2023 MarketsandMarkets Research Private Ltd. All rights reserved
DMCA.com Protection Status Website Feedback