Machine-to-Machine (M2M) Connections Market by Technology (Wired, Wireless), Industry (Healthcare, Utilities, Retail, Consumer Electronics, Automotive & Transportation, Security & Surveillance), and Geography - Global Forecast to 2023


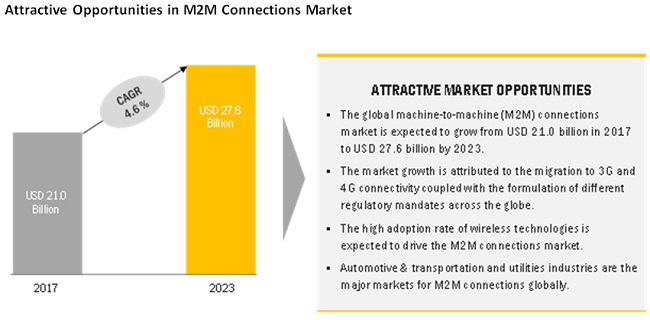
The machine-to-machine (M2M) connections market is expected grow from USD 19.31 billion in 2016 to USD 27.62 billion in 2023, at a CAGR of 4.6% from 2017 to 2023. The number of M2M connections was 1.47 billion connections in 2016 and is estimated to reach 3.00 billion by 2023. The major drivers for the growth are the growing penetration of the Internet in emerging economies and favorable regulatory mandates. Moreover, the increasing M2M connections in various industries and the growing adoption of new connectivity technologies such as 4G/LTE and Bluetooth Smart/BLE further accelerate its machine-to-machine (M2M) connections market growth.
Wireless connectivity technology accounted for the largest share in Machine-to-Machine (M2M) Connections Market
In the connectivity technology segment, wireless technology holds the largest share of the machine-to-machine (M2M) connections market in terms of the number of connections. Moreover, market for wireless technology is expected to grow at the highest rate in the M2M connections market from 2017 to 2023. The growing adoption of short-range wireless connectivity technologies such as Wi-Fi, Bluetooth, and ZigBee for multiple applications such as in-car infotainment systems, patient monitoring devices, wireless beacons, and smart appliances is driving the growth of the market for the wireless technology segment. Moreover, the substantial penetration of cellular services globally and increasing adoption of 4G/LTE cellular technology is further driving the growth of the wireless connectivity technology in the machine-to-machine (M2M) connections market.
Automotive and transportation accounted for the largest share among other verticals in Machine-to-Machine (M2M) Connections Market
Among the various end-user industries covered in this report, automotive and transportation held the largest market share, followed by the utilities vertical. The growing number of connected cars and the development of vehicle-to-vehicle and vehicle-to-infrastructure framework is driving the growth of this sector. The development of smart city projects and favorable regularity mandates for the adoption of smart grids and smart meters is expected to lead to the high CAGR of the machine-to-machine (M2M) connections market for utilities.
APAC accounted for significant share in Machine-to-Machine (M2M) Connections Market during forecast period
Of all the regions, Asia Pacific (APAC) held the largest market share in terms of revenue and is expected to grow at the highest CAGR from 2017 to 2023. The APAC region is a leading industrial hub as well as an emerging and important market for several other sectors as well. The growing penetration of the Internet across the commercial and residential spaces, large consumer base, increasing disposable income, and improving IT infrastructure are some of the key factors driving the growth of M2M connections market in APAC.
Key market players
AT&T Inc. (US), Huawei Technologies Co., Ltd. (China), Intel Corporation (US), Gemalto N.V. (Netherlands), Vodafone Group PLC (UK), China Mobile Ltd. (China), and NXP Semiconductors N.V. (Netherlands) are some of the leading players in the machine-to-machine (M2M) connections market as of 2016. These companies are focusing on market expansion through collaborations and partnerships and focus on inorganic strategies for development. AT&T Inc. (US), Huawei Technologies Co. Ltd. (China), and Vodafone Group PLC (UK) are the key players who are expanding their market through partnerships and collaborations.
Report Scope:
|
Report Metric |
Details |
|
Market Size Availability Years |
20152025 |
|
Base Year |
2016 |
|
Forecast Period |
20172025 |
|
Units |
Value in USD & Number of connections in millions |
|
Segments Covered |
Technology, End-User Industry |
|
Geographic Regions Covered |
Americas, APAC, Europe, and RoW |
|
Companies Covered |
Vodafone Group PLC (UK), AT&T Inc. (US), China Mobile Ltd. (China), Deutsche Telekom AG (Germany), Telefonica, S.A (Spain), Texas Instruments Incorporated (US), Intel Corporation (US), Gemalto N.V. (Netherlands), Cisco Systems Inc. (US), Huawei Technologies Co., Ltd. (China), Sprint Corporation (US), Verizon Communication Inc. (US), Orange S.A. (France), NXP Semiconductors N.V. (Netherlands), Sierra Wireless Inc. (Canada), ElefonaKTiebolaget Lm Ericsson (Sweden), Murata Manufacturing Co., Ltd. (Japan), U-Blox Holding AG (Switzerland), Telit Communications (UK), Kore Wireless Group (US), Fanstel Corporation (US), Commsolid GmbH (A Goodix Company) (Germany), Afero, Inc. (US), Meshify, Inc. (US), Idefigo Group Limited (New Zealand) |
This report categorizes the M2M Connections market based on technology, end-user industry, and region.
Machine-to-Machine (M2M) Connections Market, by Technology:
- Wired Technologies
- Ethernet
- Industrial
- Industrial Ethernet
- Modbus
- Profinet
- Foundation Fieldbus
- Wireless Technologies
- Short Range
- Wi-Fi
- Zigbee
- Bluetooth
- Cellular Network
- Second Generation (2G)
- Third Generation (3G)
- Fourth Generation (4G)/Long-Term Evolution (LTE)
- Short Range
Machine-to-Machine (M2M) Connections Market, by End-User Industry:
- Healthcare
- Patient Monitoring Systems
- Blood Pressure Monitor
- Blood Glucose Meter
- Multi-Parameter Monitor
- Fall Detector
- Smart Pill Dispenser
- Telemedicine
- Patient Monitoring Systems
- Utilities
- Smart Grids
- Smart Meters
- Automotive & Transportation
- Telematics
- Fleet Tracking/Monitoring
- Retail
- Intelligent Vending Machines
- Contactless Checkout/Pos
- Digital Signage
- Consumer Electronics
- Smart TV
- Smart Appliances
- Smart Refrigerator
- Smart Washing Machine
- Others
- Smart Oven
- Smart Cooktop
- Security & Surveillance
- Commercial & Residential Security
- Remote Surveillance
- Others
- Oil & Gas
- Agriculture
Machine-to-Machine (M2M) Connections Market, by Region:
- Americas
- North America
- US
- Canada
- Mexico
- South America
- North America
- Europe
- Germany
- France
- UK
- Rest of Europe
- APAC
- China
- Japan
- South Korea
- Rest of APAC
- RoW
- Middle East
- Africa
Recent Developments
- In February 2017, AT&T planned to deploy LTE-M services in the US by June 2017 and in Mexico by December 2017. The company already has a robust 4G LTE network providing coverage to nearly 400 million people in the US and Mexico. LTE-M is expected to leverage the growth of IoT in North America.
- In September 2016, Huawei launched its NB-IoT solution comprising Smart Device Solution enabled by Huawei LiteOS and NB-IoT Chipset, among others.
- In May 2016, Intel launched Intel AnyWAN GRX 750 SoC , Intel XWAY WAV500 WiFi chipset, and Intels new 5th Generation 11ac MU-MIMO Wi-Fi family of products at Computer 2016 held in Taipei (Taiwan). Intel AnyWAN GRX 750 SoC is designed for improving the performance of home gateways, whereas Intel XWAY WAV500 WiFi chipset is capable of delivering processing power and memory with 0 CPU utilization.
Key questions addressed in report
- Which are the key verticals in machine-to-machine (M2M) connections market? How big is the opportunity for the growth of the market for these applications in the major economies in the next 5 years?
- Which are the major companies in the M2M connections market? What are their major strategies to strengthen their market presence?
- Which are the leading countries in the overall machine-to-machine (M2M) connections market? What would be the share of APAC, North America, and Europe in this market in the next 5 years?
- What will be the role of the standards and regulations by governments and associations in the adoption of machine-to-machine (M2M) connections market?
To speak to our analyst for a discussion on the above findings, click Speak to Analyst
Table of Contents
1 Introduction (Page No. - 15)
1.1 Objectives of the Study
1.2 Market Definition
1.3 Study Scope
1.3.1 Markets Covered
1.3.2 Years Considered for the Study
1.4 Currency
1.5 Limitations
1.6 Stakeholders
2 Research Methodology (Page No. - 19)
2.1 Research Data
2.1.1 Secondary and Primary Research
2.1.1.1 Key Industry Insights
2.1.2 Secondary Data
2.1.2.1 Key Data From Secondary Sources
2.1.3 Primary Data
2.1.3.1 Primary Interviews With Experts
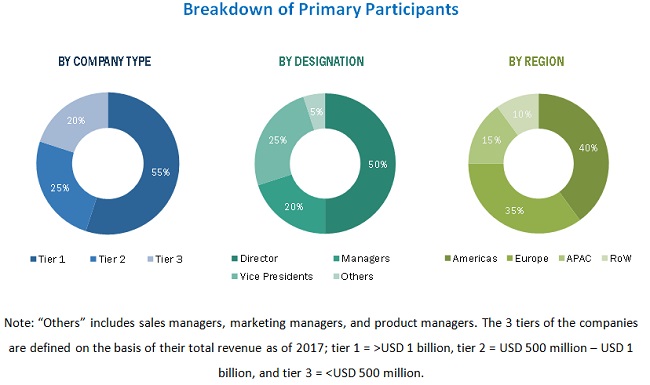
2.1.3.2 Breakdown of Primaries
2.1.3.3 Key Data From Primary Sources
2.2 Market Size Estimation
2.2.1 Bottom-Up Approach
2.2.1.1 Approach for Capturing the Market Share By Bottom-Up Analysis (Demand Side)
2.2.2 Top-Down Approach
2.2.2.1 Approach for Capturing the Market Share By Top-Down Analysis (Supply Side)
2.3 Market Breakdown and Data Triangulation
2.4 Research Assumptions
3 Executive Summary (Page No. - 30)
4 Premium Insights (Page No. - 34)
4.1 Attractive Opportunities in the M2M Connections Market
4.2 M2M Connections Market, By End-User Industry and Country
4.3 Short Range M2M Connections Market, By Wireless Technology
4.4 M2M Connections Market, By Geography
5 Market Overview (Page No. - 38)
5.1 Introduction
5.2 Market Dynamics
5.2.1 Drivers
5.2.1.1 Growing Penetration of the Internet
5.2.1.2 Favorable Regulatory Mandates
5.2.1.3 Increasing M2M Connections Among Various Industry Verticals
5.2.1.4 Growing Adoption of 4G/LTE Cellular Technologies and Rising Demand for Extended Network Coverage
5.2.2 Restraints
5.2.2.1 Lack of Standardization in Connectivity Protocols
5.2.2.2 Inability to Leverage the Benefits of Mobility
5.2.3 Opportunities
5.2.3.1 Strategic Partnerships With System Integrators
5.2.3.2 Growing Demand From New Markets Such as Smart Cities and Connected Cars
5.2.4 Challenges
5.2.4.1 Privacy and Security
6 M2M Connections Market, By Technology (Page No. - 46)
6.1 Introduction
6.2 Wired Technologies
6.2.1 Ethernet
6.2.2 Industrial
6.2.2.1 Industrial Ethernet
6.2.2.2 Modbus
6.2.2.3 Profinet
6.2.2.4 Foundation Fieldbus
6.3 Wireless Technologies
6.3.1 Short Range
6.3.1.1 Wi-Fi
6.3.1.2 Zigbee
6.3.1.3 Bluetooth
6.3.2 Cellular Network
6.3.2.1 Second Generation (2G)
6.3.2.2 Third Generation (3G)
6.3.2.3 Fourth Generation (4G)/Long-Term Evolution (LTE)
7 Machine-to-Machine (M2M) Connections Market, By End-User Industry (Page No. - 64)
7.1 Introduction
7.2 Healthcare
7.2.1 Patient Monitoring Systems
7.2.1.1 Blood Pressure Monitor
7.2.1.2 Blood Glucose Meter
7.2.1.3 Multi-Parameter Monitor
7.2.2 Fall Detector
7.2.3 Smart Pill Dispenser
7.2.4 Telemedicine
7.3 Utilities
7.3.1 Smart Grids
7.3.2 Smart Meters
7.4 Automotive & Transportation
7.4.1 Telematics
7.4.2 Fleet Tracking/Monitoring
7.5 Retail
7.5.1.1 Intelligent Vending Machines
7.5.1.2 Contactless Checkout/Pos
7.5.1.3 Digital Signage
7.6 Consumer Electronics
7.6.1 Smart TV
7.6.2 Smart Appliances
7.6.2.1 Smart Refrigerator
7.6.2.2 Smart Washing Machine
7.6.2.3 Others
7.6.2.3.1 Smart Oven
7.6.2.3.2 Smart CooKTop
7.7 Security & Surveillance
7.7.1 Commercial & Residential Security
7.7.2 Remote Surveillance
7.8 Others
7.8.1 Oil & Gas
7.8.2 Agriculture
8 Geographic Analysis (Page No. - 91)
8.1 Introduction
8.2 Americas
8.3 Europe
8.4 Asia Pacific
8.5 Rest of the World
9 Competitive Landscape (Page No. - 108)
9.1 Introduction
9.2 Market Ranking Analysis, 2016: M2M Connections Market
9.3 Vendor Dive Overview of M2M Connections Market
9.3.1 Visionary Leaders
9.3.2 Dynamic Differentiators
9.3.3 Innovators
9.3.4 Emerging Companies
9.4 Business Strategies Adopted By Players in the M2M Connections Market (25 Companies)
9.5 Analysis of the Product Portfolio of the Players in the M2M Connections Market (25 Companies)
Top 25 Companies Analyzed for This Study are - Vodafone Group PLC (UK), AT&T Inc. (US), China Mobile Ltd. (China), Deutsche Telekom AG (Germany), Telefonica, S.A (Spain), Texas Instruments Incorporated (US), Intel Corporation (US), Gemalto N.V. (Netherlands), Cisco Systems Inc. (US), Huawei Technologies Co., Ltd. (China), Sprint Corporation (US), Verizon Communication Inc. (US), Orange S.A. (France), NXP Semiconductors N.V. (Netherlands), Sierra Wireless Inc. (Canada), ElefonaKTiebolaget Lm Ericsson (Sweden), Murata Manufacturing Co., Ltd. (Japan), U-Blox Holding AG (Switzerland), Telit Communications (UK), Kore Wireless Group (US), Fanstel Corporation (US), Commsolid GmbH (Germany), Afero, Inc. (US), Meshify, Inc. (US), Idefigo Group Limited (New Zealand)
10 Company Profiles (Page No. - 116)
(Business Overview, Products Offered & Business Strategies, Key Relationships, Recent Developments, MnM View)*
10.1 Introduction
10.2 AT&T Inc.
10.3 Cisco Systems Inc.
10.4 Huawei Technologies Co., Ltd.
10.5 NXP Semiconductors N.V.
10.6 Texas Instruments Incorporated
10.7 Intel Corporation
10.8 Gemalto N.V.
10.9 Vodafone Group PLC
10.10 Murata Manufacturing Co., Ltd.
10.11 U-Blox Holding AG
10.12 Fanstel Corporation
10.13 Commsolid GmbH
10.14 Key Innovators
10.14.1 Afero, Inc.
10.14.2 Revogi Innovation Co., Ltd.
10.14.3 Virscient Limited
*Details on Business Overview, Products Offered & Business Strategies, Key Relationships, Recent Developments, MnM View Might Not Be Captured in Case of Unlisted Companies.
11 Appendix (Page No. - 156)
11.1 Insights From Industry Experts
11.2 Discussion Guide
11.3 Knowledge Store: Marketsandmarkets Subscription Portal
11.4 Introducing RT: Real-Time Market Intelligence
11.5 Available Customizations
11.6 Related Reports
11.7 Author Details
List of Tables (64 Tables)
Table 1 List of Major Secondary Sources
Table 2 M2M Connections Market, By Technology, 20152023 (USD Million)
Table 3 Market, By Technology, 20152023 (Million Connections)
Table 4 Machine-to-Machine (M2M) Connections Market for Wired Technology, By End-User Industry, 20152023 (USD Million)
Table 5 Market for Wired Technology, By End-User Industry, 20152023 (Million Connections)
Table 6 Market for Wired Technology, By Region, 20152023 (USD Million)
Table 7 Market for Wired Technology, By Region, 20152023 (Million Connections)
Table 8 M2M Connections Market for Wireless Technology, By Type, 20152023 (USD Million)
Table 9 Market for Wireless Technology, By Type, 20152023 (Million Connections)
Table 10 Market for Wireless Technology, By End-User Industry, 20152023 (USD Million)
Table 11 Market for Wireless Technology, By End-User Industry, 20152023 (Million Connections)
Table 12 Market for Wireless Technology, By Region, 20152023 (USD Million)
Table 13 M2M Connections Market for Wireless Technology, By Region, 20152023 (Million Connections)
Table 14 Short-Range M2M Connections Market, By Type, 20152023 (USD Million)
Table 15 Short Range Market, By Type, 20152023 (Million Connections)
Table 16 Short Range Market, By End-User Industry, 20152023 (USD Million)
Table 17 Short Range Market, By End-User Industry, 20152023 (Million Connections)
Table 18 Cellular Machine-to-Machine (M2M) Connections Market, By Type, 20152023 (USD Million)
Table 19 Cellular Market, By Type, 20152023 (Million Connections)
Table 20 Cellular Market, By End-User Industry, 20152023 (USD Million)
Table 21 Cellular Market, By End-User Industry, 20152023 (Million Connections)
Table 22 Market, By End-User Industry, 20152023 (USD Million)
Table 23 M2M Connections Market, By End-User Industry, 20152023 (Million Connections)
Table 24 Wired M2M Connections Market for Healthcare, By Region, 20152023 (USD Million)
Table 25 Wired Machine-to-Machine (M2M) Connections Market for Healthcare, By Region, 20152023 (Million Connections)
Table 26 Wireless Market for Healthcare, By Region, 20152023 (USD Million)
Table 27 Wireless Market for Healthcare, By Region, 20152023 (Million Connections)
Table 28 Wired Market for Utilities, By Region, 20152023 (USD Million)
Table 29 Wired Market for Utilities, By Region, 20152023 (Million Connections)
Table 30 Wireless Market for Utilities, By Region, 20152023 (USD Million)
Table 31 Wireless Market for Utilities, By Region, 20152023 (Million Connections)
Table 32 Wired M2M Connections for Automotive & Transportation, By Region, 20152023 (USD Million)
Table 33 Wired Market for Automotive & Transportation, By Region, 20152023 (Million Connections)
Table 34 Wireless Market for Automotive & Transportation, By Region, 20152023 (USD Million)
Table 35 Wireless Market for Automotive & Transportation, By Region, 20152023 (Million Connections)
Table 36 Wired M2M Connections Market for Retail, By Region, 20152023 (USD Million)
Table 37 Wired Market for Retail, By Region, 20152023 (Million Connections)
Table 38 Wireless Market for Retail, By Region, 20152023 (USD Million)
Table 39 Wireless Market for Retail, By Region, 20152023 (Million Connections)
Table 40 Wired Market for Consumer Electronics, By Region, 20152023 (USD Million)
Table 41 Wired Market for Consumer Electronics, By Region, 20152023 (Million Connections)
Table 42 Wireless Market for Consumer Electronics, By Region, 20152023 (USD Million)
Table 43 Wireless Market for Consumer Electronics, By Region, 20152023 (Million Connections)
Table 44 Wired Market for Security & Surveillance, By Region, 20152023 (USD Million)
Table 45 Wired Market for Security & Surveillance, By Region, 20152023 (Million Connections)
Table 46 Wireless Market for Security & Surveillance, By Region, 20152023 (USD Million)
Table 47 Wireless Market for Security & Surveillance, By Region, 20152023 (Million Connections)
Table 48 Wired Market for Others, By Region, 20152023 (USD Million)
Table 49 Wired Market for Others, By Region, 20152023 (Million Connections)
Table 50 Wireless Market for Others, By Region, 20152023 (USD Million)
Table 51 Wireless Market for Others, By Region, 20152023 (Million Connections)
Table 52 Market, By Region, 20152023 (USD Million)
Table 53 M2M Connections Market, By Region, 20152023 (Million Connections)
Table 54 Market in Americas, By Region, 20152023 (USD Million)
Table 55 Market in Americas, By Region, 20152023 (Million Connections)
Table 56 Market in North America, By Country, 20152023 (USD Million)
Table 57 Market in North America, By Country, 20152023 (Million Connections)
Table 58 Machine-to-Machine (M2M) Connections Market in Europe, By Country, 20152023 (USD Million)
Table 59 Market in Europe, By Country, 20152023 (Million Connections)
Table 60 Market in Apac, By Country, 20152023 (USD Million)
Table 61 Market in Apac, By Country, 20152023 (Million Connections)
Table 62 Market in RoW, By Region, 20152023 (USD Million)
Table 63 Market in RoW, By Region, 20152023 (Million Connections)
Table 64 Ranking of Major Players in the M2M Connections Market, 2016
List of Figures (44 Figures)
Figure 1 Machine-to-Machine (M2M) Connections Market: Research Design
Figure 2 Market Size Estimation Methodology: Bottom-Up Approach
Figure 3 Market Size Estimation Methodology: Top-Down Approach
Figure 4 Data Triangulation
Figure 5 Assumptions for the Research Study
Figure 6 Market Size, in Terms of Value and Volume, 20172023
Figure 7 Market, By Technology, 20172023 (Billion Connections)
Figure 8 Snapshot: Machine-to-Machine (M2M) Connections Market Share (In Terms of Volume), By End-User Industry (2017 & 2023)
Figure 9 M2M Connections Market, in Terms of Volume, By Geography, 2016
Figure 10 The Global Market Presents Lucrative Opportunities
Figure 11 Automotive & Transportation End-User Industry Held the Largest Share of the Market, in Terms of Volume, in 2016
Figure 12 Bluetooth Technology Expected to Witness the Highest Growth Rate During the Forecast Period
Figure 13 APAC to Register the Highest Growth Rate in the M2M Connections Market, in Terms of Volume, During the Forecast Period
Figure 14 Growing Penetration of the Internet and Favourable Federal Mandates Act as Major Driving Factors for the Market
Figure 15 Number of Internet Users, By Region, March 2017
Figure 16 Internet Penetration Rate, By Region, March 2017
Figure 17 Prominent Smart City Projects Across the Globe
Figure 18 M2M Connections Market, By Technology
Figure 19 M2M Connections Market Size, By Technology, 20172023 (Million Connections)
Figure 20 M2M Connections Market for Wireless Technology, 20172023 (USD Million)
Figure 21 Short Range M2M Connections Market Size, By Connectivity Technology, 20152023 (Million Connections)
Figure 22 Market, By End-User Industry
Figure 23 Market, By End-User Industry, 20172023 (Million Connections)
Figure 24 Market for Utilities, By Technology, 20172023 (Million Connections)
Figure 25 Market for Retail, By Technology, 20172023 (Million Connections)
Figure 26 Market for Consumer Electronics, By Technology, 20152023 (Million Connections)
Figure 27 Increased Government Spending and Favourable Regulatory Mandates in Technologically Advancing Countries are Paving the Way for Market in Asia Pacific
Figure 28 M2M Connections Market, By Geography
Figure 29 Market Snapshot: Americas
Figure 30 Market Snapshot: Europe
Figure 31 Market Snapshot: Asia Pacific
Figure 32 Market Snapshot: Rest of the World
Figure 33 Companies Adopted Product Launches and Collaboration as the Key Growth Strategies Between 2014 and 2017
Figure 34 Dive Chart
Figure 35 AT&T Inc.: Company Snapshot
Figure 36 Cisco Systems Inc.: Company Snapshot
Figure 37 Huawei Technologies Co., Ltd.: Company Snapshot
Figure 38 NXP Semiconductors N.V.: Company Snapshot
Figure 39 Texas Instruments Incorporated: Company Snapshot
Figure 40 Intel Corporation: Company Snapshot
Figure 41 Gemalto B.V. : Company Snapshot
Figure 42 Vodafone Group PLC : Company Snapshot
Figure 43 Murata Manufacturing Co., Ltd.: Business Overview
Figure 44 U-Blox Holding AG: Business Overview
The study involved 4 major activities in estimating the current size of the M2M connections market. Exhaustive secondary research has been conducted to collect information about the market, the peer market, and the parent market. Validating findings, assumptions, and sizing with industry experts across the value chain through primary research has been the next step. Both, top-down and bottom-up approaches have been employed to estimate the complete market size. In the subsequent steps, market breakdown and data triangulation methods have been used to estimate the market size of segments and subsegments.
Secondary Research
The research methodology used to estimate and forecast the machine-to-machine (M2M) connections market begins with capturing data on revenues and unit shipment of the key vendors in the market through secondary research. This study involves the use of extensive secondary sources, directories, and databases such as Hoovers, Bloomberg Businessweek, Factiva, and OneSource to identify and collect information useful for the technical and commercial study of the M2M connections market. Moreover, secondary sources include annual reports, press releases, and investor presentations of companies; white papers, certified publications, and articles from recognized authors; directories; and databases. Secondary research has been mainly done to obtain key information about the supply chain and value chain of the industry; total pool of key players; classification and segmentation of the market according to industry trends; geographic markets; and key developments from both market- and technology-oriented perspectives.
Primary Research
In the primary research process, various primary sources from both supply and demand sides were interviewed to obtain the qualitative and quantitative information relevant to M2M connections market. Primary sources from the supply side include experts such as CEOs, VPs, marketing directors, technology and innovation directors, application users, and related executives from various key companies and organizations operating in the M2M ecosystem.
To know about the assumptions considered for the study, download the pdf brochure
Market Size Estimation
Both, top-down and bottom-up approaches have been used to estimate and validate the overall size of the M2M connections market. These methods have also been used extensively to estimate the size of various market subsegments. The research methodology used to estimate the market size includes the following:
- Key players in major technologies and markets have been identified through extensive secondary research.
- The industrys supply chain and market size, in terms of value, have been determined through primary and secondary research processes.
- All percentage shares, splits, and breakdowns have been determined using secondary sources and verified through primary sources.
Data Triangulation
After arriving at the overall market size using the estimation processes as explained above, the market was split into several segments and subsegments. To complete the overall market engineering process and arrive at the exact statistics of each market segment and subsegment, data triangulation and market breakdown procedures have been employed, wherever applicable. The data have been triangulated by studying various factors and trends from both demand and supply sides.
Report Objectives
- To define, describe, and forecast the overall Machine-to-Machine (M2M) connections market on the basis of technology, end-user industry, and geography
- To strategically analyze the micromarkets1 with respect to individual growth trends, prospects, and contribution to the total market
- To analyze the opportunities in the M2M connections market for stakeholders and detail the competitive landscape for the market players
- To forecast the market size for various segments with respect to four main regionsAmericas, Europe, Asia Pacific (APAC), and Rest of the World (RoW)
- To strategically profile the key players and comprehensively analyze the market rankings and core competencies2
- To provide detailed information regarding the major factors influencing the growth of the M2M connections market (drivers, restraints, opportunities, and industry-specific challenges)
- To analyze the competitive developments such as joint ventures, mergers and acquisitions, product launches, and research and development (R&D) activities in the M2M connections market
- To map the competitive intelligence based on the company profiles, key player strategies, and game-changing developments such as product developments, collaborations, and acquisitions
- To benchmark players within the market using proprietary Vendor DIVE framework, which analyzes market players on various parameters within the broad categories of business and product strategy.
Available Customizations
With the given market data, MarketsandMarkets offers customizations according to the companys specific needs. The following customization options are available for the report:
Geograpic Analysis
- Country-wise breakdown of various geographies including Americas, Europe, Asia Pacific (APAC), and Rest of the World (RoW)
- Market segmentation of various end-user industries into application segments
- Comprehensive coverage of regulations followed in each region (Americas, APAC, Europe, and RoW)
Company Information
- Detailed analysis and profiling of additional market players (up to 5)


Growth opportunities and latent adjacency in Machine-to-Machine (M2M) Connections Market