Magnetic Resonance Imaging Systems Market by Architecture (Open MRI Systems and Closed MRI Systems (Standard Bore and Wide Bore)), Field Strength (Low-to-mid Field, High-field (1.5T and 3T), and Very-high Field) - Global Forecast to 2023


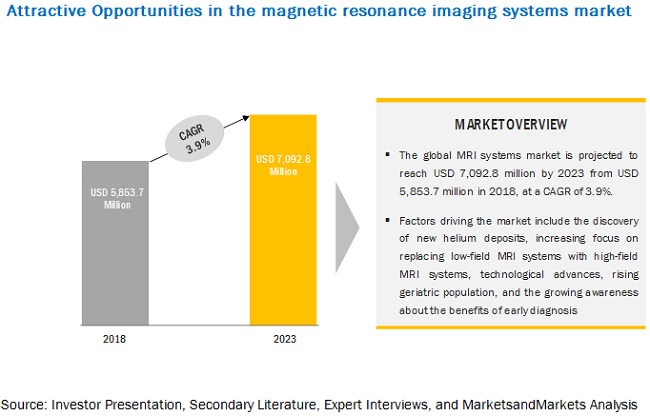
[158 Pages Report] MarketsandMarkets forecasts the Magnetic Resonance Imaging Systems market to expected to reach USD 7.09 billion by 2023 from an estimated USD 5.85 billion in 2018, at a CAGR of 3.9% during the forecast period. The key factors driving the growth of this market include, rising awareness about the benefits of early diagnosis, technological advancements leading to the replacement of low-field MRI systems with high-field MRI systems, and discovery of new helium deposits. On the other hand, the high cost of MRI systems, incompatibility of MRI systems in some patients, and declining reimbursement rates for MRI procedures are likely to restrain the growth of this market to a certain extent.
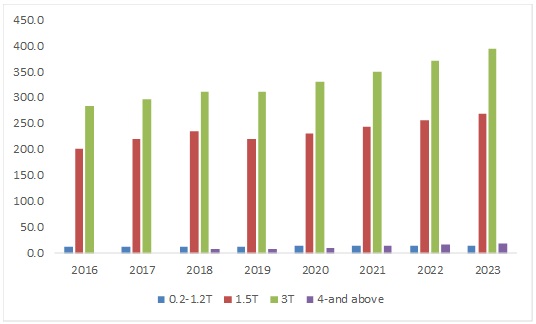
By field strength, Very-high-field MRI (4T and Above) segment is expected to grow at the highest growth rate during the forecast period
The market for very-high-field MRI systems is in its nascent stage, most of these systems are used in research. This market, by value, is expected to grow at the highest rate during the forecast period.
By architecture, closed MRI systems segment to record the highest CAGR during the forecast period
The closed MRI systems segment accounted for the largest share of the global MRI systems market in 2017 and is projected to register the highest CAGR during the forecast period. Closed MRI systems are more powerful and offer higher image quality and throughput.
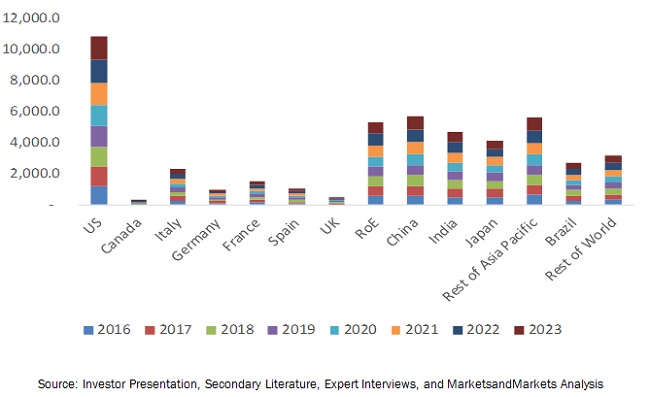
Asia Pacific to account for the largest market size during the forecast period.
Asia Pacific accounted for the largest share of the global MRI systems market. Growth in this market can be attributed to the rising geriatric population, increasing FDI (enabling local and foreign MRI manufacturers to invest in MRI development projects), improving healthcare infrastructure, increasing disposable incomes, and rising demand for high-field MRI equipment in several APAC countries.
Market Dynamics
Driver: Technological advancements in the strength of MRI
Advancements in MRI techniques, such as superconducting (SC) magnets, open architecture, high-field MRI, and software applications, are generating interest among academic institutes, research laboratories, hospitals, and physicians. Additionally, the advent of MRI-compatible pacemakers will significantly increase the number of patients eligible for MRI procedures. The growth of MRI systems in developed markets such as North America and Europe is mainly driven by replacement. The prime factors responsible for the new wave of replacement include the introduction of MRI scanners with wider patient bores and replacement of existing MRI systems that have reached optimum utilization
Restraint: High cost of MRI system and incompatibility with some patient populations
MRI machines come in a variety of sizes and magnetic strengths. The average sales price for MRI systems with a magnetic strength of 1.5T and less is approximately USD 1.5 million. While 1.5T MRI systems with superconducting magnets also cost high. Similarly, high-field (3T) MRI systems cost approximately USD 2.55 million. Moreover, even refurbished low-field MRI systems can cost USD few millions. The high cost of MRI solutions is expected to restrain the market growth. Moreover, MRI systems might induce malfunctioning or permanent damage to implantable devices such as pacemakers and ICDs. In addition, orthopedic implants such as screws, plates, or artificial joints produce distorted images in an MRI scan. The incompatibility of MRI systems for patients with implants is therefore adversely affecting the growth potential of this market
Opportunity: Emerging potential markets
Countries such as China, India, and Brazil as well as some emerging countries in the Middle East & Africa are expected to emerge as revenue pockets for MRI manufacturers. To tap the growth opportunities in emerging markets, companies such as GE and Philips have developed MRI systems for customers in Asia, South America, and Africa. The machines are built with a smaller footprint to be installed in smaller hospitals and is simple, easy to use, and economical to install and maintain.
Challenge: Dearth of skilled professional
A high degree of technical skill is required to handle advanced and sophisticated MRI systems. With advancements in MRI systems, technicians are required to apply machine learning to CNNs (convolutional neural networks) and RNNs (recurrent neural networks) for image segmentation (partitioning images into different biologically similar regions and extracting key features) and registration (combining and analyzing multiple images of the same area for better accuracy).
Get online access to the report on the World's First Market Intelligence Cloud
- Easy to Download Historical Data & Forecast Numbers
- Company Analysis Dashboard for high growth potential opportunities
- Research Analyst Access for customization & queries
- Competitor Analysis with Interactive dashboard
- Latest News, Updates & Trend analysis
Request Sample Scope of the Report
Get online access to the report on the World's First Market Intelligence Cloud
- Easy to Download Historical Data & Forecast Numbers
- Company Analysis Dashboard for high growth potential opportunities
- Research Analyst Access for customization & queries
- Competitor Analysis with Interactive dashboard
- Latest News, Updates & Trend analysis

|
Report Metric |
Details |
|
Market size available for years |
20172023 |
|
Base year considered |
2017 |
|
Forecast period |
20182023 |
|
Forecast units |
Million (USD) |
|
Segments covered |
Field Strength (High-field MRI systems (1.5T to 3T), Low-to-mid-field MRI systems (<1.5T), Very-high-field MRI systems (4T and above)), Architecture (Closed MRI systems, Open MRI systems) and Region |
|
Geographies covered |
North America, Europe, APAC, RoW |
|
Companies covered |
Hitachi, Siemens Healthineers, Canon Medical Systems, GE Healthcare, Philips, Aspect Imaging, Bruker, Aurora Imaging Technology, Esaote S.P.A, Fonar, Neusoft Medical Systems, Shenzhen Mindray Bio-Medical Electronics |
Get online access to the report on the World's First Market Intelligence Cloud
- Easy to Download Historical Data & Forecast Numbers
- Company Analysis Dashboard for high growth potential opportunities
- Research Analyst Access for customization & queries
- Competitor Analysis with Interactive dashboard
- Latest News, Updates & Trend analysis
Request Sample Scope of the Report
:
Get online access to the report on the World's First Market Intelligence Cloud
- Easy to Download Historical Data & Forecast Numbers
- Company Analysis Dashboard for high growth potential opportunities
- Research Analyst Access for customization & queries
- Competitor Analysis with Interactive dashboard
- Latest News, Updates & Trend analysis
The research report categorizes the MRI systems market into the following segments and subsegments:
MRI Systems Market, by Field Strength
- High-field MRI systems (1.5T to 3T)
- 1.5T MRI systems
- 3T MRI systems
- Low-to-mid-field MRI systems (<1.5T)
- Very-high-field MRI systems (4T and above)
MRI Systems Market, by Architecture
- Closed MRI systems
- Standard bore MRI
- Wide bore MRI
- Open MRI systems
MRI Systems Market, by Region
- North America
- US
- Canada
- Europe
- Germany
- Italy
- France
- Spain
- UK
- Rest of Europe
- Asia Pacific (APAC)
- China
- Japan
- India
- Rest of APAC
- Rest of the World
- Brazil
- Other RoW countries
Key Market Players
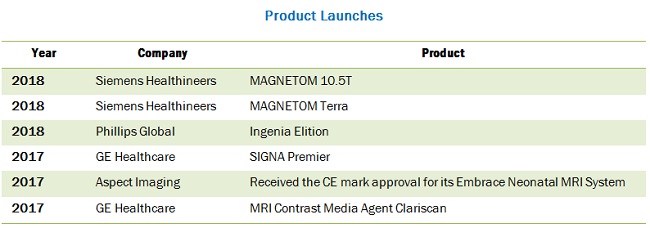
The key players in this market are Siemens Healthineers (Germany), GE Healthcare (US), Phillips (Netherlands), Hitachi (Japan), and Canon Medical Systems (Japan). Other players in this market include Esaote (Italy), Aspect Imaging (Israel), FONAR (US), Neusoft Medical Systems (China), Aurora Imaging Technology (US), and Mindray (China).
Recent Developments
Critical questions the report answers:
- Where will all these developments take the industry in the long term?
- What are the upcoming trends for the MRI market?
- Which segment provides the most opportunity for growth?
- Who are the leading vendors operating in this market?
- What are the opportunities for new market entrants?
To speak to our analyst for a discussion on the above findings, click Speak to Analyst
Table of Contents
1 Introduction (Page No. - 15)
1.1 Objectives of the Study
1.2 Market Definition
1.2.1 Markets Covered
1.2.2 Years Considered for the Study
1.3 Currency
1.4 Limitations
1.5 Assumptions
1.6 Stakeholders
2 Research Methodology (Page No. - 18)
2.1 Primary Data
2.1.1 Key Data From Primary Sources
2.1.2 Key Industry Insights
2.2 Secondary Data
2.2.1 Key Data From Secondary Sources
2.3 Market Size Estimation
2.4 Market Breakdown and Data Triangulation
2.4.1 Assumptions for the Study
3 Executive Summary (Page No. - 26)
4 Premium Insights (Page No. - 30)
4.1 MRI Systems Market Overview
4.2 Asia Pacific magnetic resonance imaging systems market : By Field Strength & Country
4.3 MRI Scanning Market, Developed vs Developing Countries (2018 vs 2023)
4.4 Global MRI Systems Market: Geographic Snapshot
5 Market Overview (Page No. - 33)
5.1 Introduction
5.2 Evolution
5.3 Market Dynamics
5.3.1 Drivers
5.3.1.1 Discovery of New Helium Deposits
5.3.1.2 Technological Advancements
5.3.1.3 Increasing Focus on the Replacement of Low-Field MRI Systems With High-Field MRI Systems
5.3.1.4 Increasing Geriatric Population
5.3.1.5 Rising Awareness on Early Diagnosis
5.3.2 Restraints
5.3.2.1 High Cost of MRI Systems
5.3.2.2 Incompatibility of MRI Systems in Some Patient Populations
5.3.2.3 Declining Reimbursement Rates for MRI Procedures and Uncertain Outcomes of Healthcare Reforms
5.3.3 Opportunities
5.3.3.1 Emerging Markets
5.3.3.2 Novel Application Areas Such as Detection of Multiple Sclerosis and Metastasis in Cancer
5.3.3.3 Hybrid MRI Systems
5.3.4 Challenges
5.3.4.1 Dearth of Skilled Personnel
5.3.5 Regulatory Landscape
5.3.5.1 US
5.3.5.2 Canada
5.3.5.3 Europe
5.3.5.4 Australia
5.3.5.5 China
5.3.5.6 India
5.3.5.7 Japan
5.3.5.8 South Korea
6 MRI Scanning Market, By Field Strength (Page No. - 44)
6.1 Introduction
6.2 High-Field MRI Systems (1.5t to 3t)
6.2.1 1.5t MRI Systems
6.2.2 3t MRI Systems
6.3 Low-To-Mid-Field MRI Systems (<1.5t)
6.4 Very-High-Field MRI Systems (4t and Above)
7 MRI Scanning Market, By Architecture (Page No. - 52)
7.1 Introduction
7.2 Closed MRI Systems
7.3 Standard Bore MRI
7.4 Wide-Bore MRI
7.5 Open MRI Systems
8 MRI Scanning Market, By Region (Page No. - 57)
8.1 Introduction
8.2 North America
8.2.1 US
8.2.2 Canada
8.3 Europe
8.3.1 Germany
8.3.2 France
8.3.3 UK
8.3.4 Italy
8.3.5 Spain
8.3.6 Rest of Europe
8.4 Asia Pacific (APAC)
8.4.1 China
8.4.2 Japan
8.4.3 India
8.4.4 Rest of Asia Pacific
8.5 Rest of the World (RoW)
8.5.1 Brazil
8.5.2 Other RoW Countries
9 Competitive Landscape (Page No. - 115)
9.1 Overview
9.2 Market Share Analysis
9.3 Competitive Scenario
9.3.1 Product Launches and Approvals
9.3.2 Collaborations, Partnerships, and Agreements
9.3.3 Acquisitions
9.3.4 Expansions
10 Company Profiles (Page No. - 120)
(Introduction, Products & Services, Strategy, & Analyst Insights, Developments, MnM View)*
10.1 Hitachi
10.2 Siemens Healthineers
10.3 Canon Medical Systems
10.4 GE Healthcare
10.5 Philips
10.6 Aspect Imaging
10.7 Bruker
10.8 Aurora Imaging Technology
10.9 Esaote S.P.A
10.10 Fonar
10.11 Neusoft Medical Systems
10.12 Shenzhen Mindray Bio-Medical Electronics
*Details on Marketsandmarkets View, Introduction, Product & Services, Strategy, & Analyst Insights, New Developments Might Not Be Captured in Case of Unlisted Companies.
11 Appendix (Page No. - 149)
11.1 Insights of Industry Experts
11.2 Discussion Guide
11.3 Knowledge Store: Marketsandmarkets Subscription Portal
11.4 Introducing RT: Real-Time Market Intelligence
11.5 Available Customizations
11.6 Related Reports
11.7 Author Details
List of Tables (141 Tables)
Table 1 Regulatory Landscape Analysis, By Country
Table 2 MRI Systems Market, By Field Strength, 20162023 (USD Million)
Table 3 Magnetic resonance imaging systems market , By Field Strength, 20162023 (New Installations Per Year)
Table 4 High-Field MRI Scanning Market, By Region, 20162023 (USD Million)
Table 5 High-Field MRI Scanning Market, By Region, 20162023 (No. of New Installations)
Table 6 1.5t Systems Market, By Region, 20162023 (USD Million)
Table 7 1.5t Market , By Region, 20162023 (No. of New Installations)
Table 8 3t MRI Market, By Region, 20162023 (USD Million)
Table 9 3t MRI Market, By Region, 20162023 (No. of New Installations)
Table 10 Low-To-Mid-Field - Market, By Region, 20162023 (USD Million)
Table 11 Low-To-Mid-Field - MRI Test Market, By Region, 20162023 (New Installations Per Year)
Table 12 Very-High-Field - Market, By Region, 20162023 (USD Million)
Table 13 Very-High-Field Magnetic resonance imaging systems market , By Region, 20162023 (No. of New Installations)
Table 14 Market, By Architecture, 20162023 (USD Million)
Table 15 Closed Magnetic resonance imaging systems market , By Type, 20162023 (USD Million)
Table 16 Closed MRI Systems Market, By Region, 20162023 (USD Million)
Table 17 Standard Bore MRI Systems Market, By Region, 20162023 (USD Million)
Table 18 Wide-Bore Magnetic resonance imaging systems market , By Region, 20162023 (USD Million)
Table 19 Open MRI Scanning Market, By Region, 20162023 (USD Million)
Table 20 Market , By Region, 20162023 (USD Million)
Table 21 MRI Systems Market, By Region, 20162023 (No. of Installations)
Table 22 North America: MRI Test Market, By Country, 20162023 (USD Million)
Table 23 North America: Market, By Country, 20162023 (No. of Installations)
Table 24 North America: Magnetic resonance imaging systems market , By Architecture, 20162023 (USD Million)
Table 25 North America: Closed MRI Scanning Market, By Type, 20162023 (USD Million)
Table 26 North America: Magnetic resonance imaging systems market , By Field Strength, 20162023 (USD Million)
Table 27 North America: MRI Application Market, By Field Strength, 20162023 (No .Of Installations)
Table 28 North America: High-Field MRI Test Market, By Field Strength, 20162023 (USD Million)
Table 29 North America: High-Field MRI Systems Market, By Field Strength, 20162023 (No .Of Installations)
Table 30 US: Market, By Architecture, 20162023 (USD Million)
Table 31 US: Closed MRI Scanning Market, By Type, 20162023 (USD Million)
Table 32 US: Market, By Field Strength, 20162023 (USD Million)
Table 33 US: MRI Scanning Market, By Field Strength, 20162023 (No. of Installations)
Table 34 US: High-Field MRI Systems Market, By Field Strength, 20162023 (USD Million)
Table 35 US: High-Field MRI Test Market, By Field Strength, 20162023 (No. of Installations)
Table 36 Canada: Market, By Architecture, 20162023 (USD Million)
Table 37 Canada: Closed MRI Systems Market, By Type, 20162023 (USD Million)
Table 38 Canada: MRI Application Market, By Field Strength, 20162023 (USD Million)
Table 39 Canada: MRI Scanning Market, By Field Strength, 20162023 (No. of Installations)
Table 40 Canada: High-Field MRI Systems Market, By Field Strength, 20162023 (USD Million)
Table 41 Canada: High-Field MRI Test Market, By Field Strength, 20162023 (No. of Installations)
Table 42 Europe: Market, By Country, 20162023 (USD Million)
Table 43 Europe: Market, By Country, 20162023 (No. of Installations)
Table 44 Europe:Market, By Architecture, 20162023 (USD Million)
Table 45 Europe: Closed MRI Systems Market, By Type, 20162023 (USD Million)
Table 46 Europe: Market, By Field Strength, 20162023 (USD Million)
Table 47 Europe: MRI Scanning Market, By Field Strength, 20162023 (No. of Installations)
Table 48 Europe: High-Field MRI Test Market, By Field Strength, 20162023 (USD Million)
Table 49 Europe: High-Field MRI Systems Market, By Field Strength, 20162023 (No. of Installations)
Table 50 Germany: Market , By Architecture, 20162023 (USD Million)
Table 51 Germany: Closed MRI Test Market, By Type, 20162023 (USD Million)
Table 52 Germany: MRI Application Market, By Field Strength, 20162023 (USD Million)
Table 53 Germany: Market, By Field Strength, 20162023 (No. of Installations)
Table 54 Germany: High-Field MRI Systems Market, By Field Strength, 20162023 (USD Million)
Table 55 Germany: High-Field MRI Systems Market, By Field Strength, 20162023 (No. of Installations)
Table 56 France: Market , By Architecture, 20162023 (USD Million)
Table 57 France: Closed MRI Test Market, By Type, 20162023 (USD Million)
Table 58 France: MRI Scanning Market, By Field Strength, 20162023 (USD Million)
Table 59 France: Market, By Field Strength, 20162023 (No. of Installations)
Table 60 France: High-Field MRI Systems Market, By Field Strength, 20162023 (USD Million)
Table 61 France: High-Field MRI Test Market, By Field Strength, 20162023 (No. of Installations)
Table 62 UK: MRI Application Market, By Architecture, 20162023 (USD Million)
Table 63 UK: Closed MRI Systems Market, By Type, 20162023 (USD Million)
Table 64 UK: Market, By Field Strength, 20162023 (USD Million)
Table 65 UK: Market, By Field Strength, 20162023 (No. of Installations)
Table 66 UK: High-Field MRI Test Market, By Field Strength, 20162023 (USD Million)
Table 67 UK: High-Field MRI Systems Market, By Field Strength, 20162023 (No. of Installations)
Table 68 Italy: Magnetic resonance imaging systems market , By Architecture, 20162023 (USD Million)
Table 69 Italy: Closed MRI Systems Market, By Type, 20162023 (USD Million)
Table 70 Italy: MRI Scanning Market, By Field Strength, 20162023 (USD Million)
Table 71 Italy: MRI Application Market, By Field Strength, 20162023 (No. of Installations)
Table 72 Italy: High-Field MRI Test Market, By Field Strength, 20162023 (USD Million)
Table 73 Italy: High-Field MRI Systems Market, By Field Strength, 20162023 (No. of Installations)
Table 74 Spain: Market, By Architecture, 20162023 (USD Million)
Table 75 Spain: Closed MRI Systems Market, By Type, 20162023 (USD Million)
Table 76 Spain: Market, By Field Strength, 20162023 (USD Million)
Table 77 Spain: Market , By Field Strength, 20162023 (No. of Installations)
Table 78 Spain: High-Field MRI Test Market, By Field Strength, 20162023 (USD Million)
Table 79 Spain: High-Field MRI Systems Market, By Field Strength, 20162023 (No. of Installations)
Table 80 RoE: MRI Application Market, By Architecture, 20162023 (USD Million)
Table 81 RoE: Closed MRI Test Market, By Type, 20162023 (USD Million)
Table 82 RoE: MRI Procedure Market, By Field Strength, 20162023 (USD Million)
Table 83 RoE: Market, By Field Strength, 20162023 (No. of Installations)
Table 84 RoE: High-Field MRI Procedure Market, By Field Strength, 20162023 (USD Million)
Table 85 RoE: High-Field MRI Systems Market, By Field Strength, 20162023 (No. of Installations)
Table 86 APAC: MRI Application Market, By Country, 20162023 (USD Million)
Table 87 APAC: Market, By Country, 20162023 (No. of Installations)
Table 88 APAC: Market, By Architecture, 20162023 (USD Million)
Table 89 APAC: Closed MRI Procedure Market, By Type, 20162023 (USD Million)
Table 90 APAC: Market, By Field Strength, 20162023 (USD Million)
Table 91 APAC: Market, By Field Strength, 20162023 (No. of Installations)
Table 92 APAC: High-Field MRI Systems Market, By Field Strength, 20162023 (USD Million)
Table 93 APAC: High-Field MRI Procedure Market, By Field Strength, 20162023 (No. of Installations)
Table 94 China: Market, By Architecture, 20162023 (USD Million)
Table 95 China: Closed MRI Systems Market, By Type, 20162023 (USD Million)
Table 96 China: MRI Application Market, By Field Strength, 20162023 (USD Million)
Table 97 China: Market, By Field Strength, 20162023 (No. of Installations)
Table 98 China: High-Field MRI Systems Market, By Field Strength, 20162023 (USD Million)
Table 99 China: High-Field MRI Procedure Market, By Field Strength, 20162023 (No. of Installations)
Table 100 Japan: Magnetic resonance imaging systems market Market, By Architecture, 20162023 (USD Million)
Table 101 Japan: Closed MRI Systems Market, By Type, 20162023 (USD Million)
Table 102 Japan: MRI Application Market, By Field Strength, 20162023 (USD Million)
Table 103 Japan: MRI Procedure Market, By Field Strength, 20162023 (No. of Installations)
Table 104 Japan: High-Field MRI Systems Market, By Field Strength, 20162023 (USD Million)
Table 105 Japan: High-Field MRI Procedure Market, By Field Strength, 20162023 (No. of Installations)
Table 106 India: Market, By Architecture, 20162023 (USD Million)
Table 107 India: Closed MRI Systems Market, By Type, 20162023 (USD Million)
Table 108 India: Market Market, By Field Strength, 20162023 (USD Million)
Table 109 India: Market, By Field Strength, 20162023 (No. of Installations)
Table 110 India: High-Field MRI Procedure Market, By Field Strength, 20162023 (USD Million)
Table 111 India: High-Field MRI Systems Market, By Field Strength, 20162023 (No. of Installations)
Table 112 RoAPAC: Market, By Architecture, 20162023 (USD Million)
Table 113 RoAPAC: Closed MRI Systems Market, By Type, 20162023 (USD Million)
Table 114 RoAPAC: Market, By Field Strength, 20162023 (USD Million)
Table 115 RoAPAC: MRI Procedure Market, By Field Strength, 20162023 (No. of Installations)
Table 116 RoAPAC: High-Field MRI Procedure Market, By Field Strength, 20162023 (USD Million)
Table 117 RoAPAC: High-Field MRI Systems Market, By Field Strength, 20162023 (No. of Installations)
Table 118 RoW: Magnetic resonance imaging systems market Market, By Country, 20162023 (USD Million)
Table 119 RoW: Market, By Country, 20162023 (No. of Installations)
Table 120 RoW: Market, By Architecture, 20162023 (USD Million)
Table 121 RoW: Closed MRI Procedure Market, By Type, 20162023 (USD Million)
Table 122 RoW: Market, By Field Strength, 20162023 (USD Million)
Table 123 RoW: Market, By Field Strength, 20162023 (No. of Installations)
Table 124 RoW: High-Field MRI Procedure Market, By Field Strength, 20162023 (USD Million)
Table 125 RoW: High-Field MRI Procedure Market, By Field Strength, 20162023 (No. of Installations)
Table 126 Brazil: Market, By Architecture, 20162023 (USD Million)
Table 127 Brazil: Closed MRI Procedure Market, By Type, 20162023 (USD Million)
Table 128 Brazil: MRI Procedure Market, By Field Strength, 20162023 (USD Million)
Table 129 Brazil: Market, By Field Strength, 20162023 (No. of Installations)
Table 130 Brazil: High-Field MRI Application Market, By Field Strength, 20162023 (USD Million)
Table 131 Brazil: High-Field MRI Systems Market, By Field Strength, 20162023 (No. of Installations)
Table 132 Other RoW Countries: Market, By Architecture, 20162023 (USD Million)
Table 133 Other RoW Countries: Closed Market, By Type, 20162023 (USD Million)
Table 134 Other RoW Countries: MRI Application Market, By Field Strength, 20162023 (USD Million)
Table 135 Other RoW Countries: Market, By Field Strength, 20162023 (No. of Installations)
Table 136 Other RoW Countries: High-Field Market, By Field Strength, 20162023 (USD Million)
Table 137 Other RoW Countries: High-Field Market, By Field Strength, 20162023 (No. of Installations)
Table 138 Product Launches and Approvals, January 2015March 2018
Table 139 Agreements, Partnerships, and Collaborations, January 2015March 2018
Table 140 Acquisitions, January 2015March 2018
Table 141 Expansions, January 2015 March 2018
List of Figures (33 Figures)
Figure 1 Research Design
Figure 2 Breakdown of Primary Interviews: By Company Type, Designation, and Region
Figure 3 Market Size Estimation Methodology: Bottom-Up Approach
Figure 4 Market Size Estimation Methodology: Top-Down Approach
Figure 5 Data Triangulation
Figure 6 Market Size, By Region (2018 vs 2023)
Figure 7 Market Volume (No. of New Installations), By Region (2018 vs 2023)
Figure 8 Market, By Field Strength (2018 vs 2023)
Figure 9 Market, By Architecture (2018 vs 2023)
Figure 10 Closed MRI Systems Market, By Type, 2018 vs 2023
Figure 11 Geographical Snapshot of the Market (2018-2023)
Figure 12 Discovery of New Helium Deposits to Drive Market Growth
Figure 13 China is Expected to Command the Largest Market Share in APAC Market, 2018
Figure 14 Developing Countries (China, India) are Expected to Grow at A Higher CAGR During the Forecast Period
Figure 15 Canada to Register Highest Growth During the Forecast Period
Figure 16 Open MRI and High-Field MRI to Play A Crucial Role in the Growth of MRI Industry
Figure 17 Market: Drivers, Restraints, Opportunities, and Challenges
Figure 18 Regulatory Bodies Governing MRI Equipment
Figure 19 MRI Application Market: Geographic Growth Opportunities
Figure 20 North America: Market Snapshot
Figure 21 Percentage of Population Aged 65 Years and Above: 2015 vs 2050
Figure 22 Italy: MRI Systems Per Million Population
Figure 23 RoE: Healthcare Expenditure as A Percentage of GDP (2014)
Figure 24 APAC: Market Snapshot
Figure 25 Companies Adopted Product Launches and Approvals as Their Key Growth Strategy Over the Last Three Years
Figure 26 Global Market Share, By Key Players, 2017
Figure 27 Hitachi Ltd.: Company Snapshot
Figure 28 Siemens Healthineers: Company Snapshot
Figure 29 Canon Inc.: Company Snapshot
Figure 30 GE Healthcare: Company Snapshot
Figure 31 Koninklijke Philips N.V.: Company Snapshot
Figure 32 Bruker: Company Snapshot
Figure 33 Fonar: Company Snapshot

 Generating Response ...


Growth opportunities and latent adjacency in Magnetic Resonance Imaging Systems Market