Night Vision Device Market by Device Type (Camera, Scope, Goggle), Technology, By Application (Military, Surveillance, Security, Hunting, Navigation, Hidden Object Detection, Paranormal Research, and Others) and by Geography - Global Forecast to 2020


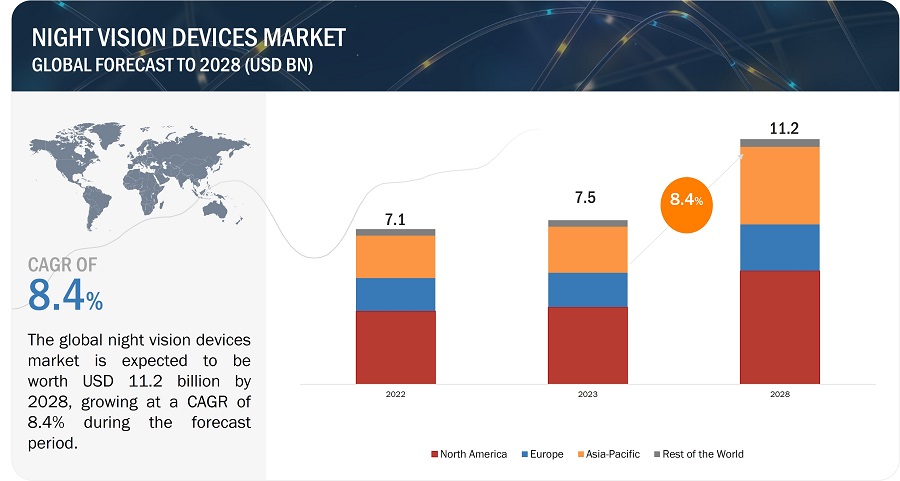
The night vision device market was valued at USD 5.07 Billion in 2015, and is expected to grow at a CAGR of 8.8% from 2015 to 2020, to reach USD 7.73 Billion by 2020. Night vision devices have been used from the time of World Wars, as they help in high speed imaging and have the ability to detect objects at a long distance. The report aims at estimating the market size and future growth potential of night vision device market across different segments such as device, technology, application and geography. The base year considered for the study is 2014, and the market size is forecast from 2015 to 2020. The increasing military expenditure, along with rising need for technologically advanced night vision devices is driving the growth of the market.
The research methodology used to estimate and forecast the night vision market begins by capturing data on key market player revenues through secondary research. The bottom-up procedure has been employed to arrive at the overall market size, by considering the revenue of key players in the market. After arriving at the overall market size, the total market has been split into several segments and sub-segments, which has been verified through primary research by conducting extensive interviews with key people such as CEOs, VPs, Directors and executives. This data triangulation and market breakdown procedures have been employed to complete the overall market engineering process and arrive at the exact statistics for segments and sub-segments. The breakdown of profiles is depicted in the below figure:
To know about the assumptions considered for the study, download the pdf brochure
This report provides the integrated ecosystem of the night vision device market which offers holistic view of current demand and vendor side market. The research study answers several significant questions, primarily which market segments to focus on in next two to five years to prioritize factors such as resource effort, and investment.
Key Target audience
- Night Vision Device Manufacturers and Suppliers
- Research and Development (R&D) Companies
- Business Research and Consulting Service Providers
- Research Organizations
- Academic Centers and Universities
- Associations and Industrial Bodies
- Electronics and Semiconductor Companies
- Technology Investors
Get online access to the report on the World's First Market Intelligence Cloud
Request Sample Scope of the Report

The submarkets of the Night Vision Device market are as follows:
By Device:
- Night vision camera
- Night vision scope
- Night vision goggle
By Technology:
- Thermal imaging
- Image intensifier
- Infrared illumination
By Application:
- Military
- Surveillance
- Security
- Hunting
- Navigation
- Hidden objects detection
- Paranormal research
- Others
By Geography:
- North America
- Europe
- Asia-Pacific
- South America
- Rest of World
Available Customizations
With the given market data, MarketsandMarkets offers customizations as per the companys specific needs. The following customization options are available for the report:
Product Analysis
- A detailed analysis of different products for various competitors in the night vision market would be carried out. The analysis will help devise strategies for the company.
Geographic Analysis
- Further breakdown of the North America night vision market
- Further breakdown of the Europe night vision market
- Further breakdown of the APAC night vision market
- Further breakdown of the Africa night vision market
- Further breakdown of the Middle East night vision market
- Further breakdown of the Latin America night vision market
Company Information
Detailed analysis and profiling of additional market players
The global night vision device market was valued at USD 5.07 Billion in 2015, and is expected to grow at a CAGR of 8.8% from 2015 to 2020, to reach USD 7.73 Billion by 2020. The night vision devices are used in various applications such as surveillance, military, security, hunting, navigation, hidden object detection, paranormal research and others.
The scope of this report covers the night vision device market by application, technology, device, and region. The surveillance sector is expected to grow at a high CAGR during the forecast period. The military segment recorded higher revenues in 2015, as compared to the surveillance segment throughout the forecast period.
The night vision camera of the global night vision device market is expected to grow at a high CAGR from 2015 to 2020. There has been continuous improvement and advancement in the night vision technology; the latest generation-3 night vision device uses a photocathode that comprises gallium arsenide which helps improve image resolution.
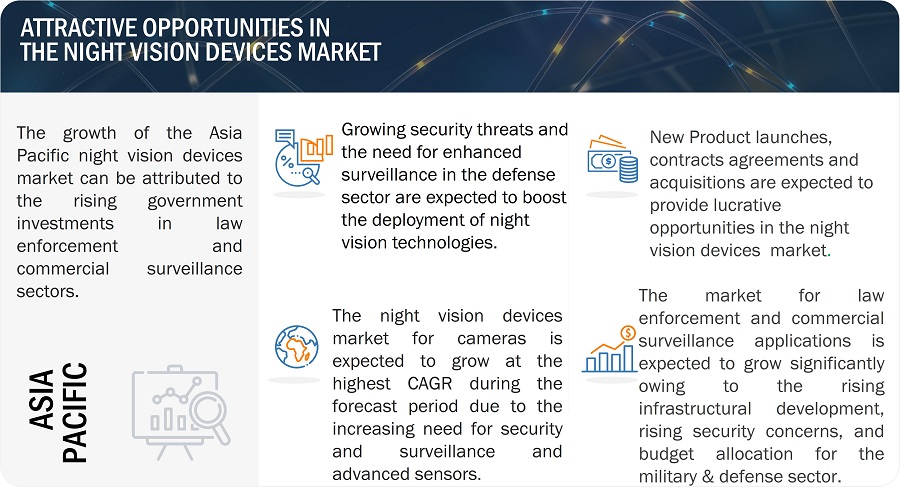
North America is expected to have the largest market share, and it comprises of countries, such as the U.S., Mexico, and Canada. The U.S. is a major driving factor for the market growth, considering the upgraded technology and high scale deployment of devices- night vision camera, night vision scope, and night vision goggle in various applications.
However, due to economic slowdown, most of the countries have to be cautious about the military funding. The defense budget cut may inhibit growth in the night vision devices market in the near future. Some of the major players in this market are Flir System (U.S.), Exelis Inc (U.S.), L3 communication (U.S.), American Technologies Network Corp. (U.S.), Elbit systems (Israel), Rockwell Collins Inc. (U.S.) and others. Some of the significant developments adopted by the market players are mergers, partnerships, collaborations and business expansion.
To speak to our analyst for a discussion on the above findings, click Speak to Analyst
Table of Contents
1 Introduction (Page No. - 15)
1.1 Objectives of the Study
1.2 Market Segmentation & Coverage
1.3 Stakeholders
2 Research Methodology (Page No. - 17)
2.1 Integrated Ecosystem of Night Vision Device Market
2.2 Arriving at the Global Market Size
2.2.1 Top-Down Approach
2.2.2 Bottom-Up Approach
2.2.3 Macroindicator-Based Approach
2.3 Assumptions
3 Executive Summary (Page No. - 25)
4 Market Overview (Page No. - 27)
4.1 Introduction
4.2 Market: Comparison With Parent Market
4.3 Market Drivers and Inhibitors
4.4 Key Market Dynamics
5 Night Vision Device Market, By Technology (Page No. - 35)
5.1 Introduction
5.2 Global Market, By Technology
5.3 Thermal Imaging Night Vision Device Market
5.3.1 Thermal Imaging Night Vision Device Market, By Geography
5.3.2 Thermal Imaging Night Vision Device Market, By Device Type
5.3.3 Thermal Imaging Night Vision Device Market, By Application
5.4 Image Intensifiers Night Vision Device Market
5.4.1 Image Intensifiers Night Vision Device Market, By Geography
5.4.2 Image Intensifiers Night Vision Device Market, By Device Type
5.4.3 Image Intensifiers Night Vision Device Market, By Application
5.5 Infrared Illumination Night Vision Device Market
5.5.1 Infrared Illumination Night Vision Device Market, By Geography
5.5.2 Infrared Illumination Night Vision Device Market, By Device Type
5.5.3 Infrared Illumination Night Vision Device Market, By Application
6 Night Vision Device Market, By Device Type (Page No. - 48)
6.1 Introduction
6.2 Night Vision Camera Market
6.2.1 Night Vision Camera Market, By Geography 2014-2020 (USD MN)
6.2.2 Night Vision Camera Market, By Technology, 2014-2020 (USD MN)
6.2.3 Night Vision Camera Market, By Application, 2014-2020 (USD MN)
6.3 Night Vision Scopes Market
6.3.1 Night Vision Scopes Market, By Geography, 2014-2020 (USD MN)
6.3.2 Night Vision Scopes Market, By Technology, 2014-2020 (USD MN)
6.3.3 Night Vision Scopes Market, By Application, 2014-2020 (USD MN)
6.4 Night Vision Goggles Market
6.4.1 Global Night Vision Goggles Market, By Geography, 2014-2020 (USD MN)
6.4.2 Night Vision Goggles Market, By Technology, 2014-2020 (USD MN)
6.4.3 Night Vision Goggles Market, By Application 2014-2020 (USD MN)
7 Night Vision Device Market, By Application (Page No. - 59)
7.1 Introduction
7.2 Night Vision Device Market in Military Application, By Geography, 2014-2020 (USD MN)
7.3 Market in Surveillance Application, By Geography, 2014-2020 (USD MN)
7.4 Market in Security Application, By Geography, 2014-2020 (USD MN)
7.5 Market in Hunting Application, By Geography, 2014-2020 (USD MN)
7.6 Market in Navigation Application, By Geography, 2014-2020 (USD MN)
7.7 Market in Hidden Object Detection Application, By Geography, 2014-2020 (USD MN)
7.8 Market in Paranormal Research Application, By Geography, 2014-2020 (USD MN)
8 Night Vision Device Market, By Geography (Page No. - 82)
8.1 Introduction
8.2 North America Night Vision Device Market
8.2.1 North America Market, By Technology
8.2.2 North America Market, By Application
8.3 APAC Night Vision Device Market
8.3.1 APAC Market, By Technology
8.3.2 APAC Market, By Application
8.4 Europe Night Vision Device Market
8.4.1 Europe Market, By Technology
8.4.2 Europe Market, By Application
8.5 Latin America Night Vision Device Market
8.5.1 Latin America Market, By Technology
8.5.2 Latin America Market, By Application
8.6 Africa Night Vision Device Market
8.6.1 Africa Market, By Technology
8.6.2 Africa Market, By Application
8.7 Middle East Night Vision Device Market
8.7.1 Middle East Market, By Technology
8.7.2 Middle East Market, By Application
9 Night Vision Device Market: Competitive Landscape (Page No. - 99)
9.1 Global Market: Company Market Share Analysis
9.2 Company Presence in Market, By Product
9.3 Mergers & Acquisitions
9.4 Joint Ventures
9.5 Contracts
10 Night Vision Device Market, By Company (Page No. - 103)
10.1 Flir Systems
10.1.1 Overview
10.1.2 Key Financials
10.1.3 Key Operations Data
10.1.4 Product and Service Offerings
10.1.5 Related Developments
10.1.6 MnM View
10.2 Exelis Inc.
10.2.1 Overview
10.2.2 Key Financials
10.2.3 Key Operations Data
10.2.4 Product and Service Offerings
10.2.5 Related Developments
10.2.6 MnM View
10.3 L3 Communication
10.3.1 Overview
10.3.2 Key Financials
10.3.3 Key Operations Data
10.3.4 Product and Service Offerings
10.3.5 Related Developments
10.3.6 MnM View
10.4 American Technologies Network Corp.
10.4.1 Overview
10.4.2 Key Financials
10.4.3 Product and Service Offerings
10.4.4 Related Developments
10.4.5 MnM View
10.5 Elbit Systems
10.5.1 Overview
10.5.2 Key Financials
10.5.3 Key Operations Data
10.5.4 Product and Service Offerings
10.5.5 Related Developments
10.5.6 MnM View
10.6 Rockwell Collins, Inc.
10.6.1 Overview
10.6.2 Key Financials
10.6.3 Key Operations Data
10.6.4 Product and Service Offerings
10.6.5 Related Developments
10.6.6 MnM View
10.7 BAE Systems
10.7.1 Overview
10.7.2 Key Financials
10.7.3 Key Operations Data
10.7.4 Product and Service Offerings
10.7.5 Related Developments
10.7.6 MnM View
10.8 Thales Group S.A
10.8.1 Overview
10.8.2 Key Operations Data
10.8.3 Key Financials
10.8.4 Product and Service Offerings
10.8.5 Recent Developments
10.8.6 MnM View
11 Appendix (Page No. - 122)
11.1 Customization Options
11.1.1 Product Analysis
11.1.2 Company Information
11.1.3 Low-Cost Sourcing Locations
11.1.4 Regulatory Framework
11.1.5 Impact Analysis
11.1.6 Historical Data and Trends
11.2 Related Reports
11.3 Introducing RT: Real Time Market Intelligence
11.3.1 RT Snapshots
List of Tables (81 Tables)
Table 1 Global Market Parent/Peer Market Size, 2014 (USD MN)
Table 2 Global Market: Macroindicator, By Geography, 2014 (USD MN)
Table 3 Market: Comparison With Parent Market, 20142020 (USD MN)
Table 4 Global Market: Drivers and Inhibitors
Table 5 Market, By Component, 2014-2020 (USD MN)
Table 6 Market, By Technology, 2014-2020 (USD MN)
Table 7 Market, By Device Type, 2014-2020 (USD MN)
Table 8 Market, By Geography, 2014-2020 (USD MN)
Table 9 Market, By Application, 2014-2020 (USD MN)
Table 10 Market, By Technology, 2014-2020 (USD MN)
Table 11 Thermal Imaging Night Vision Device Market, By Geography, 2014-2020 (USD MN)
Table 12 Thermal Imaging Night Vision Device Market, By Device Type, 2014-2020 (USD MN)
Table 13 Thermal Imaging Night Vision Device Market, By Application, 2014-2020 (USD MN)
Table 14 Image Intensifiers Night Vision Device Market, By Geography, 2014-2020 (USD MN)
Table 15 Image Intensifiers Night Vision Device Market, By Device Type, 2014-2020 (USD MN)
Table 16 Image Intensifiers Night Vision Device Market, By Application, 2014-2020 (USD MN)
Table 17 Infrared Illumination Night Vision Device Market, By Geography, 2014-2020 (USD MN)
Table 18 Infrared Illumination Night Vision Device Market, By Device Type, 2014-2020 (USD MN)
Table 19 Infrared Illumination Night Vision Device Market, By Application, 2014-2020 (USD MN)
Table 20 Market, By Device Type, 2014-2020 (USD MN)
Table 21 Night Vision Camera Market, By Geography, 2014-2020 (USD MN)
Table 22 Night Vision Camera Market, By Technology, 2014-2020 (USD MN)
Table 23 Night Vision Camera Market, By Application, 2014-2020 (USD MN)
Table 24 Night Vision Scopes Market, By Geography, 2014-2020 (USD MN)
Table 25 Night Vision Scopes Market, By Technology, 2014-2020 (USD MN)
Table 26 Night Vision Scopes Market, By Application, 2014-2020 (USD MN)
Table 27 Night Vision Goggles Market, By Geography, 2014-2020 (USD MN)
Table 28 Night Vision Goggles Market, By Technology, 2014-2020 (USD MN)
Table 29 Night Vision Goggles Market, By Application, 2014-2020 (USD MN)
Table 30 Market, By Application, 2014-2020 (USD MN)
Table 31 Market in Military Application, By Geography, 2014-2020 (USD MN)
Table 32 Market in Military Application, By Technology, 2014-2020 (USD MN)
Table 33 Market in Military Application, By Device Type, 2014-2020 (USD MN)
Table 34 Market in Surveillance Application, By Geography, 2014-2020 (USD MN)
Table 35 Market in Surveillance Application, By Technology, 2014-2020 (USD MN)
Table 36 Market in Surveillance Application, By Device Type, 2014-2020 (USD MN)
Table 37 Market in Security Application, By Geography, 2014-2020 (USD MN)
Table 38 Market in Security Application, By Technology, 2014-2020 (USD MN)
Table 39 Market in Security Application, By Device Type, 2014-2020 (USD MN)
Table 40 Market in Hunting Application, By Geography, 2014-2020 (USD MN)
Table 41 Market in Hunting Application, By Technology, 2014-2020 (USD MN)
Table 42 Night Vision Device in Hunting Application, By Device Type, 2014-2020 (USD MN)
Table 43 Market in Navigation Application, By Geography, 2014-2020 (USD MN)
Table 44 Market in Navigation Application, By Technology, 2014-2020 (USD MN)
Table 45 Market in Navigation Application, By Device Type, 2014-2020 (USD MN)
Table 46 Market in Hidden Object Detection Application, By Geography, 2014-2020 (USD MN)
Table 47 Market in Hidden Object Detection Application, By Technology, 2014-2020 (USD MN)
Table 48 Market in Hidden Object Detection Application, By Device Type, 2014-2020 (USD MN)
Table 49 Market in Paranormal Research Application, By Geography, 2014-2020 (USD MN)
Table 50 Market in Paranormal Research Application, By Technology, 2014-2020 (USD MN)
Table 51 Market in Paranormal Research Application, By Device Type, 2014-2020 (USD MN)
Table 52 Market, By Geography, 2014-2020 (USD MN)
Table 53 North America Night Vision Device Market, By Technology, 2014-2020 (USD MN)
Table 54 North America Market, By Application, 2014-2020 (USD MN)
Table 55 APAC Market, By Technology, 2014-2020 (USD MN)
Table 56 APAC Market, By Application, 2014-2020 (USD MN)
Table 57 Europe Market, By Technology, 2014-2020 (USD MN)
Table 58 Europe Market, By Application, 2014-2020 (USD MN)
Table 59 Latin America Market, By Technology, 2014-2020 (USD MN)
Table 60 Latin America Market, By Application, 2014-2020 (USD MN)
Table 61 Africa Market, By Technology, 2014-2020 (USD MN)
Table 62 Africa Market, By Application, 2014-2020 (USD MN)
Table 63 Middle East Night Vision Device Market, By Technology, 2014-2020 (USD MN)
Table 64 Middle East Market, By Application, 2014-2020 (USD MN)
Table 65 Market: Company Market Share Analysis, 2014
Table 66 Market: Mergers & Acquisitions
Table 67 Market: Joint Ventures
Table 68 Market: Contracts
Table 69 Flir Systems Inc.: Key Financials, 2010-2014 (USD MN)
Table 70 Flir Systems Inc.: Key Operations Data, 2010-2014 (USD MN)
Table 71 Exelis Inc.: Key Financials, 2010-2014 (USD MN)
Table 72 Exelis Inc.: Key Operations Data, 2010-2014 (USD MN)
Table 73 L-3 Communication: Key Financials, 2010-2014 (USD MN)
Table 74 Elbit Systems: Key Financials, 2010-2014 (USD MN)
Table 75 Elbit Systems: Key Operations Data, 2010-2014 (USD MN)
Table 76 Rockwell Collins, Inc.: Key Financials, 2010 - 2014 (USD MN)
Table 77 Rockwell Collins, Inc.: Key Operations Data, 2010 - 2014 (USD MN)
Table 78 BAE Systems: Key Financials, 2010 - 2014 (USD MN)
Table 79 BAE Systems: Key Operations Data, 2010 - 2014 (USD MN)
Table 80 Thales Group S.A.: Key Operations Data, 2009 - 2013 (USD MN)
Table 81 Thales Group SA.: Key Financials, 2009 - 2013 (USD MN)
List of Figures (85 Figures)
Figure 1 Global Market: Segmentation & Coverage
Figure 2 Global Market: Integrated Ecosystem
Figure 3 Research Methodology
Figure 4 Top-Down Approach
Figure 5 Bottom-Up Approach
Figure 6 Macroindicator-Based Approach
Figure 7 Global Market: Snapshot, 2015
Figure 8 Market: Growth Aspects
Figure 9 Market: Comparison With Parent Market, 2014-2020 (USD MN)
Figure 10 Global Market, By Component, 2015 vs 2020 (USD MN)
Figure 11 Market, By Technology, 2015 vs 2020 (USD MN)
Figure 12 Market, By Device Type, 2015 vs 2020 (USD MN)
Figure 13 Market, By Geography, 2015 vs 2020 (USD MN)
Figure 14 Market, By Application, 2015 vs 2020 (USD MN)
Figure 15 Market, By Technology, 2015 & 2020 (USD MN)
Figure 16 Thermal Imaging Night Vision Device Market, By Geography, 2015 & 2020 (USD MN)
Figure 17 Thermal Imaging Night Vision Device Market, By Device Type, 2014-2020 (USD MN)
Figure 18 Thermal Imaging Night Vision Device Market, By Application, 2014-2020 (USD MN)
Figure 19 Image Intensifiers Night Vision Device Market, By Geography, 2015 & 2020 (USD MN)
Figure 20 Image Intensifiers Night Vision Device Market, By Device Type, 2014-2020 (USD MN)
Figure 21 Image Intensifiers Night Vision Device Market, By Application, 2014-2020 (USD MN)
Figure 22 Infrared Illumination Night Vision Device Market, By Geography, 2015 & 2020 (USD MN)
Figure 23 Infrared Illumination Night Vision Device Market, By Device Type, 2014-2020 (USD MN)
Figure 24 Infrared Illumination Night Vision Device Market, By Application, 2014-2020 (USD MN)
Figure 25 Market, By Device Type, 2015 & 2020 (USD MN)
Figure 26 Night Vision Camera Market, By Geography, 2015 & 2020 (USD MN)
Figure 27 Night Vision Camera Market, By Technology, 2014-2020 (USD MN)
Figure 28 Night Vision Camera Market, By Application, 2014-2020 (USD MN)
Figure 29 Night Vision Scopes Market, By Geography, 2015 & 2020 (USD MN)
Figure 30 Night Vision Scopes Market, By Technology, 2014-2020, (USD MN)
Figure 31 Market in Scopes, By Application, 2014-2020 (USD MN)
Figure 32 Night Vision Goggles Market, By Geography, 2015 & 2020 (USD MN)
Figure 33 Night Vision Goggles Market, By Technology, 2014-2020 (USD MN)
Figure 34 Night Vision Goggles Market, By Application, 2014-2020 (USD MN)
Figure 35 Market, By Application, 2015 & 2020 (USD MN)
Figure 36 Market in Military Application, By Geography, 2015 & 2020 (USD MN)
Figure 37 Market in Military Application, By Technology, 2014-2020 (USD MN)
Figure 38 Market in Military Application, By Device Type, 2014-2020 (USD MN)
Figure 39 Market in Surveillance Application, By Geography, 2015 & 2020 (USD MN)
Figure 40 Market in Surveillance Application, By Technology, 2014-2020 (USD MN)
Figure 41 Market in Surveillance Application, By Device Type, 2014-2020 (USD MN)
Figure 42 Market in Security Application, By Geography, 2015 & 2020 (USD MN)
Figure 43 Market in Security Application, By Technology, 2014-2020 (USD MN)
Figure 44 Market in Security Application, By Device Type, 2014-2020 (USD MN)
Figure 45 Market in Hunting Application, By Geography, 2015 & 2020 (USD MN)
Figure 46 Market in Hunting Application, By Technology, 2014-2020 (USD MN)
Figure 47 Market in Hunting Application, By Device Type, 2014-2020 (USD MN)
Figure 48 Market in Navigation Application, By Geography, 2015 & 2020 (USD MN)
Figure 49 Market in Navigation Application, By Technology, 2014-2020 (USD MN)
Figure 50 Market in Navigation Application, By Device Type, 2014-2020 (USD MN)
Figure 51 Market in Hidden Object Detection Application, By Geography, 2015 & 2020 (USD MN)
Figure 52 Market in Hidden Object Detection Application, By Technology, 2014-2020 (USD MN)
Figure 53 Market in Hidden Object Detection Application, By Device Type, 2014-2020 (USD MN)
Figure 54 Market in Paranormal Research Application, By Geography, 2015 & 2020 (USD MN)
Figure 55 Market in Paranormal Research Application, By Technology, 2014-2020 (USD MN)
Figure 56 Market in Paranormal Research Application, By Device Type, 2014-2020 (USD MN)
Figure 57 Market: Growth Analysis, By Geography, 2015 & 2020 (USD MN)
Figure 58 North America Market Overview, 2015 vs 2020 (USD MN)
Figure 59 North America Market, By Technology, 2015 & 2020 (USD MN)
Figure 60 North America Market, By Application, 2015 & 2020 (USD MN)
Figure 61 APAC Market Overview, 2015 vs 2020 (USD MN)
Figure 62 APAC Market, By Technology, 2015 & 2020 (USD MN)
Figure 63 APAC Market, By Application, 2015 & 2020 (USD MN)
Figure 64 Europe Market Overview, 2015 vs 2020 (USD MN)
Figure 65 Europe Market, By Technology, 2015 & 2020 (USD MN)
Figure 66 Europe Market, By Application, 2015 & 2020 (USD MN)
Figure 67 Latin America Vision Device Market Overview, 2015 vs 2020 (USD MN)
Figure 68 Latin America Market, By Technology, 2015 & 2020 (USD MN)
Figure 69 Latin America Market, By Application, 2015 & 2020 (USD MN)
Figure 70 Africa Market Overview, 2015 vs 2020 (USD MN)
Figure 71 Africa Market, By Technology, 2015 & 2020 (USD MN)
Figure 72 Africa Market, By Application, 2015 & 2020 (USD MN)
Figure 73 Middle East Market Overview, 2015 vs 2020 (USD MN)
Figure 74 Middle East Market, By Technology, 2015 & 2020 (USD MN)
Figure 75 Middle East Market, By Application, 2015 & 2020 (USD MN)
Figure 76 Market: Company Market Share Analysis, 2014 (%)
Figure 77 Night Vision Device: Company Product Coverage , 2014
Figure 78 Flir Systems Inc.: Revenue Mix, 2014 (%)
Figure 79 Exelis Inc.: Revenue Mix, 2014 (%)
Figure 80 L-3 Communication: Revenue Mix, 2014 (%)
Figure 81 L-3 Communication: Key Operations Data, 2010-2014 (USD MN)
Figure 82 Elbit Systems Inc.: Revenue Mix, 2014 (%)
Figure 83 Rockwell Collins, Inc.: Revenue Mix, 2014 (%)
Figure 84 BAE Systems: Revenue Mix, 2014 (%)
Figure 85 Thales Group S.A., Revenue Mix, 2013 (%)


Growth opportunities and latent adjacency in Night Vision Device Market