Observability Tools and Platforms Market by Component (Solution, and Services), Deployment type (Public cloud, and Private cloud), Vertical, and Region (North America, Europe, Asia Pacific, Middle East and Africa, Latin America) - Global Forecast to 2028
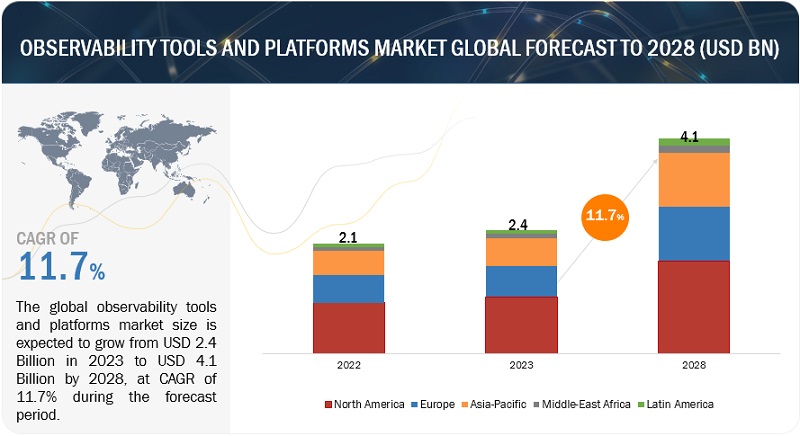
[210 Pages Report] The observability tools and platforms market size is expected to grow from USD 2.4 billion in 2023 to USD 4.1 billion by 2028, at a Compound Annual Growth Rate (CAGR) of 11.7% during the forecast period. The impact of the recession (before and after recession) on the market is covered throughout the report. Our modern-day lives are overfilled and loaded with new latest digital developments. The growth of remote-access strategies, such as SASE architecture (Secure Access Service Edge) that combines security and optimized network performance, driving a need for independent, unified observability that preserves great user experience regardless of location drives the observability tools and platforms market.
To know about the assumptions considered for the study, Request for Free Sample Report
To know about the assumptions considered for the study, download the pdf brochure
Recession Impact on the global observability tools and platforms market
With the recession threat looming over the US, chief information officers are reexamining their budgets to save expenditures. According to the Morgan Stanley analysis, cloud computing, security software, and digital transformation would remain top objectives for CIOs in such a situation. The impact of the recession on the observability tools and platforms market in North America is likely to be severe as the US and Canadian economies are expected to dip in 2023 compared to 2022. A recession might affect Europe’s infrastructure markets, which are already hampered by transportation issues and a shortage of components. Increasing interest rates will force companies to reduce bank loans, allowing slow demand for infrastructure. According to the South China Morning Post, China faces external headwinds ranging from debt shocks in the developing world to monetary policy spillovers from the United States. In contrast to several countries worldwide, Saudi Arabia’s economy is anticipated to grow this year quickly. The country’s gross domestic product is predicted to grow by 7.6%, with inflation at 2.8% in 2022. Middle Eastern economies have not been as hard hit by the crisis because they are not as integrated into the global economy and have fewer ties to international financial institutions. However, they will probably experience side effects like higher unemployment and further decline in living standards due to reduced capital flows.
Observability Tools and Platforms Market Dynamics
Drivers: Growing adoption of hybrid cloud and multi-cloud strategies across enterprises from different industry verticals
With the emergence of several cloud service providers, the market has become highly competitive, thereby offering end users numerous options to choose from. Enterprises need to ensure they have the flexibility to port applications between different providers. End users opt for cloud offerings from different sources to avoid vendor lock-in. For instance, enterprises adopt public cloud services from vendors, such as Amazon, Microsoft, and Google, to store trivial data, while private cloud or on-premises systems are preferred for storing confidential data. Thus, observability tools and platforms simplify the management of a multi-cloud and hybrid environment without compromising control over critical resources and tackles vendor lock-in.
Restraints: Difficulties involved in application portability
Observability tools and platforms vendors manage and regulate automation along with cloud operations according to the desired alignment across different cloud environments. This enables enterprises to govern and manage different cloud services efficiently and save time and money on planning and provisioning. However, the ability to provision and de-provision public cloud services does not provide application portability, which could be defined as the ability of programs to run on different cloud environments without being installed. Cloud vendors may face limitations while transferring workloads from one cloud ecosystem to another. As a result, workloads get locked into a single cloud provider on which it is built. Hence, moving workloads or applications from one environment to the other while maintaining optimum performance and cost-efficiency become major restraints for cloud vendors.
Opportunities: Emergence of hybrid cloud infrastructure
Technological advancements are expected to raise the observability tools and platforms market growth opportunities. The launch of a hybrid cloud infrastructure will provide exceptional benefits to the market. The adoption rate of the hybrid cloud platform will be immense during the forecast period. The low initial cost is one of the crucial aspects that increase the hybrid cloud adoption rate. SMEs are expected to have demand for hybrid cloud infrastructure. The flexibility, scalability, efficiency, and high-end features will attract a wider customer base. The setup and maintenance costs are lower for hybrid cloud management. The hybrid cloud comes with workload management. The security standards are high in the new-age cloud infrastructure. DevOps integration is one of the featured developments in a hybrid infrastructure. With high growth opportunities, the profitability of the market will be massive during the forecast period. More than the launch, the adoption of cloud management will be advantageous to overall market growth. Large enterprises, IT companies, healthcare, and retail are the key end users expected to adopt hybrid cloud platforms.
Challenges: Complexity in network design brought on by cloud and security concerns
High-security issues and distributed denial of service attacks are the major challenges for cloud management platforms. The lack of visibility pushes public security cloud and can lead to unauthorized access to data, improper handling, and duplication of data leading to the deletion of confidential data from infrastructure. In addition to these, the designing of networks from on-premises to the cloud needs high investment, which is one of the major challenges for small and medium-sized enterprises that have small budgets. Complexity in designing the cloud platform hinders the growth of the observability tools and platforms market.
Market Ecosystem
Based on component, services segment to hold the higher CAGR in the observability tools and platforms market during the forecast period
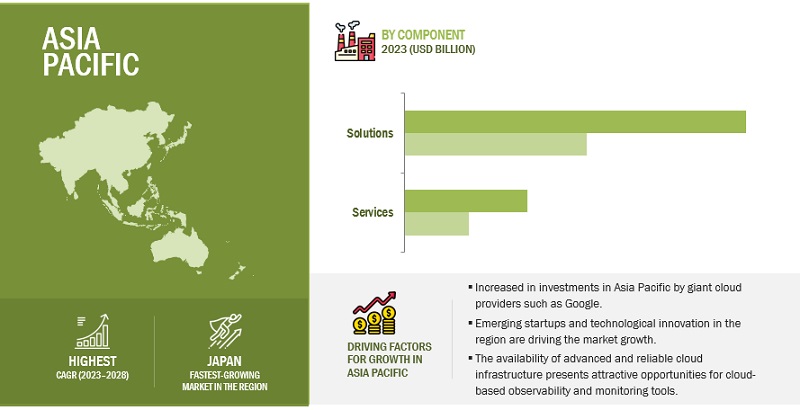
The major driver for the growing Observability services market is considered to be an immensely growing user-centric and infrastructure-centric approach for managing IT performance and organizations’ interest in monitoring IT services for mobile users. The services constitute an integral part in deploying the software in the company’s infrastructure, imparting training, and handling and maintaining software and solutions. Companies offering these services encompass consultants, software experts, and dedicated project management teams specializing in designing and delivering critical-decision support software, tools, and services.
Based on deployment type, public cloud segment to hold the larger share in the observability tools and platforms market during the forecast period
Performance monitoring of cloud, cloud-based services and solutions, and testing tools assist organizations in gaining visibility into their cloud environments by assessing performance using specific metrics and techniques. Efficient cloud performance monitoring is critical for ensuring business continuity and providing access to cloud services to all relevant parties. This holds true for basic public cloud usage and complex hybrid cloud and multi-cloud architectures. Enterprises use a public set of resources to deliver standardized, highly automated offerings. A service provider owns compute resources, storage, and networking capabilities, which are offered on demand with limited SLAs for tenancy, isolation, and performance. Organizations can gain visibility into the performance and stability of their cloud-based infrastructure, services, applications, and connectivity by using public cloud monitoring. Cloud monitoring tools collect data from hybrid and multi-cloud deployments and report it to network teams through alerts and reports.
Based on vertical, BFSI industry holds the largest market share in the observability tools and platforms market during the forecast period
In today's fast-paced world, where technology drives business operations, having a mission-critical infrastructure having the ability to manage voluminous transactions is mandatory. With regulatory requirements such as outages being reported to SEBI (Securities and Exchange Board of India) within half an hour and strict SLAs (Service Level Agreements) in place, implementing and embedding agility and observability into processes and infrastructure is an integral part and an inevitable necessity. Financial services are largely banking on data observability. For instance, Walmart’s PhonePe, a leading P2P (peer-to-peer) payments company, employed Acceldata’s Data Observability platform to monitor their HBase clusters and detect issues that could potentially arise in near future owing to hardware failure or poor table designs. This has helped the payments company with more than 350 million active subscribers to execute over 2 billion successful transactions only in a month’s time. Data Observability provides an assurance cover to the data pipeline by assessing the data quality and alerting businesses in the case of a potential data downtime(s). It is noticed that at times, data can be incomplete, inaccurate, erroneous or outdated. And data fire drills, an entirely manual process, can be cumbersome and costly. Data Observability solution helps enterprises in the BFSI vertical to scale data and analytics platforms by identifying performance and operational bottlenecks (fixing it), cost reduction and resource overruns by providing operational visibility, guardrails, and proactive timely alerts, and maximizing data quality while minimizing data outages by monitoring data reliability across frequent transformations.
North America to hold the largest market share in the observability tools and platforms market recording the third highest CAGR during the forecast period
The observability tools and platforms market in North America has been studied for the US and Canada. The adoption of observability tools and platforms solutions is expected to be the highest in North America compared to other regions. North America, being technologically advanced and developed, is the leading market in terms of developing cutting-edge technologies used in monitoring and tracking devices. Further, the rising expenditure of companies and individuals on digital solutions and advanced technologies boosts market growth. The significant adoption of technologies over the years has fueled the adoption of multi-cloud and hybrid cloud environments across the region. North America is a mature market owing to the presence of numerous players offering observability tools and platforms solutions and services. Moreover, enterprises are increasing their budgets to accommodate observability platforms solutions, which is favoring the growth of the market in the region.
Key market players
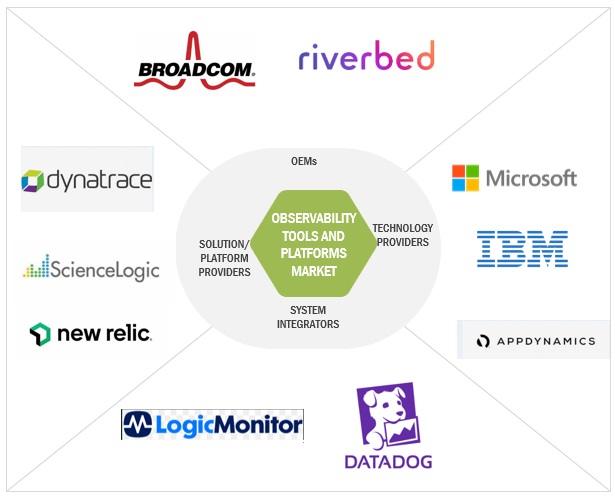
The observability tools and platforms market is dominated both by established companies as well as startups such as Dynatrace (US), ScienceLogic (US), LogicMonitor (US), Auvik (Canada), New Relic (US), GitLab (US), AppDynamics (US), SolarWinds (US), Splunk (US), Datadog (US), Sumo Logic (US), Monte Carlo (US), Acceldata (US), IBM (US), StackState (US), Nexthink (Switzerland), Riverbed (US), Broadcom (US), Lightstep (US), Microsoft (US), Atatus (India). These vendors have a large customer base and strong geographic footprint along with organized distribution channels, and incorporate both organic and inorganic growth strategies including product launches, deals, business expansions, which boosts them in revenue generation.
The study includes an in-depth competitive analysis of these key players in the observability tools and platforms market with their company profiles, recent developments, and key market strategies.
Recent Developments
- In May 2023, Dynatrace collaborated with Red Hat, and with this deal, customers using Red Hat Ansible Automation Platform have the capability to integrate AI-powered insights and action from Dynatrace with Event-Driven Ansible to automate a broader range of DevSecOps use cases, including closed-loop issue and security remediation, application healing, and incident response. This supports platform engineering, DevOps, and security teams enhance and mature their automation practices in order to deliver flawless and secure digital experiences for their customers.
- In May 2023, New Relic launched Grok which is New Relic’s AI observability assistant. With Grok, engineers can sift through data more easily and treat well through their unified telemetry data without having to write complex queries.
- In February 2023, Dynatrace launched AppEngine, a new Dynatrace® platform technology that empowers customers and partners with an easy-to-use, low-code approach to create custom, compliant, and intelligent data-driven app(s) for their IT services/solutions, development, security, and business teams. These custom apps [Smartscape® Health View, Site Reliability Guardian, Carbon Impact] can address boundless BizDevSecOps use cases, while unlocking the wealth of insights available in the massive amount(s) of data generated by modern cloud ecosystems.
- In October 2022, ScienceLogic acquired ML analytics firm Zebrium to automatically detect the root cause of complex, modern (containerized, cloud-native) application problems. This deal drastically reduces the time taken to identify, diagnose and resolve business-service impacting issues, lowering IT costs, and delivering superior customer and employee experiences.
- In October 200, Auvik acquired Saaslio and Boardgent. With this deal, Auvik will provide a unique toolset to enable IT professionals gain more control, visibility, and troubleshooting capabilities over the new last mile of the office network. It is believed that the combination of the firms’ deep expertise in network monitoring and management, experienced workforces, proprietary technologies, and innovative solutions allow the unified company in delivering the ultimate network monitoring platform.
Frequently Asked Questions (FAQ):
What is the projected market value of the observability tools and platforms market?
The global observability tools and platforms market is expected to grow from USD 2.4 billion in 2023 through USD 4.1 billion by 2028, at a Compound Annual Growth Rate (CAGR) of 11.7% during the forecast period.
Which region has the highest CAGR in the observability tools and platforms market?
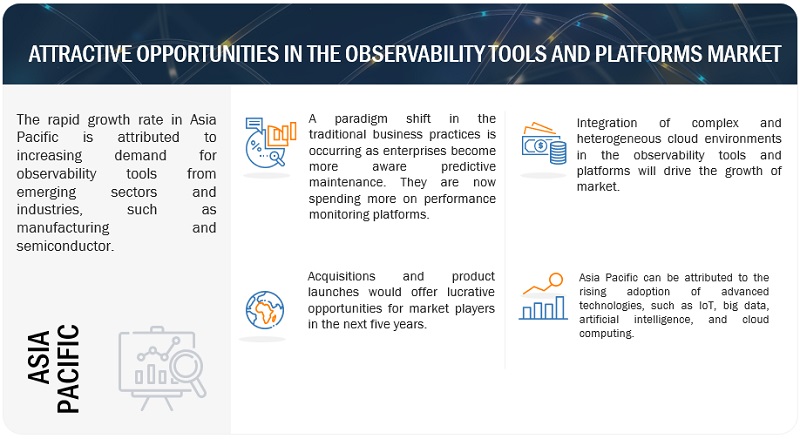
The Asia Pacific region has the highest CAGR in the observability tools and platforms market.
Which component holds the larger market share in the aforesaid market during the forecast period?
Solution segment is forecasted to hold the larger market share in the observability tools and platforms market.
Which are the major vendors in the observability tools and platforms market?
Dynatrace, Sumo Logic, LogicMonitor, Splunk, New Relic, are a few major vendors in observability tools and platforms market.
What are some of the drivers in the observability tools and platforms market?
Exponentially increasing data volume and network traffic
Growing adoption of cloud technology, along with advanced ones such as AI, ML, real-time analytics across industries
To speak to our analyst for a discussion on the above findings, click Speak to Analyst
The study involved 4 major activities to estimate the current market size of the observability tools and platforms market. Exhaustive secondary research was done to collect information on the market, the peer market, and the parent market. The next step was to validate these findings, assumptions, and sizing with industry experts across the value chain through primary research. Both top-down and bottom-up approaches were employed to estimate the complete market size. After that, the market breakup and data triangulation procedures were used to estimate the market size of the segments and subsegments.
Secondary Research
In the secondary research process, various secondary sources were referred to for identifying and collecting information for this study. The secondary sources included annual reports, SEC filings, press releases, and investor presentations of companies; whitepapers; certified publications; and articles from recognized associations, such as data center knowledge and government publishing sources. The research study involved the use of extensive secondary sources, directories, and databases, such as D&B Hoovers, DiscoverOrg, Factiva, Bloomberg BusinessWeek, Statista.com, Cloud Computing Association, OpenFog Consortium, SpiceCSM, National Association of call centers (ACCA), MENA Cloud Alliance, Association of Customer Contact Professionals (ACCP), International Trade Administration (ITA), Telecommunications Industry Association, United Nations Economic and Social Commission for Asia and the Pacific (ESCAP), Economic Commission for Latin America (ECLA), Arab Information and Communication Technology Organization (AICTO)) to identify and collect information useful for this technical, market-oriented, and commercial study of the observability tools and platforms market. Secondary research was mainly used to obtain key information about the industry’s value chain, the total pool of key players, market classification and segmentation as per the industry trends to the bottom-most level, regional markets, and key developments from both market and technology-oriented perspectives.
Primary Research
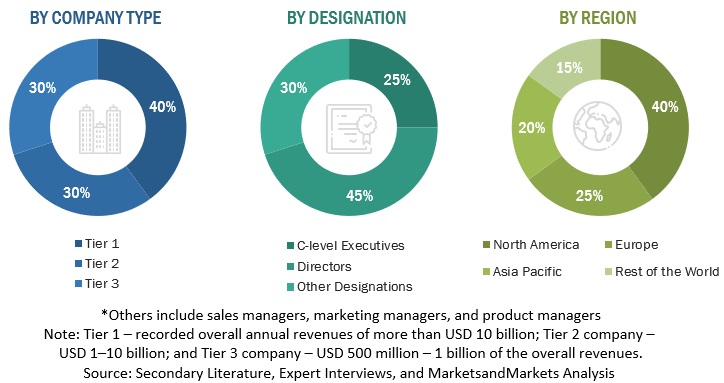
In the primary research process, various primary sources from both the supply and demand sides were interviewed to obtain qualitative and quantitative information for this report. Primary sources from the supply-side included industry experts, such as Chief Executive Officers (CEOs), CXOs, Vice Presidents (VPs), marketing directors, technology and innovation directors, and related key executives from various key companies and organizations providing observability tools and platforms software. The primary sources from the demand side included the end-users of event management software solutions, which included Chief Information Officers (CIOs), IT technicians and technologists, and IT managers at public and investor-owned utilities.
The following figure depicts the breakup of the primary profiles:
To know about the assumptions considered for the study, download the pdf brochure
Market Size Estimation
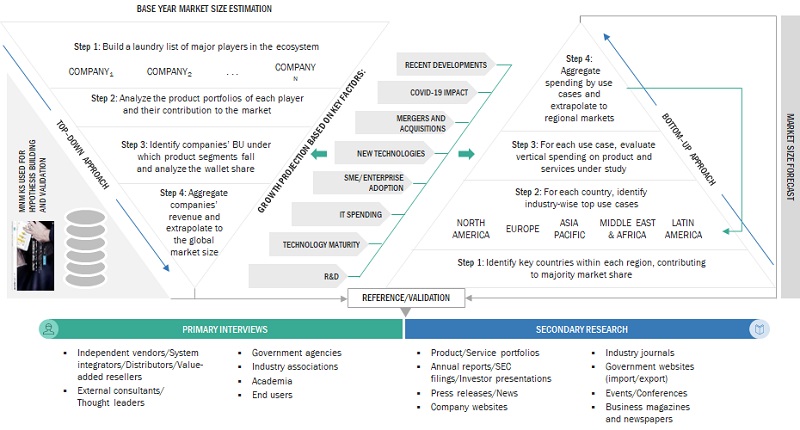
The top-down and bottom-up approaches were used to estimate and validate the size of the observability tools and platforms market and various other dependent sub-markets in the overall market.
In the top-down approach, an exhaustive list of all vendors offering observability tools and platforms solutions was prepared. The revenue contribution of all vendors in the market was estimated through annual reports, press releases, SEC filings, funding, investor presentations, paid databases, and primary interviews. Each vendor was evaluated based on its product/solution offerings, hardware, software, services, game genres, and regional presence. The aggregate of all companies’ revenue was extrapolated to reach the overall market size. Each subsegment was studied and analyzed for its market size and regional penetration. The markets were triangulated through both primary and secondary research. The primary procedure included extensive interviews for key insights from industry leaders, such as CEOs (Chief Executive Officer), VPs (Vice President), directors, and marketing executives. These market numbers were further triangulated with the existing MarketsandMarkets’ repository for validation.
In the bottom-up approach, the adoption trend of observability tools and platforms solutions among different end users in key countries with respect to the regions that contribute to most of the market share was identified. For cross-validation, the adoption trend of solutions, along with different use cases, with respect to their business segments, has been identified and extrapolated. Weightage has been given to the use cases identified in the different application areas for the calculation.
In the bottom-up approach, the adoption trend of observability tools and platforms solutions between the major two applications in key countries, with respect to regions that contribute to most of the market share, has been identified. For cross-validation, the adoption trend of observability tools and platforms, along with different use cases with respect to their business segments, has been identified and generalized. Weightage has been given to the use cases identified in different solution areas for calculation. An exhaustive list of all vendors offering solutions and services in the observability tools and platforms market has been prepared. The revenue contribution of all vendors in the market has been estimated through annual reports, press releases, funding, investor presentations, paid databases, and primary interviews. Vendors with observability tools and platforms offerings have been considered to evaluate the market size. Each vendor has been evaluated based on its solution and service offerings across verticals. The aggregate of all companies' revenue has been extrapolated to reach the overall market size. Each sub-segment has been studied and analyzed for its market size and regional penetration. Based on these numbers, primary and secondary sources have determined the region split.
All possible parameters affecting the market covered in this research study have been accounted for, viewed in extensive detail, verified through primary research, and analyzed to get the final quantitative and qualitative data. This data has been consolidated and added with detailed inputs and analysis from MarketsandMarkets.
Both top-down and bottom-up approaches were used to estimate and validate the total size of the observability tools and platforms market. They were also used extensively to estimate the size of various subsegments in the market. The research methodology used to estimate the market size includes the following:
- The key players in the industry and markets have been identified through extensive secondary research.
- The industry’s supply chain and market size, in terms of value, have been determined through primary and secondary research processes.
- All percentage shares, splits, and breakdowns have been determined using secondary sources and verified through primary sources.
observability tools and platforms market: Top-down and bottom-up approaches
To know about the assumptions considered for the study, Request for Free Sample Report
Data Triangulation
After arriving at the overall market size—using the market size estimation processes as explained above—the market was split into several segments and subsegments. To complete the overall market engineering process and arrive at the exact statistics of each market segment and subsegment, the data triangulation and market breakup procedures were employed, wherever applicable. The data was triangulated by studying several factors and trends from both, the demand and supply sides, in the observability tools and platforms market.
Market definition
Observability tools and platforms are software solutions designed to help monitor and understand complex systems, applications, and infrastructure. These tools provide insights into the performance, health, and behavior of various components within a system, enabling teams to detect and resolve issues quickly. Some of the common types of observability tools and platforms include logging platforms, metric platforms, tracing tools, application performance monitoring, incident management platforms, and distributed tracing platforms.
Key stakeholders of the market include:
- Cloud Service Providers (CSPs)
- Communication Service Providers (CSPs)
- Networking companies
- Third-party providers
- Consultants/Consultancies/Advisory firms
- Support and maintenance service providers
- Telecom service providers
- Information Technology (IT) infrastructure providers
- System Integrators (SIs)
- Support service providers
- Governments and standardization bodies
- Datacenter providers
- Regional associations
- Independent software vendors
- Value-added resellers and distributors
Report Objectives
- To describe and forecast the observability tools and platforms market based on components (solution, and services), deployment type, verticals, and regions.
- To forecast the market size of five main regions: North America, Europe, Asia Pacific, Middle East and Africa, and Latin America
- To analyze subsegments with respect to individual growth trends, prospects, projections, and contributions to the total market
- To provide detailed information about major factors (drivers, restraints, opportunities, and challenges) influencing the growth of the market
- To analyze opportunities in the market for stakeholders and provide details of the competitive landscape for major players
- To comprehensively analyze the core competencies* of key players in the market
- To track and analyze the competitive developments, such as product/solution launches and enhancements; business expansions; acquisitions; and partnerships, contracts, and collaborations, in the market.
Available Customizations
With the given market data, MarketsandMarkets offers customizations as per the company’s specific needs and on best effort basis for profiling of additional market players.


Growth opportunities and latent adjacency in Observability Tools and Platforms Market