PXI SMU Market by Channel (1, 2, 4, >4) Application (Semiconductor, Sensor, LED, Green Energy Product, Nanomaterial, Organic & Printed Electronics), End-User (Aerospace, Defense & Government Service, IT & Telecommunication), Region - Global forecast to 2024


PXI SMU Market
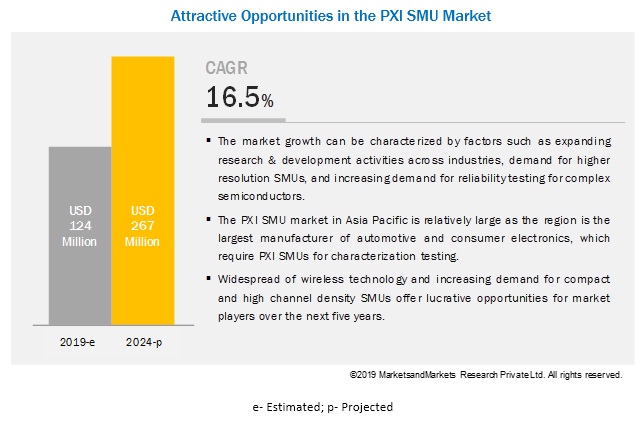
PXI SMU market is expected to grow at a CAGR of 16.5% during the forecast period (20192024)
PXI SMU Market and Top Companies
Key market players profiled in the PXI SMU market report include:
- Keysight Technologies (US)
- National Instruments (US)
- Chroma ATE (Taiwan)
- VX Instruments (Germany)
- Marvin Test Solutions (US)
- LitePoint, A Teradyne Company (US)
Keysight Technologies (US) is a technology provider that offers designing and test solutions for electronics equipment. Agilent Technologies (parent company of Keysight Technologies) was split from Hewlett-Packard in 1999. In 2013, Agilent Technologies was again split into two separate measurement companies; Agilent Technologies and Keysight Technologies. Keysight Technologies was incorporated in 2013 and got listed on the New York Stock Exchange in November 2014. The company offers solutions related to the design, development, manufacture, installation, deployment, validation, optimization, and secure operation of electronics systems that are used in communications, networking, and other electronics applications. The company operates through four business segments: Communications Solutions Group, Electronic Industrial Solutions Group, Ixia Solutions Group, and Services Solutions Group.
National Instruments (US) designs and manufactures products in the field of measurement, embedded systems, and automation. The company accelerates productivity and innovation through an open, software-defined platform. It provides software and hardware platforms under the category of modular instrumentation (VXI/PXI-based instrumentation) to speed up the testing and measurement process. It offers a broad range of products, including source measure units, digital multimeters, waveform generators, digital instruments, oscilloscopes, power supplies, and loads.
Chroma ATE (Taiwan) Chroma ATE is one of the prominent international suppliers of precision test and measurement instrumentation, automated test systems, smart manufacturing systems, and turnkey solutions. The company primarily operates through four business segments: Special Materials, Test Instrument, Automatic Equipment, and Others.
VX Instruments (Germany) develops and produces measurement instruments and test systems for automation and production. The company offers a broad range of product portfolio, which includes high power source measure units, waveform digitizer, waveform generator, quad system power supply, and cable adapter.
Marvin Test Solutions (US) a subsidiary of the Marvin Group, is a vertically integrated aerospace test and measurement company that creates and delivers innovative and reliable test systems. It offers various products and services such as source measure units, chassis & controller, digital instrumentation, measurement systems such as digital multi meters, A/D converters, precision DC source instrumentation, switching products, and power supplies.
Litepoint, a Teradyne Company (US) a subsidiary of the Teradyne, is provider of test solutions for wireless modules and consumer electronics, including smart phones, tablets, and PCs. The company holds specialization in technologically advanced wireless testing solutions. The company offers various PXIe based products for test & measurement applications. The products offered by the company include signal conditioning, cellular test systems, signal analyzers, signal generator, source measure unit, and others. The company states that 75% of the worlds Wi-Fi enabled devices are calibrated and verified using LitePoints connectivity and cellular test solutions.
PXI SMU Market and Channel Density
Channel density in PXI SMU market are:
- 1 Channel
- 2 Channel
- 4 Channel
- Above 4
1 Channel These are the most basic form of PXI SMUs. The one channel PXI SMUs are suitable for applications like testing of electronic device or component validation. Integration of one channel PXI SMUs with equipment reduces testing time and their compact size is an addon feature over the traditional source measure units.
2 Channel 2 channel PXI SMUs are suitable for applications like testing of semiconductors and organic and printed electronics. These SMUs ensure accurate current sharing between the products that are being tested and thus similar paralleled modules can be tested at one time. Chroma ATE is the only major provider of 2 channel PXI SMUs.
4 Channel The major applications of 4 channel PXI SMUs are semiconductors, LED testing, and aerospace & military applications. The 4 channel PXI SMUs have expanded channel density which is optimal for building parallel SMU test systems, deterministic hardware sequencing for minimizing software overhead, and high-speed update and sample rates for quickly changing setpoints and acquiring data.
Above 4 12 and 24 channels count are considered under above 4 channel segment. These are high density PXI SMUs and are specifically used for 5G applications. High-density PXI SMU, which provides six times more DC channel density than 1 and 4 channel PXI SMUs for testing RF, MEMS, and mixed-signal and other analog semiconductor components.
PXI SMU Market and Application
Application areas of PXI SMU market are:
- Semiconductor
- Green Energy Products
- LED
- Nanomaterials
- Precision Electronics
- Sensors
Semiconductors PXI SMUs are used for semiconductor testing as these are smarter alternative to traditional source measure units to meet cost and coverage requirements of increasingly complex RF and mixed-signal ICs. Technologies such as 5G, IoT, and industrial automation are changing dynamics of semiconductor manufacturing and testing. Such factors drive the demand for PXI SMUs from the semiconductors testing.
LED Traditional source measure units might require additional oscilloscope as these SMUs have low channel density. Using PXI SMUs measure voltage and current with high precision, traveling in the same channel. This not only lowers the cost of hardware procurement, but also streamlines the complexity of the test system. Also using PXI SMUs for LED testing eliminates problems such as having to test with the low sample resolution of oscilloscopes. Advantages of PXI SMUs over the traditional SMUs and the cost efficiency are factors that drive the demand for PXI SMUs for LED Testing.
Sensors Sensors are widely used in electronic products in various industries ranging from defense, aerospace, medical equipment manufacturing robotics, biotechnology, and automobile among others. Sensors detects a stimulus and outputs an electronic signal. PXI SMUs are appropriate for characterization of low-current sensors, which drives the demand for PXI SMUs from sensor testing.
Green Energy Products There is a test requirement for PV on various parameters such as efficiency, lifetime, and quality characterization which creates demand for PXI SMUs. Similarly, battery-powered devices require drain charge testing for which PXI SMUs are used. With increasing focus on electric vehicles and solar power generation, demand for PXI SMU is likely to get boosted for parametric tests of the equipment.
Nanomaterials Graphene-based electronics (transparent conductors, flexible displays, touch screens), memristor memory, nano-enabled implantable, nano-piezos (energy), sensors, are new areas in nanoscience research. PXI SMUs are suitable for the complete value chain of nanotechnology, thus is likely to be driven by growth of nanotechnology across end-use industries
Key Developments: PXI SMU Market
- In May 2016, Keysight Technologies launched a PXI Express source/measurement unit, M9111A, built for design validation and production test of next-generation power amplifiers and front-end modules supporting cellular and wireless connectivity formats.
- In 2020, VX Instruments has announced that it will launch PXIe source measure unit PXS(e)840x in 2020.
[147 Pages Report] The global PXI SMU market size is projected to reach USD 267 million by 2024, from an estimated USD 124 million in 2019, growing at a CAGR of 16.5% during the forecast period. Increasing research & development activities across industries create demand for PXI SMUs.
By channel, the 1 channel segment is expected to make the largest contribution to the PXI SMU market during the forecast period.
Compact and cost-effective features of 1 channel PXI SMU drives the demand for the segment. These are the most basic form of PXI SMUs. The 1 channel PXI SMUs are suitable for applications like testing of an electronic device or component validation. Integration of 1 channel PXI SMUs with equipment reduces testing time and their compact size is an addon feature over the traditional source measure units. Companies like National Instruments, Keysight Technologies, LitePoint, and VX Instruments are the major providers for 1 channel PXI SMU.
By application, the semiconductor segment is expected to grow at the fastest rate during the forecast period.
The semiconductors application segment is expected to grow at a higher CAGR during the forecast period. The higher manufacturing rate of semiconductors for complying demand from end-use industries drives the need for PXI SMUs. As the devices are getting smarter and software-centric, the semiconductor industry is focused on transformations in their basic IC designing and their testing to make these semiconductors more robust and reliable. Semiconductor technology requirements often overtake the test coverage that traditional approaches offer for analog, mixed-signal, and RF test. PXI SMUs are used for semiconductor testing as these are a smarter alternative to conventional source measure units to meet cost and coverage requirements of increasingly complex RF and mixed-signal ICs.
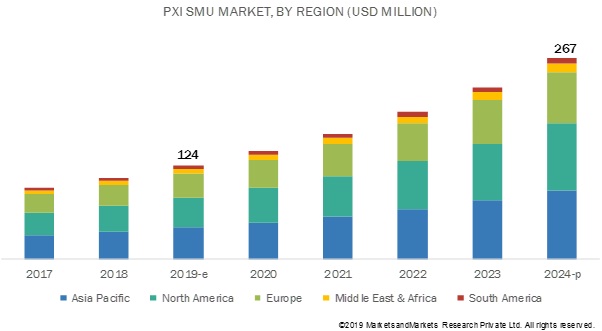
Asia Pacific is expected to be the largest market during the forecast period.
North America, Europe, South America, Asia Pacific, and the Middle East & Africa are the major regions considered for the study of the PXI SMU industry. Asia Pacific accounted for the majority of the PXI SMU market share in 2018 and is estimated to grow at the highest rate during the forecast period.
The majority of Asian countries are involved in the manufacturing of automobiles and electronics. PXI SMUs help in accurate testing of wireless equipment and RF testing along with mixed-signal ICs. All these factors drive the Asia Pacific PXI SMU market.
Key Market Players
The key players operating in this market include National Instruments (US), Keysight Technologies (US), Chroma ATE (Taiwan), VX Instruments (Germany), Marvin Test Solutions (US), and LitePoint a Teradyne Company (US).
Get online access to the report on the World's First Market Intelligence Cloud
- Easy to Download Historical Data & Forecast Numbers
- Company Analysis Dashboard for high growth potential opportunities
- Research Analyst Access for customization & queries
- Competitor Analysis with Interactive dashboard
- Latest News, Updates & Trend analysis
Request Sample Scope of the Report
Get online access to the report on the World's First Market Intelligence Cloud
- Easy to Download Historical Data & Forecast Numbers
- Company Analysis Dashboard for high growth potential opportunities
- Research Analyst Access for customization & queries
- Competitor Analysis with Interactive dashboard
- Latest News, Updates & Trend analysis

|
Report Metric |
Details |
|
Market Size available for years |
20172024 |
|
Base year considered |
2018 |
|
Forecast period |
20192024 |
|
Forecast units |
Value (USD) |
|
Segments covered |
Channel, end-user, application, and region |
|
Geographies covered |
North America, Europe, Asia Pacific, Middle East & Africa, and South America |
|
Companies covered |
National Instruments (US), Keysight Technologies (US), Chroma ATE (Taiwan), VX Instruments (Germany), Marvin Test Solutions (US), and LitePoint a Teradyne Company (US) |
This research report categorizes the PXI SMU market based on fuel type, power output, application, end-user, and region.
Based on the channel:
- 1 channel
- 2 channel
- 4 channel
- Above 4
Based on the application:
- Semiconductors
- LED
- Sensors
- Green Energy Products
- Nanomaterials
- Organic and Printed Electronics
- (trigeneration, quadgeneration, greenhouse operations, and renewable energy)
Based on the end-user:
- Aerospace, defense & government services
- Automotive
- Energy
- IT & telecommunication
- Consumer electronics
- Medical Equipment
Based on the region:
- North America
- Asia Pacific
- South America
- Europe
- Middle East & Africa
Recent Developments
- In May 2016, Keysight Technologies launched a PXI Express source/measurement unit, M9111A, built for design validation and production test of next-generation power amplifiers and front-end modules supporting cellular and wireless connectivity formats.
- In November 2019, National Instruments launched PXIe 4135, which is a high-precision, system source measure unit with voltage output up to 200 V. The new product is apt for industrial applications such as wafer-level parametric test, materials research and characterization of low-current sensors and integrated circuits (ICs). National Instruments focuses on keeping up with technological advancements, and such product launches help the company to differentiate and strengthen its portfolio from competitors.
Key Questions Addressed by the Report
- The report identifies and addresses the key segments of the PXI SMU market, which will help manufacturers and service providers review the growth in demand.
- The report helps system providers understand the pulse of the market and provides insights regarding the drivers, restraints, opportunities, and challenges.
- The report will help key players understand the strategies of their competitors better and make more pivotal strategic decisions.
- The report addresses the market share analysis of key players in the PXI SMU market, and with the help of this, companies can enhance their revenues in the respective markets.
- The report provides insights about emerging geographies for PXI SMU, and hence, the entire market ecosystem can gain a competitive advantage.
Frequently Asked Questions (FAQ):
What can be the favorable trends for shift from traditional source measure units (SMUs) to chassis based PXI source measure units?
Traditional SMUs had considerably lesser channel density, which was restricted for the level of parallelism, which can be achieved now with the help of next-generation PXI SMUs. With the advancements in the software driven PXI SMU technology, players are now offering increased DC channel density for higher parallelism in multisite applications.
Which of the end user application can be most lucrative for sales of PXI SMUs?
Wireless communication is projected to grow at the highest CAGR during the forecast period. Transition in mobile networks has offered users accessibility to faster data speeds and lower latency rates.
As a new technology in the market, what can be probable challenges faced by the manufacturers?
Although, PXI SMUs have better channel density, these are yet less preferred over the traditional SMUs due to their higher costs. Thus, renting and leasing of these SMUs might pose a challenge to the manufacturers.
What can be the driving factors for PXI SMU market in coming years?
Advancements in semiconductor designs and testing, IoT connectivity, and 5G adoption can be some driving factors for growth of PXI SMU market.
Which region is likely to experience higher growth in sales of PXI SMUs?
Asia Pacific is experiencing high demand for PXI SMUs as the region is the largest manufacturer of the electronics and automobiles, which are two most lucrative end-use industries for PXI SMUs. .
To speak to our analyst for a discussion on the above findings, click Speak to Analyst
Table of Contents
1 Introduction (Page No. - 17)
1.1 Objectives of the Study
1.2 Definition
1.2.1 PXI SMU Market, By Application: Inclusions vs. Exclusions
1.3 Market Scope
1.3.1 Market Segmentation
1.3.2 Regions Covered
1.3.3 Years Considered for the Study
1.4 Currency
1.5 Limitation
1.6 Stakeholders
2 Research Methodology (Page No. - 22)
2.1 Research Data
2.1.1 Secondary Data
2.1.1.1 Key Data From Secondary Sources
2.1.2 Primary Data
2.1.2.1 Key Data From Primary Sources
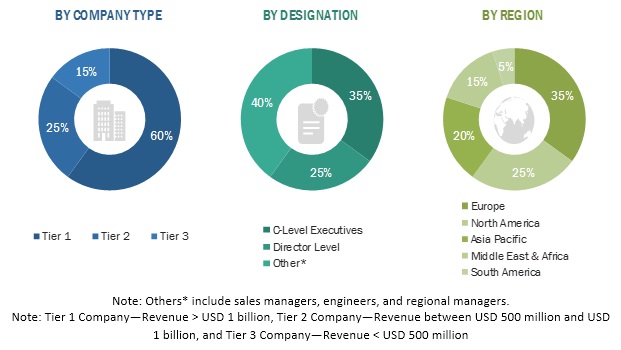
2.1.2.2 Breakdown of Primaries
2.2 Scope
2.3 Market Size Estimation
2.3.1 Supply-Side Analysis
2.3.1.1 Assumptions
2.3.1.1.1 Key Primary Insights
2.3.1.2 Calculation
2.3.2 Demand Analysis
2.3.2.1 Key Parameters / Trends
2.3.3 Forecast
2.4 Market Breakdown and Data Triangulation
2.5 Primary Insights
3 Executive Summary (Page No. - 32)
4 Premium Insights (Page No. - 36)
4.1 Attractive Opportunities in the PXI SMU Market During the Forecast Period
4.2 PXI SMU Market, By Channel
4.3 PXI SMU Market, By Application
4.4 PXI SMU Market, By End-User
4.5 PXI SMU Market, By Region
4.6 Asia Pacific PXI SMU Market, By Application & Country
5 Market Overview (Page No. - 40)
5.1 Introduction
5.2 Market Dynamics
5.2.1 Drivers
5.2.1.1 Growing Research & Development Activities Across Industries Create Demand for PXI SMUs
5.2.1.2 Demand for High Resolution Modular Source Measure Units for Critical Applications
5.2.1.3 Rising Demand for Reliability Tests for Complex Semiconductors and Batteries to Complement the Increasing Iot Devices
5.2.2 Restraints
5.2.2.1 High Availability of Cheaper Substitutes Such as Power Supplies and Digital Multi-Meters
5.2.3 Opportunities
5.2.3.1 Rapid Development of Wireless Technology Brings Opportunities for PXI SMUs
5.2.3.2 Increasing Demand for Compact and High-Density Smus
5.2.4 Challenges
5.2.4.1 Higher Demand From Rental and Leasing Services Affecting Sales of PXI and Pxie Smus
6 PXI SMU Market, By Channel (Page No. - 47)
6.1 Introduction
6.2 1 Channel
6.2.1 Compact Size and Cost-Effectiveness of 1 Channel PXI SMU Drive Demand for the Segment
6.3 2 Channel
6.3.1 Higher Precision Testing Offered By 2 Channel PXI SMUs Drives Market Growth
6.4 4 Channel
6.4.1 Higher Demand for Building Parallel Smu Test Systems Drives Demand for 4 Channel PXI SMUs
6.5 Above 4
6.5.1 Increasing Demand for Flexible PXI SMUs for Testing Expensive Instrumentation Drives Demand for Above 4 Channel Segment
7 PXI SMU Market, By Application (Page No. - 53)
7.1 Introduction
7.2 Semiconductors
7.2.1 Increased Manufacturing of Semiconductors to Meet Demand From End-Use Industries Drives Demand for PXI SMUs
7.3 Led
7.3.1 Higher Precision Offered By PXI SMU in Led Testing Drives Market Growth
7.4 Sensors
7.4.1 High Reliability and Parametric Tests Required for Sensors Drive Demand for PXI SMUs
7.5 Green Energy Products
7.5.1 Growing Demand for Solar Panels and Batteries Likely to Boost Demand for PXI SMUs
7.6 Nanomaterials
7.6.1 Higher Adoption of Nanotechnology in Automotive and Medical Equipment Manufacturing Drives the PXI SMU Market
7.7 Organic and Printed Electronics
7.7.1 Demand for Precision Organic Electronics for Sustainable Manufacturing is Expected to Drive PXI SMU Market
8 PXI SMU Market, By End-User (Page No. - 61)
8.1 Introduction
8.2 Aerospace, Defense & Government Service
8.2.1 High Test Standards for Aerospace and Defense Create Demand for Pxi Source Measure Units
8.3 Automotive
8.3.1 Increasing Emc Standards for Testing and Validation of Electric and Electronic Vehicle Components Drives Demand for PXI SMUs
8.4 Energy
8.4.1 Increased Manufacturing of Solar Products and Green Products is Likely to Drive PXI SMU Market
8.5 It & Telecommunication
8.5.1 High Demand for Designing and Tesing of Wireless Equipment Drives Demand for High Density PXI SMUs
8.6 Consumer Electronics
8.6.1 Increasing Electronic Product Manufacturing Creates Demand for PXI SMUs
8.7 Medical Equipment
8.7.1 Strict General Controls and Procedural Regulations for Medical Device Testing is Driving Demand for PXI SMUs Medical Equipment
9 PXI SMU Market, By Region (Page No. - 72)
9.1 Introduction
9.2 Asia Pacific
9.2.1 By Channel
9.2.2 By Application
9.2.3 By End-User
9.2.3.1 End-User By Country
9.2.4 By Country
9.2.5 China
9.2.5.1 Investments in Digital Infrastructure, and Widespread 4g and 5g Connectivity are Enabling the High Demand for the PXI SMU Market
9.2.6 India
9.2.6.1 High Investments in Telecom & It Sector Fueling Growth of PXI SMU Market
9.2.7 Australia
9.2.7.1 Automotive Industry Transitioning Toward Automation is Driving the Demand for PXI SMUs
9.2.8 Japan
9.2.8.1 Significant Impact of Iot Across End-Use Industries is Likely to Bring Opportunities for PXI SMU Market
9.2.9 South Korea
9.2.9.1 Increasing Manufacturing of Electronics and Automobiles in South Korea Drives the Market for PXI SMUs
9.2.10 Rest of Asia Pacific
9.3 North America
9.3.1 By Channel
9.3.2 By Application
9.3.3 By End-User
9.3.3.1 End-User By Country
9.3.4 By Country
9.3.4.1 US
9.3.4.1.1 Increasing Adoption of Modular High Channel Density Smus for Testing Critical Aerospace Applications is Driving PXI SMU Market
9.3.4.2 Canada
9.3.4.2.1 Optimum Utilization of Power Components and Ongoing Developments in Industries Likely to Boost PXI SMU Market
9.3.4.3 Mexico
9.3.4.3.1 Rising Investments in 4g Network Adoption are Attracting Opportunities for PXI SMUs
9.4 Europe
9.4.1 By Channel
9.4.2 By Application
9.4.3 By End-User
9.4.3.1 End-User By Country
9.4.4 By Country
9.4.4.1 UK
9.4.4.1.1 Governments Plan to Increase Digital Connectivity Creates Demand for Modular PXI SMUs
9.4.4.2 France
9.4.4.2.1 High Demand for Testing Equipment From the Aerospace & Defense Sector is Driving PXI SMU Market
9.4.4.3 Germany
9.4.4.3.1 Increasing Adoption of Digital Technologies in Medical Equipment and Automotive Sectors is Likely to Drive Demand for PXI SMUs
9.4.4.4 Italy
9.4.4.4.1 High Demand for From Medical Equipment Manufacturing and Consumer Electronics Industries is Driving PXI SMU Market
9.4.4.5 Spain
9.4.4.5.1 High Demand for Testing Equipment From the Aerospace & Defense Sector is Driving PXI SMU Market
9.4.4.6 Russia
9.4.4.6.1 Growing Automotive and Telecommunication Sector Drives Demand for PXI SMUs
9.4.4.7 Rest of Europe
9.5 Middle East & Africa
9.5.1 By Channel
9.5.2 By Application
9.5.3 By End-User
9.5.3.1 End-User By Sub-Region
9.5.4 By Sub-Region
9.5.4.1 Middle East
9.5.4.1.1 Rising Demand From It & Telecommunication Sector is Driving Demand for PXI SMUs
9.5.4.2 Africa
9.5.4.2.1 Emphasis on Industrialization Likely to Boost Demand for PXI SMU Market
9.6 South America
9.6.1 By Channel
9.6.2 By Application
9.6.3 By End-User
9.6.3.1 End-User By Country
9.6.4 By Country
9.6.4.1 Brazil
9.6.4.1.1 Booming Automotive Manufacturing is Likely to Boost PXI SMU Market
9.6.4.2 Argentina
9.6.4.2.1 Rising Investments in Telecom Sector is Major Driver for PXI SMUs Market
9.6.4.3 Chile
9.6.4.3.1 Plans to Reduce the Digital Gap and Promote Competition and Quality of Services Expected to Increase Demand for PXI SMUs
10 Competitive Landscape (Page No. - 118)
10.1 Overview
10.2 Ranking of Players
10.3 Competitive Scenario
10.3.1 New Product Launches
11 Company Profile (Page No. - 120)
(Business Overview, Products & Services, Key Insights, Recent Developments, SWOT Analysis, MnM View)*
11.1 Original Equipment Manufacturer
11.1.1 Keysight Technologies
11.1.2 National Instruments
11.1.3 Chroma ATE
11.1.4 Marvin Test Solutions
11.1.5 Litepoint, A Teradyne Company
11.1.6 VX Instruments GmbH
11.2 Pxi/Pxie Chassis Providers
11.2.1 Virginia Panel Corporation
11.3 Pxi/Pxie Source Measure Unit Distributors
11.3.1 Artisan Technology Group
11.3.2 Apex Waves
11.3.3 Test Dynamics
11.3.4 Yotta Volt
11.3.5 Crezon Technology
11.3.6 Vigven
11.3.7 Acquitek
*Details on Business Overview, Products & Services, Key Insights, Recent Developments, SWOT Analysis, MnM View Might Not Be Captured in Case of Unlisted Companies.
12 Appendix (Page No. - 140)
12.1 Insights of Industry Experts
12.2 Discussion Guide
12.1 Knowledge Store: Marketsandmarkets Subscription Portal
12.2 Available Customizations
12.3 Related Reports
12.4 Author Details
List of Tables (101 Tables)
Table 1 PXI SMU Market: Players/Companies Connected
Table 2 PXI SMU Market: Industry / Country Analysis
Table 3 PXI SMU Market Snapshot
Table 4 PXI SMU Market Size, By Channel, 20172024 (USD Thousand)
Table 5 1 Channel: PXI SMU Market Size, By Region, 20172024 (USD Thousand)
Table 6 2 Channel: PXI SMU Market Size, By Region, 20172024 (USD Thousand)
Table 7 4 Channel: PXI SMU Market Size, By Region, 20172024 (USD Thousand)
Table 8 Above 4: PXI SMU Market Size, By Region, 20172024 (USD Thousand)
Table 9 PXI SMU Market Size, By Application, 20172024 (USD Thousand)
Table 10 Semiconductors: PXI SMU Market Size, By Region, 20172024 (USD Thousand)
Table 11 Led: PXI SMU Market Size, By Region, 20172024 (USD Thousand)
Table 12 Sensors: PXI SMU Market Size, By Region, 20172024 (USD Thousand)
Table 13 Green Energy Products: PXI SMU Market Size, By Region, 20172024 (USD Thousand)
Table 14 Nanomaterials: PXI SMU Market Size, By Region, 20172024 (USD Thousand)
Table 15 Organic and Printed Electronics: PXI SMU Market Size, By Region, 20172024 (USD Thousand)
Table 16 PXI SMU Market Size, By End-User, 20172024 (USD Thousand)
Table 17 Aerospace, Defense & Government Service: PXI SMU Market Size, By Region, 20172024 (USD Thousand)
Table 18 Aerospace, Defense & Government Service: PXI SMU Market Size, Fastest Growing Countries, 20172024 (USD Thousand)
Table 19 Automotive: PXI SMU Market Size, By Region, 20172024 (USD Thousand)
Table 20 Automotive: PXI SMU Market Size, Fastest Growing Countries, 20172024 (USD Thousand)
Table 21 Energy: PXI SMU Market Size, By Region, 20172024 (USD Thousand)
Table 22 Energy: PXI SMU Market Size, Fastest Growing Countries, 20172024 (USD Thousand)
Table 23 It & Telecommunication: PXI SMU Market Size, By Region, 20172024 (USD Thousand)
Table 24 It & Telecommunication: PXI SMU Market Size, Fastest Growing Countries, 20172024 (USD Thousand)
Table 25 Consumer Electronics: PXI SMU Market Size, By Region, 20172024 (USD Thousand)
Table 26 Consumer Electronics: PXI SMU Market Size, Fastest Growing Countries, 20172024 (USD Thousand)
Table 27 Medical Equipment: PXI SMU Market Size, By Region, 20172024 (USD Thousand)
Table 28 Medical Equipment: PXI SMU Market Size, Fastest Growing Countries, 20172024 (USD Thousand)
Table 29 PXI SMU Market Size, By Region, 20172024 (USD Thousand)
Table 30 PXI SMU Market Size, Fastest Growing Countries, 20172024 (USD Thousand)
Table 31 Asia Pacific: PXI SMU Market Size, By Channel, 20172024 (USD Thousand)
Table 32 Asia Pacific: PXI SMU Market Size, By Application, 20172024 (USD Thousand)
Table 33 Asia Pacific: PXI SMU Market Size, By End-User, 20172024 (USD Thousand)
Table 34 Asia Pacific: Aerospace, Defense & Government Service PXI SMU Market Size, By Country, 20172024 (USD Thousand)
Table 35 Asia Pacific: Automotive PXI SMU Market Size, By Country, 20172024 (USD Thousand)
Table 36 Asia Pacific: Energy PXI SMU Market Size, By Country, 20172024 (USD Thousand)
Table 37 Asia Pacific: It & Telecommunication PXI SMU Market Size, By Country, 20172024 (USD Thousand)
Table 38 Asia Pacific: Consumer Electronics PXI SMU Market Size, By Country, 20172024 (USD Thousand)
Table 39 Asia Pacific: Medical Equipment PXI SMU Market Size, By Country, 20172024 (USD Thousand)
Table 40 Asia Pacific: PXI SMU Market Size, By Country, 20172024 (USD Thousand)
Table 41 China: PXI SMU Market Size, By End-User, 20172024 (USD Thousand)
Table 42 India: PXI SMU Market Size, By End-User, 20172024 (USD Thousand)
Table 43 Australia: PXI SMU Market Size, By End-User, 20172024 (USD Thousand)
Table 44 Japan: PXI SMU Market Size, By End-User, 20172024 (USD Thousand)
Table 45 South Korea: PXI SMU Market Size, By End-User, 20172024 (USD Thousand)
Table 46 Rest of Asia Pacific: PXI SMU Market Size, By End-User, 20172024 (USD Thousand)
Table 47 North America: PXI SMU Market Size, By Channel, 20172024 (USD Thousand)
Table 48 North America: PXI SMU Market Size, By Application, 20172024 (USD Thousand)
Table 49 North America: PXI SMU Market Size, By End-User, 20172024 (USD Thousand)
Table 50 North America: Aerospace, Defense & Government Service PXI SMU Market Size, By Country, 20172024 (USD Thousand)
Table 51 North America: Automotive PXI SMU Market Size, By Country, 20172024 (USD Thousand)
Table 52 North America: Energy PXI SMU Market Size, By Country, 20172024 (USD Thousand)
Table 53 North America: It & Telecommunication PXI SMU Market Size, By Country, 20172024 (USD Thousand)
Table 54 North America: Consumer Electronics PXI SMU Market Size, By Country, 20172024 (USD Thousand)
Table 55 North America: Medical Equipment PXI SMU Market Size, By Country, 20172024 (USD Thousand)
Table 56 North America: PXI SMU Market Size, By Country, 20172024 (USD Thousand)
Table 57 US: PXI SMU Market Size, By End-User, 20172024 (USD Thousand)
Table 58 Canada: PXI SMU Market Size, By End-User, 20172024 (USD Thousand)
Table 59 Mexico: PXI SMU Market Size, By End-User, 20172024 (USD Thousand)
Table 60 Europe: PXI SMU Market Size, By Channel, 20172024 (USD Thousand)
Table 61 Europe: PXI SMU Market Size, By Application, 20172024 (USD Thousand)
Table 62 Europe: PXI SMU Market Size, By End-User, 20172024 (USD Thousand)
Table 63 Europe: Aerospace, Defense & Government Service PXI SMU Market Size, By Country, 20172024 (USD Thousand)
Table 64 Europe: Automotive, PXI SMU Market Size, By Country 20172024 (USD Thousand)
Table 65 Europe: Energy, PXI SMU Market Size, By Country 20172024 (USD Thousand)
Table 66 Europe: It & Telecommunication PXI SMU Market Size, By Country, 2017 2024 (USD Thousand)
Table 67 Europe: Consumer Electronics PXI SMU Market Size, By Country, 20172024 (USD Thousand)
Table 68 Europe: Medical Equipment PXI SMU Market Size, By Country, 20172024 (USD Thousand)
Table 69 Europe: PXI SMU Market Size, By Country, 20172024 (USD Thousand)
Table 70 UK: PXI SMU Market Size, By End-User, 20172024 (USD Thousand)
Table 71 France: PXI SMU Market Size, By End-User, 20172024 (USD Thousand)
Table 72 Germany: PXI SMU Market Size, By End-User, 20172024 (USD Thousand)
Table 73 Italy: PXI SMU Market Size, By End-User, 20172024 (USD Thousand)
Table 74 Spain: PXI SMU Market Size, By End-User, 20172024 (USD Thousand)
Table 75 Russia: PXI SMU Market Size, By End-User, 20172024 (USD Thousand)
Table 76 Rest of Europe: PXI SMU Market Size, By End-User, 20172024 (USD Thousand)
Table 77 Middle East & Africa: PXI SMU Market Size, By Channel, 20172024 (USD Thousand)
Table 78 Middle East & Africa: PXI SMU Market Size, By Application, 20172024 (USD Thousand)
Table 79 Middle East & Africa: PXI SMU Market Size, By End-User, 20172024 (USD Thousand)
Table 80 Middle East & Africa: Aerospace, Defense & Government Service PXI SMU Market Size, By Sub-Region, 20172024 (USD Thousand)
Table 81 Middle East & Africa: Automotive PXI SMU Market Size, By Sub-Region, 20172024 (USD Thousand)
Table 82 Middle East & Africa: Energy PXI SMU Market Size, By Sub-Region, 20172024 (USD Thousand)
Table 83 Middle East & Africa: It & Telecommunication PXI SMU Market Size, By Sub-Region, 20172024 (USD Thousand)
Table 84 Middle East & Africa: Consumer Electronics PXI SMU Market Size, By Sub-Region, 20172024 (USD Thousand)
Table 85 Middle East & Africa: Medical Equipment PXI SMU Market Size, By Sub-Region, 20172024 (USD Thousand)
Table 86 Middle East & Africa: PXI SMU Market Size, By Sub-Region, 20172024 (USD Thousand)
Table 87 Middle East: PXI SMU Market Size, By End-User, 20172024 (USD Thousand)
Table 88 Africa: PXI SMU Market Size, By End-User, 20172024 (USD Thousand)
Table 89 South America: PXI SMU Market Size, By Channel, 20172024 (USD Thousand)
Table 90 South America: PXI SMU Market Size, By Application, 20172024 (USD Thousand)
Table 91 South America: PXI SMU Market Size, By End-User, 20172024 (USD Thousand)
Table 92 South America: Aerospace, Defense & Government Service PXI SMU Market Size, By Country, 20172024 (USD Thousand)
Table 93 South America: Automotive PXI SMU Market Size, By Country, 20172024 (USD Thousand)
Table 94 South America: Energy PXI SMU Market Size, By Country, 20172024 (USD Thousand)
Table 95 South America: It & Telecommunication PXI SMU Market Size, By Country, 20172024 (USD Thousand)
Table 96 South America: Consumer Electronics PXI SMU Market Size, By Country, 20172024 (USD Thousand)
Table 97 South America: Medical Equipment PXI SMU Market Size, By Country, 20172024 (USD Thousand)
Table 98 South America: PXI SMU Market Size, By Country, 20172024 (USD Thousand)
Table 99 Brazil: PXI SMU Market Size, By End-User, 20172024 (USD Thousand)
Table 100 Argentina: PXI SMU Market Size, By End-User, 20172024 (USD Thousand)
Table 101 Chile: PXI SMU Market Size, By End-User, 20172024 (USD Thousand)
List of Figures (32 Figures)
Figure 1 PXI SMU Market: Research Design
Figure 2 Research Methodology: Illustration of PXI SMU Company Revenue Estimation (2018)
Figure 3 Ranking of Key Players, 2018
Figure 4 Data Triangulation Methodology
Figure 5 Key Service Providers Point of View
Figure 6 Asia Pacific Dominated the PXI SMU Market in 2018
Figure 7 Above 4 Channel Segment is Expected to Witness Highest CAGR During the Forecast Period
Figure 8 Semiconductor Segment is Expected to Lead the PXI SMU Market, By Application, During the Forecast Period
Figure 9 It & Telecommunication Segment is Expected to Lead the PXI SMU Market, By End-User, During the Forecast Period
Figure 10 Investments in Research & Development and Equipment Testing and High Demand for Modular Source Measure Units is Driving the PXI SMU Market, 20192024
Figure 11 1 Channel Segment Dominated the PXI SMU Market, By Channel, in 2018
Figure 12 Semiconductor Segment is Expected to Dominate the PXI SMU Market By Application, During the Forecast Period
Figure 13 It & Telecommunications Segment Dominated the PXI SMU Market in 2018
Figure 14 North America is Expected to Grow at the Highest CAGR During the Forecast Period
Figure 15 Semiconductor Segment and China Dominated the Asia Pacific PXI SMU Market in 2018
Figure 16 PXI SMU Market: Drivers, Restraints, Opportunities & Challenges
Figure 17 R&D Spending By Country in 2018 (USD Million)
Figure 18 PXI SMUs Versus Traditional Standalone Smus
Figure 19 Iot Devices Connectivity Trend
Figure 20 1 Channel Segment is Expected to Dominate the PXI SMU Market During the Forecast Period
Figure 21 Semiconductors Segment Dominated the PXI SMU Market in 2018
Figure 22 It & Telecommunication End-User Industry Dominated the PXI SMU Market in 2018
Figure 23 Renewable Sector Dominated the Overall Power Sector Investments in 2018
Figure 24 China is Expected to Grow at the Highest CAGR Duringthe Forecast Period
Figure 25 Asia Pacific is Expected to Dominate the PXI SMU Market During the Forecast Period
Figure 26 Regional Snapshot: Asia Pacific PXI SMU Market in 2018
Figure 27 Regional Snapshot: North America PXI SMU Market in 2018
Figure 28 Germany Dominated the European PXI SMU Market in 2018
Figure 29 Ranking of Key Players, 2018
Figure 30 Keysight Technologies: Company Snapshot
Figure 31 National Instruments: Company Snapshot
Figure 32 Chroma ATE: Company Snapshot
This study involved four major activities in estimating the current size of the global PXI SMU market. Exhaustive secondary research was done to collect information on the market, peer market, and parent market. The next step was to validate these findings, assumptions, and market sizing with industry experts across the value chain through primary research. Both top-down and bottom-up approaches were used to estimate the total market size. After that, the market breakdown and data triangulation were done to estimate the market size of the segments and sub-segments.
Secondary Research
This research study involved the use of extensive secondary sources, directories, and databases, such as Hoovers, Bloomberg BusinessWeek, Factiva, and OneSource, to identify and collect information useful for a technical, market-oriented, and commercial study of the global PXI SMU market. The other secondary sources included annual reports, press releases & investor presentations of companies, white papers, certified publications, articles by recognized authors, manufacturer associations, trade directories, and databases.
Primary Research
The PXI SMU market comprises several stakeholders, such as end-product manufacturers and end-users in the supply chain. The demand-side of this market is characterized by its end-users, such as manufacturing facilities and R&D facilities of IT & telecommunication, automotive, consumer electronics, and others. The supply-side is characterized by gas engine manufacturers, tool providers, and others. Various primary sources from both the supply and demand sides of the market were interviewed to obtain qualitative and quantitative information. The breakdown of primary respondents are given below:
To know about the assumptions considered for the study, download the pdf brochure
Market Size Estimation
Both top-down and bottom-up approaches have been used to estimate and validate the size of the global PXI SMU market and its dependent submarkets. These methods were also used extensively to estimate the size of various sub-segments in the market. The research methodology used to estimate the market size includes the following:
- The key players in the industry and market have been identified through extensive secondary research, and their market share in the respective regions have been determined through both primary and secondary research.
- The industrys supply chain and market size, in terms of value, have been determined through primary and secondary research processes.
- All percentage shares, splits, and breakdowns have been determined using secondary sources and verified through primary sources.
Data Triangulation
After arriving at the overall PXI SMU market size-using the market size estimation processes as explained above-the market was split into several segments and subsegments. To complete the overall market engineering process and arrive at the exact statistics of each market segment and subsegment, data triangulation, and market breakdown procedures were employed, wherever applicable. The data was triangulated by studying various factors and trends from both the demand and supply sides in the PXI SMUs, R&D investments, and end-use sectors.
Report Objectives
- To provide detailed information on the major factors influencing the growth of the market, such as drivers, restraints, opportunities, and industry-specific challenges
- To define, describe, segment, and forecast the global PXI SMU market based on fuel type, power output, application, end-user, and region
- To provide detailed information about the major factors influencing the growth of the market (drivers, restraints, opportunities, and industry-specific challenges)
- To strategically analyze the global PXI SMU market with respect to individual growth trends, future expansions, and contribution of each segment to the market
- To analyze market opportunities for stakeholders and details of the competitive landscape for market leaders
- To forecast the growth of the global PXI SMU market with respect to the main regions (North America, Europe, Asia Pacific, Middle East & Africa, and South America)
- To profile and rank key players and comprehensively analyze their market share
- To analyze competitive developments such as contracts & agreements, expansions & investments, new product launches, mergers & acquisitions, joint ventures, and partnerships & collaborations in the PXI SMU market
Available Customizations:
With the given market data, MarketsandMarkets offers customizations as per the clients specific needs. The following customization options are available for this report:
Regional Analysis
- Further breakdown of region or country-specific analysis
Company Information
- Detailed analyses and profiling of additional market players (up to 5)


Growth opportunities and latent adjacency in PXI SMU Market