Quantum Cascade Laser Market by Packaging Type (C-Mount, HHL & VHL Package, TO3 Package), Operation Mode (Continuous Wave, Pulsed), Fabrication Technology (FabryPerot, Distributed Feedback), End User, and Region - Global Forecast to 2025


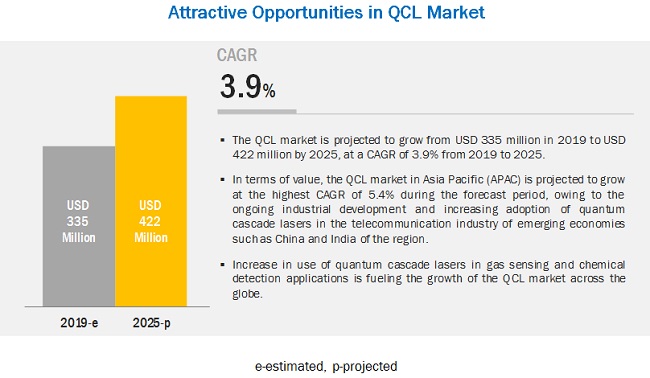
[169 Pages Report] The global quantum cascade laser market size is expected to grow from USD 335 million in 2019 to USD 422 million by 2025, at a CAGR of 3.9% during the forecast period. Increasing use of quantum cascade lasers in gas sensing and chemical detection applications and growing demand for quantum cascade lasers in healthcare applications are the key factors driving the growth of the quantum cascade laser market.
The quantum cascade laser market for continuous wave operation mode to grow at higher CAGR during forecast period
The market for continuous wave (CW) operation mode is expected to grow at a higher CAGR during the forecast period. This high growth is due to its use in most of the QCL devices, as it provides continuous waves without any delay in time. In continuous wave mode, QCLs emit an uninterrupted laser beam. This is achieved through the constant pumping of the QCL. In this mode, the amplitude and the frequency of the wave are constant. A QCL operating in continuous wave mode requires stable output power.
The quantum cascade laser market for telecommunication to grow at highest CAGR during forecast period
The telecommunication segment is expected to be the major adopter of QCL technology during the forecast period. The deployment of quantum cascade lasers in the telecommunication sector is likely to further fuel the demand for QCL-based devices in free-space optical communication applications. Free-space optical communication is a promising solution that has an advantage of unlimited bandwidth, high security, and low cost. QCLs, being the most optimum light source in infrared wavelength, can be used in free-space optical communication.
The quantum cascade laser market in APAC is expected to grow at highest CAGR during 20192025
The quantum cascade laser market in APAC is projected to grow at the highest CAGR, in terms of value, during the forecast period, owing to increasing industrial manufacturing infrastructure development activities and growing military & defense expenditure in emerging economies such as China and India. The commercialization of applications of QCLs is in its introductory stage in the developing economies of the APAC region. However, countries such as China, India, and Japan are taking initiatives such as investments in R&D to encourage the adoption of QCLs in the region, which is expected to boost the demand for QCLs in the future.
Key Market Players
Thorlabs (US), Hamamatsu Photonics K.K. (Japan), mirSense (France), Emerson Electric Co. (US), Block MEMS (US), Wavelength Electronics Inc (US), Pranalytica (US), DRS Daylight Solutions (US), PNNL (US), nanoplus Nanosystems Technologies GmbH (Germany), Lasermax Inc. (US), Picarro Inc (US), Akela Laser Corporation (US), Aerodyne Research Inc. (US), Alpes Laser (Switzerland), Power Technology Inc. (US), Boston Electronics Corporation (US), MG Optical (Germany), SacherLaser Technik (Germany), AdTech Optics (US), Longwave Photonics (US), and Eluxi Ltd. (UK) are some of the major companies in the quantum cascade laser market.
Alpes Lasers SA (US) was ranked first in the QCL market. The company has continuously escalated its R&D spending in recent years, which has resulted in the development of its unique and state-of-the-art QCL-based products.
Thorlabs, Inc. (US) has a wide array of product offerings in the QCL market. It carries out product launches, collaborations, and acquisitions to offer FabryPerot and distributed feedback type devices across the mid-infrared wavelength. In October 2014, it acquired the quantum cascade lasers business of Corning Incorporated (US) along with its associated optical semiconductor technologies research group in a private transaction. This acquisition strengthened the portfolio of Thorlabs, Inc. for sensing, scientific, and defense-related equipment. The company offers its products through distributors in Australia, Canada, India, Israel, Italy, Korea, Benelux, Poland, Russia, Singapore, Taiwan, and Turkey, as well as online. Thorlabs, Inc. has strategic partnerships with Menlo Systems GmbH; Daylight Solutions, Inc.; Boston Micromachines Corporation; Praevium Research, Inc.; PicoLuz LLC; Idesta Quantum Electronics; and Castor Optics.
Block MEMS (US), one of the key players in the quantum cascade laser market, has expertise in developing chemical sensing and gas detection devices. It continuously launches new products in the market to strengthen its product portfolio. In 2015 and 2014, it launched new products such as LaserWarn, LaserTune, and Mini-QCL module in the market. The collaboration of Block MEMS with Pfizer Inc. (US) to develop QCL-based systems is another step adopted by the company to improvise its product portfolio. In the quantum cascade portfolio, the company offers LaserSense, LaserWarn, LaserTune, and MCT IR Detector Module. LaserSense is a gas detection system based on infrared absorption spectroscopy. The company aims at increasing its reach in different applications such as telecommunication, oil & gas, aerospace, etc.
Get online access to the report on the World's First Market Intelligence Cloud
- Easy to Download Historical Data & Forecast Numbers
- Company Analysis Dashboard for high growth potential opportunities
- Research Analyst Access for customization & queries
- Competitor Analysis with Interactive dashboard
- Latest News, Updates & Trend analysis
Request Sample Scope of the Report
:
Get online access to the report on the World's First Market Intelligence Cloud
- Easy to Download Historical Data & Forecast Numbers
- Company Analysis Dashboard for high growth potential opportunities
- Research Analyst Access for customization & queries
- Competitor Analysis with Interactive dashboard
- Latest News, Updates & Trend analysis

|
Report Metric |
Details |
|
Market size available for years |
20162025 |
|
Base year |
2018 |
|
Forecast period |
20192025 |
|
Units |
Value (USD) and Volume (Units) |
|
Segments covered |
Fabrication Technology, Operation Mode, Packaging Mode, End User, and Geography |
|
Geographic regions covered |
North America, APAC, Europe, and RoW |
|
Companies covered |
Thorlabs, Hamamatsu Photonics K.K., mirSense, Emerson Electric Co., Block MEMS, Wavelength Electronics Inc., Pranalytica, DRS Daylight Solutions., PNNL, and nanoplus Nanosystems Technologies GmbH, Lasermax Inc., Picarro Inc, Akela Laser Corporation, Aerodyne Research Inc., Alpes Laser, Power Technology Inc., Boston Electronics Corporation, Frankfurt Company, MG Optical, SacherLaser Technik, AdTech Optics, Longwave Photonics, and Eluxi Ltd. |
This report categorizes the QCL market based on fabrication technology, operation mode, packaging type, end user, and Geography.
By Fabrication Technology:
- FabryPerot
- Distributed Feedback
- Tunable External Cavities
By Operation Mode:
- Continuous Wave Mode
- Pulsed Mode
By Packaging Type:
- C-Mount Package
- HHL & VHL Package
- TO3 Package
By End User:
- Industrial
- Healthcare
- Telecommunication
- Military & defense
- Others (research and development, education)
By Region:
- North America
- US
- Canada
- Mexico
- Europe
- Germany
- France
- UK
- Rest of Europe
- Asia Pacific (APAC)
- China
- Japan
- South Korea
- Rest of APAC
- Rest of the World (RoW)
- South America
- Middle East & Africa
Key Questions Addressed in the Report
- How big is the opportunity for the QCL market? How rising adoption of QCL products can help grasp this opportunity?
- Which are the recent industry trends that can be implemented to generate additional revenue streams?
- Who are the major players operating in the quantum cascade laser market? Which companies are the front runners?
- With the rise in demand for QCL products from various end-user industries, what are the opportunities for players now and for those planning to enter various stages of the value chain?
- How will the increasing adoption of QCL products in industrial and military & defense segments impact the growth rate of the overall quantum cascade laser market?
Frequently Asked Questions (FAQ):
Which are the major drivers of quantum cascade laser market? How huge is the opportunity for growth in the next five years?
The drivers fueling the growth of the quatum cascade laser (QCL) market are increased use of quantum cascade lasers in gas sensing, chemical detection, and healthcare applications, along with the development of QCL-based non-invasive medical diagnostic tools.The market is expected to grow at CAGR 3.9% from 2019 to 2025
Which are the major companies in the quantum cascade laser market? What are their major strategies to strengthen their market presence?
The major companies in quantum cascade laser market includes Alpes Lasers SA (Switzerland), mirSense (France), Thorlabs, Inc. (US),Hamamatsu Photonics K.K. (Japan), AdTech Optics (US), Block MEMS LLC (US), (US), Wavelength Electronics, Inc. (US). The major strategies adopted by these players are product development, collaboration & partnership strategy.
Which is the potential market for quantum cascade laser in terms of region?
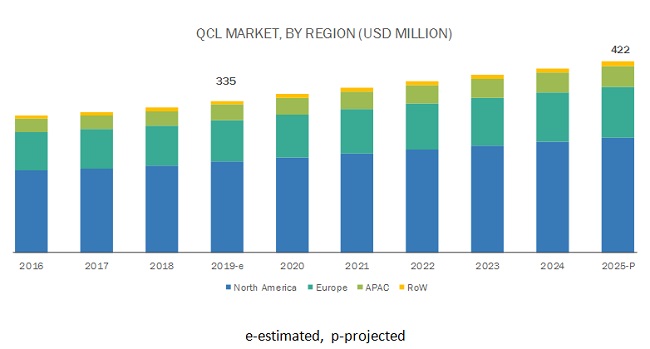
North America dominates quantum cascade laser (QCL) market, accounting for ~60% of the share in global market.The growth of the QCL market in North America can be attributed to the growing adoption of QCL-based breath analyzers in the healthcare sector and QCL-based direct infrared countermeasures (DIRCMs) in the military & defense sector, thereby propelling the growth of the QCL market.
Which are the major technologies for quantum cascade laser market? How huge is the opportunity for their growth in the next five years?
The major fabrication technology for quantum cascade laser includes Fabry Perot, Distributed Feedback, and tunnable external cavities laser . Which will lead to market opportunity of USD 422 million by 2025
Which end use application will be widely using quantum cascade laser, during next five years ?
The industrial end user segment accounted for the largest share o of the QCL market. The growth of this segment can be attributed to the increasing use of quantum cascade lasers in manufacturing plants for gas sensing and chemical detection applications. The deployment of quantum cascade lasers in the telecommunication sector is likely to further fuel the demand for quantum cascade laser-based products.
To speak to our analyst for a discussion on the above findings, click Speak to Analyst
Table of Contents
1 Introduction (Page No. - 17)
1.1 Study Objectives
1.2 Market Definition
1.3 Study Scope
1.3.1 Markets Covered
1.3.2 Geographic Analysis
1.3.3 Years Considered for the Study
1.4 Currency
1.5 Package Size
1.6 Limitations
1.7 Stakeholders
2 Research Methodology (Page No. - 21)
2.1 Introduction
2.1.1 Secondary Data
2.1.1.1 Key Data From Secondary Sources
2.1.2 Primary Data
2.1.2.1 Key Data From Primary Sources
2.1.2.2 Key Industry Insights
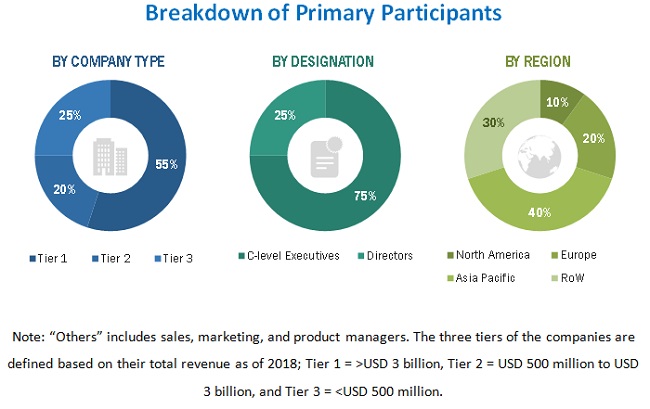
2.1.2.3 Breakdown of Primaries
2.2 Market Size Estimation
2.2.1 Bottom-Up Approach
2.2.2 Top-Down Approach
2.3 Market Breakdown and Data Triangulation
2.4 Research Assumptions
3 Executive Summary (Page No. - 29)
4 Premium Insights (Page No. - 32)
4.1 Attractive Opportunities in Quantum Cascade Laser (QCL) Market
4.2 QCL Market, By Operation Mode
4.3 QCL Market, By Packaging Type
4.4 APAC QCL Market, By End User and Country
4.5 QCL Market, By Region
5 Market Overview (Page No. - 35)
5.1 Introduction
5.2 Commercialization of Quantum Cascade Lasers
5.3 Market Dynamics
5.3.1 Drivers
5.3.1.1 Increasing Use of Quantum Cascade Lasers in Gas Sensing and Chemical Detection Applications
5.3.1.2 Growing Demand for Quantum Cascade Lasers in Healthcare Applications
5.3.2 Restraints
5.3.2.1 High Costs of QCL-Based Devices
5.3.3 Opportunities
5.3.3.1 Use of Quantum Cascade Lasers in Free-Space Optical Communication
5.3.3.2 Huge Potential for Use in Military Applications
5.3.3.3 Development of QCL-Based Devices Capable of Detecting Multiple Gases
5.3.3.4 Development of Terahertz Quantum Cascade Laser Technology
5.3.4 Challenges
5.3.4.1 Complexity of Circuitry and Requirement for Skilled Workforce
6 Industry Trends (Page No. - 41)
6.1 Introduction
6.2 Value Chain Analysis
6.3 Porters Five Forces Analysis
6.3.1 Intensity of Competitive Rivalry
6.3.2 Threat of Substitutes
6.3.3 Bargaining Power of Buyers
6.3.4 Bargaining Power of Suppliers
6.3.5 Threat of New Entrants
6.4 Use Cases
6.4.1 Standoff Detection of Chemical and Biological Threats
6.4.2 Precision Gas Detection and Measurement Using QCLBased Sensors
7 Quantum Cascade Laser Market, By Fabrication Technology (Page No. - 49)
7.1 Introduction
7.2 Fabry-Perot
7.2.1 Fabry-Perot QCLs Can Operate in Multi-Mode Light Broad Range at High Operating Current
7.3 Distributed Feedback
7.3.1 Distributed Feedback are Single-Mode QCLs and Can Operate in Both Continuous and Pulse Operation Modes
7.4 Tunable External Cavities
7.4.1 Tunable External Cavities QCLs have A High Spectral Tuning Range Than Distributed Feedback QCLs
8 Quantum Cascade Laser Market, By Operation Mode (Page No. - 67)
8.1 Introduction
8.2 Continuous Wave
8.2.1 Continuous Wave Operation Mode Provides Uninterrupted Laser Beam With Constant Amplitude and Frequency of the Wave
8.3 Pulsed
8.3.1 Pulsed Wave Operation Mode Consumes Les Power to Obtain Low Duty Cycle
9 Quantum Cascade Laser Market, By Packaging Type (Page No. - 72)
9.1 Introduction
9.2 C-Mount Package
9.2.1 C-Mount Packaging Type is Used for Devices That Operate in the Wavelength Range of 680980 Nanometers (NM).
9.3 HHL & VHL Package
9.3.1 HHL & VHL Packaging to Grow at A Significant Rate During Forecast Period Due to Increasing Adoption By Industrial End Users
9.4 To3 Package
9.4.1 To3 Packaging is Commonly Used By Silicon-Controlled Rectifiers (SCRS), Power Transistors, and High-Output Semiconductor Devices
10 Quantum Cascade Laser Market, By End User (Page No. - 84)
10.1 Introduction
10.2 Industrial
10.2.1 QCL-Based Analyzers are Deployed for Gas Sensing and Measurement Applications By Industrial End Users
10.3 Healthcare
10.3.1 QCL-Based Breath Analyzers are Widely Being Adopted Over the Traditional LeadSalt Diode-Based Breath Analyzers By Healthcare End Users
10.4 Telecommunication
10.4.1 QCL Technology is Maturing Gradually, Its Adoption in Free-Space Optical Communication is Expected to Increase in the Future
10.5 Military & Defense
10.5.1 Fabry-Perot QCLs, are Deployed in Military Applications Such as Infrared Countermeasures (IRCM) for Targeting and Detecting Explosives and Drugs
10.6 Others
10.6.1 QCLs Based Products Finds Its Application in Education and R&D Applications
11 Geographical Analysis (Page No. - 108)
11.1 Introduction
11.2 North America
11.2.1 Increasing Investment in R&D for Developing QCL Based Technology to Drive the Market
11.2.2 US
11.2.2.1 Key Factors Driving the US Market are the Deployment of Laser Weapons in Defense and Use of Laser in Healthcare Procedures
11.2.3 Canada
11.2.3.1 Increasing Focus on R&D to Drive the Canadian QCL Market During Forecast Period
11.2.4 Mexico
11.2.4.1 Increasing Adoption of QCL Based Products By Industrial End Users to Drive the Mexican Market
11.3 Europe
11.3.1 Regional Regulation Provide Competitive Edge to European QCL Manufacturer
11.3.2 UK
11.3.2.1 UK Government is Developing Energy-Efficient Devices and Low Carbon Emission Products Through Expansion of Laser Technology
11.3.3 Germany
11.3.3.1 Increasing Bandwidth Requirement in Mobile Telephone and Data Center Networks Fuels the Growth of the QCL Market in Germany
11.3.4 France
11.3.4.1 Increasing Adoption of Laser Technology in the Healthcare Vertical for Diagnosis and Therapy is Expected to Drive the Market During Forecast Period
11.3.5 Rest of Europe
11.3.5.1 Increasing Adoption of New Technologies for High-Speed Data Connectivity to Drive the Market in Rest of Europe
11.4 Asia Pacific (APAC)
11.4.1 High Military and Defense Expenditure By China and India to Boost the Demand for QCL Products
11.4.2 China
11.4.2.1 Adoption of QCLs in Applications Such as Gas Spectroscopy, Breathe Analyzers, and Free-Space Optical Communication is Expected to Grow During Forecast Period
11.4.3 Japan
11.4.3.1 Increasing Expenditure in R&D and Presence of Major QCLs Manufacturer are Expected to Drive the Japanese QCL Market
11.4.4 South Korea
11.4.4.1 South Korean QCL Market is Expected to Grow at Significant Rate During Forecast Period
11.4.5 India
11.4.5.1 Massive Deployment of Networks to Enable High-Speed Connectivity and Signal Availability in the Country to Propel QCL Technology
11.4.6 Rest of APAC
11.4.6.1 Advantages of Laser Technology in Terms of Design and Cost Expected to Boost Consumption of QCL-Based Products
11.5 RoW
11.5.1 Growing Demand for Gas Detection and Measurement Products in Oil & Gas Exploration to Drive the Market
11.5.2 Middle East & Africa
11.5.2.1 Increasing Threats of Biological and Chemical Warfare Threats in the Middle East Expected to Fillip the Demand for QCL Technology
11.5.3 South America
11.5.3.1 Increasing Demand for QCL for Gas Spectroscopy and Monitoring Applications to Drive the Market in South America
12 Competitive Landscape (Page No. - 130)
12.1 Introduction
12.2 Market Ranking Analysis, 2018
12.3 Competitive Leadership Mapping, 2018
12.3.1 Visionary Leaders
12.3.2 Dynamic Differentiators
12.3.3 Innovators
12.3.4 Emerging Companies
12.4 Business Strategy Excellence (For All 25 Players)
12.5 Strength of Product Portfolio (For All 25 Players)
12.6 Competitive Situations and Trends
12.6.1 Product Launches
12.6.2 Collaborations
12.6.3 Contracts
13 Company Profiles (Page No. - 139)
(Business overview, Products offered, Recent Developments, SWOT Analysis, MNM view)*
13.1 Introduction
13.2 Key Players
13.2.1 Block MEMS
13.2.2 Wavelength Electronics, Inc.
13.2.3 Hamamatsu Photonics K.K.
13.2.4 Thorlabs, Inc
13.2.5 Alpes Lasers SA
13.2.6 Mirsense
13.2.7 Pranalytica, Inc.
13.2.8 Akela Laser Corporation
13.2.9 Emerson Electric Corporation
13.2.10 Nanoplus Nanosystems and Technologies GmbH
*Details on Business overview, Products offered, Recent Developments, SWOT Analysis, MNM view might not be captured in case of unlisted companies.
13.3 Other Companies
13.3.1 Adtech Optics
13.3.2 DRS Daylight Solutions
13.3.3 Sacher Lasertechnik
13.3.4 Boston Electronics Corporation
13.3.5 Lasermax Inc.
13.3.6 Frankfurt Laser Company
13.3.7 Aerodyne Research Inc.
13.3.8 Physical Science Inc
13.3.9 Power Technology Inc.
13.3.10 Allied Scientific Pro LLC
14 Appendix (Page No. - 162)
14.1 Insights From Industry Experts
14.2 Discussion Guide
14.3 Knowledge Store: Marketsandmarkets Subscription Portal
14.4 Available Customizations
14.5 Related Reports
14.6 Author Details
List of Tables (114 Tables)
Table 1 Porters Five Forces Analysis: Intensity of Competitive Rivalry Had Medium Impact on Overall QCL Market in 2018
Table 2 QCL Market, By Fabrication Technology, 20162025 (USD Million)
Table 3 Fabry-Perot QCL Market, By Packaging Type, 20162025 (USD Million)
Table 4 Fabry-Perot QCL Market, By Operation Mode, 20162025 (USD Million)
Table 5 Fabry-Perot QCL Market, By End User, 20162025 (USD Thousand)
Table 6 Fabry-Perot QCL Market, By End User, 20162025 (Units)
Table 7 Fabry-Perot QCL Market, By Region, 20162025 (USD Thousand)
Table 8 Fabry-Perot QCL Market in North America, By Country, 20162025 (USD Thousand)
Table 9 Fabry-Perot QCL Market in By Europe, By Country, 20162025 (USD Thousand)
Table 10 Fabry-Perot QCL Market in APAC, By Country, 20162025 (USD Thousand)
Table 11 Fabry-Perot QCL Market in RoW, By Region, 20162025 (USD Thousand)
Table 12 Distributed Feedback QCL Market, By Packaging Type, 20162025 (USD Million)
Table 13 Distributed Feedback QCL Market, By Operation Mode, 20162025 (USD Million)
Table 14 Distributed Feedback QCL Market, By End User, 20162025 (USD Million)
Table 15 Distributed Feedback QCL Market, By End User, 20162025 (Units)
Table 16 Distributed Feedback QCL Market, By Region, 20162025 (USD Thousand)
Table 17 Distributed Feedback QCL Market in North America, By Country, 20162025 (USD Thousand)
Table 18 Distributed Feedback QCL Market in Europe, By Country, 20162025 (USD Thousand)
Table 19 Distributed Feedback QCL Market in APAC, By Country, 20162025 (USD Thousand)
Table 20 Distributed Feedback QCL Market in RoW, 20162025 (USD Thousand)
Table 21 Tunable External Cavities QCL Market, By Packaging Type, 20162025 (USD Million)
Table 22 Tunable External Cavities QCL Market, By Operation Mode, 20162025 (USD Million)
Table 23 Tunable External Cavities QCL Market, By End User, 20162025 (USD Thousand)
Table 24 Tunable External Cavities QCL Market, By End User, 20162025 (Units)
Table 25 Tunable External Cavities QCL Market, By Region, 20162025 (USD Million)
Table 26 Tunable External Cavities QCL Market in North America, By Country, 20162025 (USD Thousand)
Table 27 Tunable External Cavities QCL Market in Europe, By Country, 20162025 (USD Thousand)
Table 28 Tunable External Cavities QCL Market in APAC, By Country, 20162025 (USD Thousand)
Table 29 Tunable External Cavities QCL Market in RoW, By Region, 20162025 (USD Thousand)
Table 30 QCL Market, By Operation Mode, 20162025 (USD Million)
Table 31 Continuous Wave (CW) QCL Market, By Fabrication Technology, 20162025 (USD Million)
Table 32 Continuous Wave (CW) QCL Market, By Region, 20162025 (USD Million)
Table 33 Pulsed QCL Market, By Fabrication Technology, 20162025 (USD Million)
Table 34 Pulsed QCL Market, By Region, 20162025 (USD Million)
Table 35 QCL Market, By Packaging Type, 20162025 (USD Million)
Table 36 C-Mount Package QCL Market, By Fabrication Technology, 20162025 (USD Million)
Table 37 C-Mount Package QCL Market, By Region, 20162025 (USD Thousand)
Table 38 C-Mount Package QCL Market in North America, By Country, 20162025 (USD Thousand)
Table 39 C-Mount Package QCL Market in Europe, By Country, 20162025 (USD Thousand)
Table 40 C-Mount Package QCL Market in APAC, By Country, 20162025 (USD Thousand)
Table 41 C-Mount Package QCL Market in RoW, By Region, 20162025 (USD Thousand)
Table 42 HHL & VHL Package QCL Market, By Fabrication Technology, 20162025 (USD Million)
Table 43 HHL & VHL Package QCL Market, By Region, 20162025 (USD Thousand)
Table 44 HHL & VHL Package QCL Market in North America, By Country, 20162025 (USD Thousand)
Table 45 HHL & VHL Package QCL Market in Europe, By Country, 20162025 (USD Thousand)
Table 46 HHL & VHL Package QCL Market in APAC, By Country, 20162025 (USD Thousand)
Table 47 HHL & VHL Package QCL Market in RoW, By Region, 20162025 (USD Thousand)
Table 48 To3 Package QCL Market, By Fabrication Technology, 20162025 (USD Million)
Table 49 To3 Package QCL Market, By Region, 20162025 (USD Thousand)
Table 50 To3 Package QCL Market in North America, By Country, 20162025 (USD Thousand)
Table 51 To3 Package QCL Market in Europe, By Country, 20162025 (USD Thousand)
Table 52 To3 Package QCL Market in APAC, By Country, 20162025 (USD Thousand)
Table 53 To3 Package QCL Market in RoW, By Region, 20162025 (USD Thousand)
Table 54 QCL Market, By End User, 20162025 (USD Million)
Table 55 Industrial QCL Market, By Fabrication Technology, 20162025 (USD Thousand)
Table 56 Industrial QCL Market, By Fabrication Technology, 20162025 (Units)
Table 57 Industrial QCL Market, By Region, 20162025 (USD Thousand)
Table 58 North America Industrial QCL Market, By Country, 20162025 (USD Thousand)
Table 59 Europe Industrial QCL Market, By Country, 20162025 (USD Thousand)
Table 60 APAC Industrial QCL Market, By Country, 20162025 (USD Thousand)
Table 61 RoW Industrial QCL Market, By Region, 20162025 (USD Thousand)
Table 62 Healthcare QCL Market, By Fabrication Technology, 20162025 (USD Thousand)
Table 63 Healthcare QCL Market, By Fabrication Technology, 20162025 (Units)
Table 64 Healthcare QCL Market, By Region, 20162025 (USD Thousand)
Table 65 North America Healthcare QCL Market, By Country, 20162025 (USD Thousand)
Table 66 Europe Healthcare QCL Market, By Country, 20162025 (USD Thousand)
Table 67 APAC Healthcare QCL Market, By Country, 20162025 (USD Thousand)
Table 68 RoW Healthcare QCL Market, By Region, 20162025 (USD Thousand)
Table 69 Telecommunication QCL Market, By Fabrication Technology, 20162025 (USD Thousand)
Table 70 Telecommunication QCL Market, By Fabrication Technology, 20162025 (Units)
Table 71 Telecommunication QCL Market, By Region, 20162025 (USD Thousand)
Table 72 North America Telecommunication QCL Market, By Country, 20162025 (USD Thousand)
Table 73 Europe Telecommunication QCL Market, By Country, 20162025 (USD Thousand)
Table 74 APAC Telecommunication QCL Market, By Country, 20162025 (USD Thousand)
Table 75 RoW Telecommunication QCL Market, By Region, 20162025 (USD Thousand)
Table 76 Military & Defense QCL Market, By Fabrication Technology, 20162025 (USD Thousand)
Table 77 Military & Defense QCL Market, By Fabrication Technology, 20162025 (Units)
Table 78 Military & Defense QCL Market, By Region, 20162025 (USD Thousand)
Table 79 North America Military & Defense QCL Market, By Country, 20162025 (USD Thousand)
Table 80 Europe Military & Defense QCL Market, By Country, 20162025 (USD Thousand)
Table 81 APAC Military & Defense QCL Market, By Country, 20162025 (USD Thousand)
Table 82 RoW Military & Defense QCL Market, By Country, 20162025 (USD Thousand)
Table 83 Others QCL Market, By Fabrication Technology, 20162025 (USD Thousand)
Table 84 Others QCL Market, By Fabrication Technology, 20162025 (Units)
Table 85 Others QCL Market, By Region, 20162025 (USD Thousand)
Table 86 North America Others QCL Market, By Country, 20162025 (USD Thousand)
Table 87 Europe Others QCL Market, By Country, 20162025 (USD Thousand)
Table 88 APAC Others QCL Market, By Country, 20162025 (USD Thousand)
Table 89 RoW Others QCL Market, By Region, 20162025 (USD Thousand)
Table 90 QCL Market, By Region, 20162025 (USD Million)
Table 91 North America QCL Market, By End User, 20162025 (USD Thousand)
Table 92 North America QCL Market, By Country, 20162025 (USD Thousand)
Table 93 North America QCL Market, By Operation Mode, 20162025 (USD Thousand)
Table 94 North America QCL Market, By Packaging Type, 20162025 (USD Thousand)
Table 95 North America QCL Market, By Fabrication Technology, 20162025 (USD Thousand)
Table 96 Europe QCL Market, By End User, 20162025 (USD Thousand)
Table 97 Europe QCL Market, By Country, 20162025 (USD Thousand)
Table 98 Europe QCL Market, By Operation Mode, 20162025 (USD Thousand)
Table 99 Europe QCL Market, By Packaging Type, 20162025 (USD Thousand)
Table 100 Europe QCL Market, By Fabrication Technology, 20162025 (USD Thousand)
Table 101 APAC QCL Market, By End User, 20162025 (USD Thousand)
Table 102 APAC QCL Market, By Country, 20162025 (USD Thousand)
Table 103 APAC QCL Market, By Operation Mode, 20162025 (USD Thousand)
Table 104 APAC QCL Market, By Packaging, 20162025 (USD Thousand)
Table 105 APAC QCL Market, By Fabrication Technology, 20162025 (USD Thousand)
Table 106 RoW QCL Market, By End User, 20162025 (USD Thousand)
Table 107 RoW QCL Market, By Region, 20162025 (USD Thousand)
Table 108 RoW QCL Market, By Operation Mode, 20162025 (USD Thousand)
Table 109 RoW QCL Market, By Packaging Type, 20162025 (USD Thousand)
Table 110 RoW QCL Market, By Fabrication Technology, 20162025 (USD Thousand)
Table 111 Product Launches, 20162018
Table 112 Expansions, 20162018
Table 113 Collaborations, 20162018
Table 114 Contracts, 20162018
List of Figures (54 Figures)
Figure 1 Market Segmentation
Figure 2 QCL Market: Research Design
Figure 3 Market Size Estimation Methodology: Bottom-Up Approach
Figure 4 Market Size Estimation Methodology: Top-Down Approach
Figure 5 Data Triangulation
Figure 6 Assumptions for the Research Study
Figure 7 Distributed Feedback Segment is Projected to Lead QCL Market From 2019 to 2025
Figure 8 Industrial End User Segment Accounted for the Largest Share of QCL Market in 2018
Figure 9 North America Accounted for the Largest Share of QCL Market in 2018 in Terms of Value
Figure 10 Increasing Use of Quantum Cascade Lasers in Gas Sensing and Chemical Detection Applications is Fueling Growth of QCL Market
Figure 11 Continuous Wave Segment is Projected to Lead QCL Market From 2019 to 2025
Figure 12 C-Mount Package Segment Accounted for the Largest Share of QCL Market in 2018
Figure 13 Industrial Segment and China are Estimated to Account for the Largest Shares of APAC QCL Market in 2019
Figure 14 North America Accounted for the Largest Share of QCL Market in 2018
Figure 15 Commercialization of Quantum Cascade Lasers
Figure 16 Market Growth Projections Considering Drivers
Figure 17 Market Growth Projections Considering Opportunities
Figure 18 Market Growth Projections Considering Challeneges, and Restraints
Figure 19 Increasing Use of Quantum Cascade Lasers in Gas Sensing and Chemical Detection Applications Fuels Growth of QCL Market
Figure 20 Value Chain Analysis of QCL Market, 2018
Figure 21 Porters Five Forces Analysis
Figure 22 QCL Market: Porters Five Forces Analysis
Figure 23 Medium Impact of Intensity of Competitive Rivalry on QCL Market Due to Moderate Competition Among Existing Players
Figure 24 Low Impact of Threat of Substitutes on QCL Market Due to Lack of Substitutes in Mid-Infrared Wavelength
Figure 25 Low Impact of Bargaining Power of Buyers on QCL Market Due to Low Switching Costs of Buyers
Figure 26 Medium Impact of Bargaining Power of Suppliers on QCL Market Due to High Switching Costs of Suppliers
Figure 27 Low Impact of Threat of New Entrants on QCL Market Due to Presence of Established Players
Figure 28 QCL Market, By Fabrication Technology
Figure 29 QCL Market for Fabry-Perot Technology to Grow at Highest CAGR During Forecast Period
Figure 30 Military & Defense End User Holds Largest Share of Fabry-Perot QCL Market
Figure 31 DFB QCL Market is Being Driven By Industrial Segment
Figure 32 Tunable External Cavities QCL Market for Telecommunication End User Segment to Grow at Highest CAGR During Forecast Period
Figure 33 Quantum Cascade Lasers Market, By Operation Mode
Figure 34 Continuous Wave Segment to Hold Largest Share of QCL Market Till 2025
Figure 35 QCL Market, By Packaging Type
Figure 36 C-Mount Fabry-Perot QCL Market Expected to Grow at Highest Rate During Forecast Period
Figure 37 QCL Market, By End User
Figure 38 Industrial End User to Hold Largest Market Share During Forecast Period
Figure 39 China to Hold Largest Share of QCL Market for Industrial Segment in APAC
Figure 40 Shipment for Fabry-Perot QCLs to Grow at Highest CAGR During Forecast
Figure 41 Military and Defense QCL Market, By Fabrication Technology, 2019 & 2025 (USD Thousand)
Figure 42 China to Hold Largest Share of Military & Defense QCL Market in APAC During Forecast Period
Figure 43 Adoption of QCLs in Technologically Advancing Countries Such as China and India is Driving QCL Market
Figure 44 QCL Market in APAC to Grow at Highest CAGR From 2019 to 2025
Figure 45 North America QCL Market Snapshot
Figure 46 Europe QCL Market Snapshot
Figure 47 Asia Pacific QCL Market Snapshot
Figure 48 RoW QCL Market Snapshot
Figure 49 Players in QCL Market Adopted Product Launches as Key Growth Strategy From 2016 to 2018
Figure 50 Ranking of Key Players in QCL Market, 2018
Figure 51 QCL Market (Global) Competitive Leadership Mapping, 2018
Figure 52 Battle for Market Share: New Product Launches Was the Key Strategy Adopted By the Players Between 2016 to 2018
Figure 53 Hamamatsu Photonics K.K.: Company Snapshot
Figure 54 Emerson Electric Corporation: Company Snapshot
The study involved four major activities in estimating the current size of the QCL market. Exhaustive secondary research has been done to collect information about the market, the peer markets, and the parent market. Validating findings, assumptions, and sizing with industry experts across the value chain through primary research has been the next step. Both, top-down and bottom-up approaches have been employed to estimate the complete market size. After that, market breakdown and data triangulation methods have been used to estimate the market size of segments and subsegments.
Secondary Research
In the secondary research process, various secondary sources have been referred to for identifying and collecting information pertinent to this study. Secondary sources include annual reports; press releases; investor presentations; white papers; journals and certified publications; and articles from recognized authors, directories, and databases. Secondary research has been conducted to obtain important information about the industrys supply chain, value chain, total pool of key players, market segmentation according to the industry trends (to the bottommost level), geographic markets, and key developments from both market- and technology-oriented perspectives.
Primary Research
Extensive primary research has been conducted after gaining knowledge about the QCL market scenario through secondary research. Several primary interviews have been conducted with market experts from both demand (commercial application providers) and supply (equipment manufacturers and distributors) sides across four major regions: North America, Europe, APAC, and RoW. Approximately 20% and 80% of primary interviews have been conducted with parties from demand and supply sides, respectively. The primary data has been collected through questionnaires, emails, and telephonic interviews.
To know about the assumptions considered for the study, download the pdf brochure
Market Size Estimation
In the complete engineering process, both top-down and bottom-up approaches, along with several data triangulation methods, have been used to estimate and validate the size of the QCL market and other dependent submarkets. The key players in the market have been determined through primary and secondary research. This entire research methodology involves the study of the annual and financial reports of the top market players and extensive interviews with industry experts such as CEOs, VPs, directors, and marketing executives for key insights (both qualitative and quantitative) into the QCL market.
Data Triangulation
All the percentage shares, splits, and breakdowns have been determined using secondary sources and verified through primary sources. All the possible parameters that affect the markets covered in this research study have been accounted for, viewed in extensive detail, verified through primary research, and analyzed to get the final quantitative and qualitative data. This data has been consolidated and supplemented with detailed inputs and analysis from MarketsandMarkets and presented in the report.
Report Objectives
- To define, describe, and forecast the QCL market, in terms of value and volume, based on fabrication technology, operation mode, packaging type, and end user
- To forecast the size of the market, in terms of value and volume, for various segments with respect to 4 main regions, namely, North America, Europe, Asia Pacific (APAC), and the Rest of the World (RoW)
- To provide detailed information regarding major factors, such as drivers, restraints, opportunities, and challenges, influencing the growth of the market
- To provide Porters five forces analysis along with the technology and market roadmaps for the QCL market
- To strategically analyze the micromarkets1 with respect to individual growth trends, prospects, and contributions to the total market
- To analyze opportunities in the market for stakeholders and provide a detailed competitive landscape for the market players
- To strategically profile the key players and comprehensively analyze their market ranking and core competencies2
- To map the competitive intelligence based on the company profiles, strategies adopted by key players, and developments such as product launches, collaborations, partnerships, joint ventures, and contracts undertaken by them
Available Customizations
With the given market data, MarketsandMarkets offers customizations according to the companys specific needs. The following customization options are available for the report:
Product Analysis
- Product matrix that gives a detailed comparison of the product portfolio of each company
Company Information
- Detailed analysis and profiling of additional market players (up to 5)


Growth opportunities and latent adjacency in Quantum Cascade Laser Market