Small-Scale LNG Market by Type (Liquefaction, Regasification), Application (Heavy-Duty Vehicles, Industrial & Power, Marine Transport), Region (North America, Europe, Asia Pacific, Middle East & Africa, and South America) - Global Forecast to 2028


Updated on : March 23, 2023
Get the updated report with forecasts to 2028 : Inquire Now
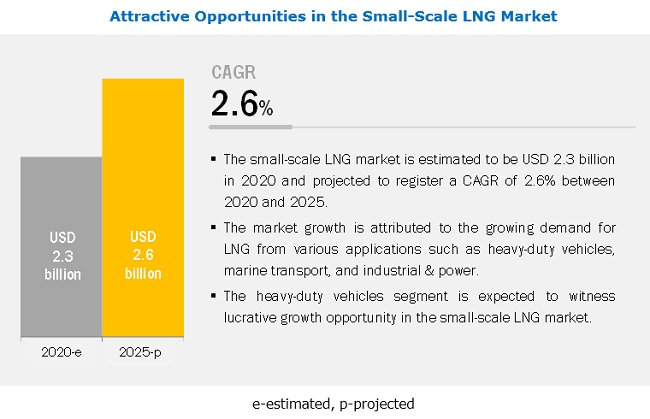
The small-scale LNG Market was valued at USD 2.3 billion in 2020 and is projected to reach USD 2.6 billion by 2025, growing at a cagr 2.6% from 2020 to 2025. The demand for small-scale LNG is driven mainly by growing demand for small-scale LNG in various end-use applications such as heavy-duty vehicles, marine transport, and industrial & power.
Based on type, the liquefaction segment is expected to be the most significant contributor in the small-scale LNG market during the forecast period.
Based on type, the liquefaction segment is estimated to account for the higher market share during the forecast period. The growth in this segment is attributed to the increasing export of LNG, which requires liquefaction before it can be transported from one port to another. Furthermore, the growing number of liquefaction terminals across the globe is driven by the increase in the demand for LNG. The factors mentioned above are expected to drive demand during the forecast period.
By application, the heavy-duty vehicles segment is expected to be the most significant contributor in the small-scale LNG market during the forecast period.
Based on the application, the heavy-duty vehicles segment is expected to account for the largest share of the market in 2020. The growth in this segment is attributed to the increasing use of LNG as fuel in heavy-duty vehicles, especially in China and European countries. LNG is the most viable option for long-haul LNG-fueled trucks globally. In heavy-duty vehicles, the density of LNG can vary considerably over a range of saturation pressures and storage temperatures. The LNG vehicle fuel system delivers natural gas to the engine at a required supply pressure while maximizing the fuel density at vehicle tanks and fueling stations. These factors are expected to drive demand during the forecast period.
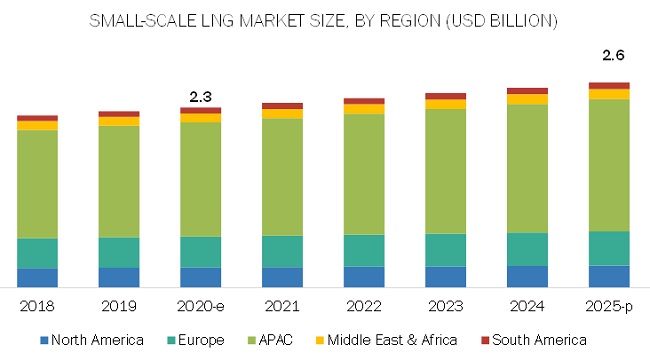
APAC is expected to be the largest market during the forecast period
APAC is the largest and fastest-growing small-scale LNG market, owing to its increasing usage in various end-use applications, such as heavy-duty vehicles and industrial & power. The increase in demand is because of the growing population, rising disposable income, and economic growth in China, South Korea, and Taiwan. These factors are expected to fuel the demand for small-scale LNG in the region during the forecast period.
Key Market Players
The major vendors in the small-scale LNG market include The Linde Group (Germany), Wartsila Corporation (Finland), Honeywell International Inc. (US), General Electric (US), Engie (France), and Gazprom (Russia).
Get online access to the report on the World's First Market Intelligence Cloud
- Easy to Download Historical Data & Forecast Numbers
- Company Analysis Dashboard for high growth potential opportunities
- Research Analyst Access for customization & queries
- Competitor Analysis with Interactive dashboard
- Latest News, Updates & Trend analysis
Request Sample Scope of the Report
:
Get online access to the report on the World's First Market Intelligence Cloud
- Easy to Download Historical Data & Forecast Numbers
- Company Analysis Dashboard for high growth potential opportunities
- Research Analyst Access for customization & queries
- Competitor Analysis with Interactive dashboard
- Latest News, Updates & Trend analysis

|
Report Metric |
Details |
|
Years considered |
2018–2025 |
|
Base year considered |
2019 |
|
Forecast period |
2020–2025 |
|
Unit considered |
Value (USD million), volume (MTPA) |
|
Segments covered |
Application, type, and region |
|
Regions covered |
, Europe, South America, and Middle East & Africa |
|
Companies covered |
The Linde Group (Germany), Wartsila Corporation (Finland), Honeywell International Inc. (US), General Electric (US), Engie (France), and Gazprom (Russia). A total of 20 major players were covered. |
This research report categorizes the small-scale LNG market based on type, application, and region.
By Type
- Liquefaction
- Regasification
By Application:
- Heavy-duty vehicles
- Industrial & power
- Marine transport
- Others (mining activities and rail engines)
By Region:
- Asia Pacific (APAC)
- North America
- Europe
- Middle East & Africa
- South America
Recent Developments
- In September 2018, Honeywell announced the acquisition of Ortloff Engineers, Ltd., a privately held licensor and industry-leading developer of specialized technologies that drives high returns in natural gas processing and sulfur recovery.
- In February 2018, The Linde Group built a new LNG storage plant in Russia, Linde. The Engineering Division built related full-containment LNG storage tanks in record speed.
- In February 2017, Wartsila acquired Trident BV, a Netherlands-based company specialized in underwater ship maintenance, inspection, and repair services. The acquisition enables Wartsila to become a leading global operator in the underwater services market.
Key questions addressed by the report
- Which are the future revenue pockets in the small-scale LNG market?
- Which key developments are expected to have a high impact on the market?
- Which products/technologies are expected to overpower the existing technologies?
- How the regulatory scenario further is expected to impact the market?
- What will be the future product mix in the small-scale LNG market?
- What are the prime strategies of leaders in the market?
To speak to our analyst for a discussion on the above findings, click Speak to Analyst
TABLE OF CONTENTS
1 INTRODUCTION (Page No. - 16)
1.1 OBJECTIVES OF THE STUDY
1.2 MARKET DEFINITION
1.3 MARKET SCOPE
1.3.1 MARKET SEGMENTATION
1.3.2 REGIONS COVERED
1.3.3 YEARS CONSIDERED FOR THE STUDY
1.4 CURRENCY
1.5 UNIT CONSIDERED
1.6 LIMITATIONS
1.7 STAKEHOLDERS
1.8 SUMMARY OF CHANGES
2 RESEARCH METHODOLOGY (Page No. - 20)
2.1 RESEARCH DATA
2.1.1 SECONDARY DATA
2.1.1.1 Key data from secondary sources
2.1.2 PRIMARY DATA
2.1.2.1 Key data from primary sources
2.1.2.2 Breakdown of primary interviews
2.2 BASE NUMBER CALCULATION
2.2.1 DEMAND-SIDE APPROACH
2.2.2 DEMAND-SIDE APPROACH-2
2.3 MARKET SIZE ESTIMATION
2.3.1 BOTTOM-UP APPROACH
2.3.2 TOP-DOWN APPROACH
2.4 DATA TRIANGULATION
2.5 ASSUMPTIONS
3 EXECUTIVE SUMMARY (Page No. - 26)
4 PREMIUM INSIGHTS (Page No. - 29)
4.1 ATTRACTIVE OPPORTUNITIES IN THE SMALL-SCALE LNG MARKET
4.2 SMALL-SCALE LNG MARKET, BY REGION
4.3 SMALL-SCALE LNG MARKET IN APAC BY COUNTRY AND APPLICATION
4.4 SMALL-SCALE LNG MARKET: MAJOR COUNTRIES
5 MARKET OVERVIEW (Page No. - 31)
5.1 INTRODUCTION
5.2 MARKET DYNAMICS
5.2.1 DRIVERS
5.2.1.1 Energy cost advantage of LNG
5.2.1.2 Environmental benefits
5.2.1.3 Fiscal regime and subsidies
5.2.2 RESTRAINTS
5.2.2.1 Limited LNG receiving terminal infrastructure in APAC
5.2.3 OPPORTUNITIES
5.2.3.1 Integration of new technology
5.2.4 CHALLENGES
5.2.4.1 Expensive supply chain
5.3 SMALL-SCALE LNG VALUE CHAIN
5.4 PORTER’S FIVE FORCES ANALYSIS
5.4.1 BARGAINING POWER OF SUPPLIERS
5.4.2 THREAT OF NEW ENTRANTS
5.4.3 THREAT OF SUBSTITUTES
5.4.4 BARGAINING POWER OF BUYERS
5.4.5 INTENSITY OF COMPETITIVE RIVALRY
5.4.6 IMPACT OF COVID-19 ON SUPPLY CHAIN
5.5 MACROECONOMIC INDICATORS
5.5.1 GLOBAL LNG INDUSTRY OUTLOOK
5.5.1.1 LNG exports
5.5.1.2 LNG imports
6 SMALL-SCALE LNG MARKET, BY TYPE (Page No. - 39)
6.1 INTRODUCTION
6.2 LIQUEFACTION
6.2.1 HIGH DEMAND FOR LOCAL PRODUCTION OF LNG
6.3 REGASIFICATION
6.3.1 GROWING DEMAND FOR LNG IN APAC
7 SMALL-SCALE LNG MARKET, BY APPLICATION (Page No. - 44)
7.1 INTRODUCTION
7.2 HEAVY-DUTY VEHICLES
7.2.1 COST-SAVING BENEFITS OF LNG IN HEAVY-DUTY TRUCKS
7.3 MARINE TRANSPORT
7.3.1 ENVIRONMENTAL REGULATIONS FOR EMISSION CONTROL AREAS (ECA)
7.4 INDUSTRIAL & POWER
7.4.1 INCREASING DEMAND FOR NATURAL GAS IN ELECTRICITY GENERATION
7.5 OTHERS
8 SMALL-SCALE LNG MARKET, BY REGION (Page No. - 52)
8.1 INTRODUCTION
8.2 NORTH AMERICA
8.2.1 US
8.2.1.1 Emergence of shale gas to boost the market
8.2.2 CANADA
8.2.2.1 Growing heavy-duty transport facilities
8.2.3 MEXICO
8.2.3.1 Rapid growth of industrial & power industry
8.3 APAC
8.3.1 CHINA
8.3.1.1 Growth in transport industry
8.3.2 JAPAN
8.3.2.1 Demand for regasification and increasing import of small-scale LNG
8.3.3 INDIA
8.3.3.1 Growing imports of LNG and investment in power sector
8.3.4 SOUTH KOREA
8.3.4.1 Largest importer of LNG globally
8.3.5 TAIWAN
8.3.5.1 Construction of receiving LNG terminals
8.3.6 SINGAPORE
8.3.6.1 Increasing demand from end-use applications
8.3.7 REST OF APAC
8.4 EUROPE
8.4.1 GERMANY
8.4.1.1 Growing transportation through ships and trucks
8.4.2 UK
8.4.2.1 Increasing demand for bunkering facilities
8.4.3 FRANCE
8.4.3.1 Growing number of LNG import terminals
8.4.4 ITALY
8.4.4.1 Government regulations boosting market growth
8.4.5 SPAIN
8.4.5.1 Increasing demand for maritime fuels
8.4.6 PORTUGAL
8.4.6.1 Rising demand from end-use applications
8.4.7 RUSSIA
8.4.7.1 Growth in export business driving the market
8.4.8 NETHERLANDS
8.4.8.1 Increasing usage of LNG in heavy-duty vehicles
8.4.9 NORWAY
8.4.9.1 Growing trade of LNG in the country to drive the market
8.4.10 TURKEY
8.4.10.1 Growth in regasification storage
8.4.11 REST OF EUROPE
8.5 MIDDLE EAST & AFRICA
8.5.1 UAE
8.5.1.1 High demand for LNG in the marine transportation application
8.5.2 ISRAEL
8.5.2.1 Increase in gas consumption to drive the market
8.5.3 QATAR
8.5.3.1 Growth in marine transportation boosting market growth
8.5.4 KUWAIT
8.5.4.1 Upcoming regasification facilities
8.5.5 EGYPT
8.5.5.1 Potential growth in industrial & power application
8.5.6 REST OF MIDDLE EAST & AFRICA
8.6 SOUTH AMERICA
8.6.1 BRAZIL
8.6.1.1 Improved economy to drive the market
8.6.2 ARGENTINA
8.6.2.1 Increased investment in LNG terminal infrastructure
8.6.3 CHILE
8.6.3.1 Increased demand for small-scale LNG in end-use applications
8.6.4 COLOMBIA
8.6.4.1 Growing LNG import and investment in terminal infrastructure
8.6.5 REST OF SOUTH AMERICA
9 COMPETITIVE LANDSCAPE (Page No. - 97)
9.1 OVERVIEW
9.2 MARKET RANKING OF KEY PLAYERS
9.3 COMPETITIVE SCENARIO
9.3.1 EXPANSION
9.3.2 MERGER & ACQUISITION
9.3.3 AGREEMENT & JOINT VENTURE
10 COMPANY PROFILES (Page No. - 102)
10.1 THE LINDE GROUP
(Business Overview, Products Offered, Recent Developments, SWOT Analysis, Winning Imperatives, Current Focus and Strategies, Threat from Competition, and Right to Win)*
10.2 WARTSILA CORPORATION
10.3 HONEYWELL INTERNATIONAL INC.
10.4 GENERAL ELECTRIC
10.5 ENGIE
10.6 GAZPROM
10.7 GASUM OY
10.8 SOFREGAZ
10.9 DRESSER-RAND
10.10 PROMETHEUS ENERGY
10.11 OTHER COMPANY PROFILES
10.11.1 PLUM ENERGY
10.11.2 EXCELERATE ENERGY L.P.
10.11.3 CRYOSTAR SAS
10.11.4 IHI CORPORATION
10.11.5 NOVATEK
*Details on Business Overview, Products Offered, Recent Developments, SWOT Analysis, Winning Imperatives, Current Focus and Strategies, Threat from Competition, and Right to Win might not be captured in case of unlisted companies.
11 APPENDIX (Page No. - 128)
11.1 DISCUSSION GUIDE
11.2 KNOWLEDGE STORE: MARKETSANDMARKETS’ SUBSCRIPTION PORTAL
11.3 AVAILABLE CUSTOMIZATIONS
11.4 RELATED REPORTS
11.5 AUTHOR DETAILS
LIST OF TABLES (115 TABLES)
TABLE 1 SMALL-SCALE LNG MARKET SIZE, BY TYPE, 2018–2025 (USD MILLION)
TABLE 2 SMALL-SCALE LNG MARKET SIZE, BY TYPE, 2018–2025 (MTPA)
TABLE 3 LIQUEFACTION MARKET SIZE, BY REGION, 2018–2025 (USD MILLION)
TABLE 4 LIQUEFACTION MARKET SIZE, BY REGION, 2018–2025 (MTPA)
TABLE 5 REGASIFICATION MARKET SIZE, BY REGION, 2018–2025 (USD MILLION)
TABLE 6 REGASIFICATION MARKET SIZE, BY REGION, 2018–2025 (MTPA)
TABLE 7 SMALL-SCALE LNG MARKET SIZE, BY APPLICATION, 2018—2025 (USD MILLION)
TABLE 8 SMALL-SCALE LNG MARKET SIZE, BY APPLICATION, 2018—2025 (MTPA)
TABLE 9 SMALL-SCALE LNG MARKET SIZE IN HEAVY-DUTY VEHICLES, BY REGION, 2018—2025 (USD MILLION)
TABLE 10 SMALL-SCALE LNG MARKET SIZE IN HEAVY-DUTY VEHICLES, BY REGION, 2018—2025 (MTPA)
TABLE 11 SMALL-SCALE LNG MARKET SIZE IN MARINE TRANSPORT, BY REGION, 2018—2025 (USD MILLION)
TABLE 12 SMALL-SCALE LNG MARKET SIZE IN MARINE TRANSPORT, BY REGION, 2018—2025 (MTPA)
TABLE 13 SMALL-SCALE LNG MARKET SIZE IN INDUSTRIAL & POWER, BY REGION, 2018—2025 (USD MILLION)
TABLE 14 SMALL-SCALE LNG MARKET SIZE IN INDUSTRIAL & POWER, BY REGION, 2018—2025 (MTPA)
TABLE 15 SMALL-SCALE LNG MARKET SIZE IN OTHER APPLICATIONS, BY REGION, 2018—2025 (USD MILLION)
TABLE 16 SMALL-SCALE LNG MARKET SIZE IN OTHER APPLICATIONS, BY REGION, 2018—2025 (MTPA)
TABLE 17 SMALL-SCALE LNG MARKET SIZE, BY REGION, 2018–2025 (USD MILLION)
TABLE 18 SMALL-SCALE LNG MARKET SIZE, BY REGION, 2018–2025 (MTPA)
TABLE 19 NORTH AMERICA: SMALL-SCALE LNG MARKET SIZE, BY COUNTRY, 2018–2025 (USD MILLION)
TABLE 20 NORTH AMERICA: SMALL-SCALE LNG MARKET SIZE, BY COUNTRY, 2018–2025 (MTPA)
TABLE 21 NORTH AMERICA: SMALL-SCALE LNG MARKET SIZE, BY TYPE, 2018–2025 (USD MILLION)
TABLE 22 NORTH AMERICA: SMALL-SCALE LNG MARKET SIZE, BY TYPE, 2018–2025 (MTPA)
TABLE 23 NORTH AMERICA: SMALL-SCALE LNG MARKET SIZE, BY APPLICATION, 2018–2025 (USD MILLION)
TABLE 24 NORTH AMERICA: SMALL-SCALE LNG MARKET SIZE, BY APPLICATION, 2018–2025 (MTPA)
TABLE 25 US: SMALL-SCALE LNG MARKET SIZE, BY APPLICATION, 2018–2025 (USD MILLION)
TABLE 26 US: SMALL-SCALE LNG MARKET SIZE, BY APPLICATION, 2018–2025 (MTPA)
TABLE 27 CANADA: SMALL-SCALE LNG MARKET SIZE, BY APPLICATION, 2018–2025 (USD MILLION)
TABLE 28 CANADA: SMALL-SCALE LNG MARKET SIZE, BY APPLICATION, 2018–2025 (MTPA)
TABLE 29 MEXICO: SMALL-SCALE LNG MARKET SIZE, BY APPLICATION, 2018–2025 (USD MILLION)
TABLE 30 MEXICO: SMALL-SCALE LNG MARKET SIZE, BY APPLICATION, 2018–2025 (MTPA)
TABLE 31 APAC: SMALL-SCALE LNG MARKET SIZE, BY COUNTRY, 2018–2025 (USD MILLION)
TABLE 32 APAC: SMALL-SCALE LNG MARKET SIZE, BY COUNTRY, 2018–2025 (MTPA)
TABLE 33 APAC: SMALL-SCALE LNG MARKET SIZE, BY TYPE, 2018–2025 (USD MILLION)
TABLE 34 APAC: SMALL-SCALE LNG MARKET SIZE, BY TYPE, 2018–2025 (MTPA)
TABLE 35 APAC: SMALL-SCALE LNG MARKET SIZE, BY APPLICATION, 2018–2025 (USD MILLION)
TABLE 36 APAC: SMALL-SCALE LNG MARKET SIZE, BY APPLICATION, 2018–2025 (MTPA)
TABLE 37 CHINA: SMALL-SCALE LNG MARKET SIZE, BY APPLICATION, 2018–2025 (USD MILLION)
TABLE 38 CHINA: SMALL-SCALE LNG MARKET SIZE, BY APPLICATION, 2018–2025 (MTPA)
TABLE 39 JAPAN: SMALL-SCALE LNG MARKET SIZE, BY APPLICATION, 2018–2025 (USD MILLION)
TABLE 40 JAPAN: SMALL-SCALE LNG MARKET SIZE, BY TYPE, 2018–2025 (MTPA)
TABLE 41 INDIA: SMALL-SCALE LNG MARKET SIZE, BY APPLICATION, 2018–2025 (USD MILLION)
TABLE 42 INDIA: SMALL-SCALE LNG MARKET SIZE, BY APPLICATION, 2018–2025 (MTPA)
TABLE 43 SOUTH KOREA: SMALL-SCALE LNG MARKET SIZE, BY APPLICATION, 2018–2025 (USD MILLION)
TABLE 44 SOUTH KOREA: SMALL-SCALE LNG MARKET SIZE, BY APPLICATION, 2018–2025 (MTPA)
TABLE 45 TAIWAN: SMALL-SCALE LNG MARKET SIZE, BY APPLICATION, 2018–2025 (USD MILLION)
TABLE 46 TAIWAN: SMALL-SCALE LNG MARKET SIZE, BY APPLICATION, 2018–2025 (MTPA)
TABLE 47 SINGAPORE: SMALL-SCALE LNG MARKET SIZE, BY APPLICATION, 2018–2025 (USD MILLION)
TABLE 48 SINGAPORE: SMALL-SCALE LNG MARKET SIZE, BY APPLICATION, 2018–2025 (MTPA)
TABLE 49 REST OF APAC: SMALL-SCALE LNG MARKET SIZE, BY APPLICATION, 2018–2025 (USD MILLION)
TABLE 50 REST OF APAC: SMALL-SCALE LNG MARKET SIZE, BY APPLICATION, 2018–2025 (MTPA)
TABLE 51 EUROPE: SMALL-SCALE LNG MARKET SIZE, BY COUNTRY, 2018–2025 (USD MILLION)
TABLE 52 EUROPE: SMALL-SCALE LNG MARKET SIZE, BY COUNTRY, 2018–2025 (MTPA)
TABLE 53 EUROPE: SMALL-SCALE LNG MARKET SIZE, BY TYPE, 2018–2025 (USD MILLION)
TABLE 54 EUROPE: SMALL-SCALE LNG MARKET SIZE, BY TYPE, 2018–2025 (MTPA)
TABLE 55 EUROPE: SMALL-SCALE LNG MARKET SIZE, BY APPLICATION, 2018–2025 (USD MILLION)
TABLE 56 EUROPE: SMALL-SCALE LNG MARKET SIZE, BY APPLICATION, 2018–2025 (MTPA)
TABLE 57 GERMANY: SMALL-SCALE LNG MARKET SIZE, BY APPLICATION, 2018–2025 (USD MILLION)
TABLE 58 GERMANY: SMALL-SCALE LNG MARKET SIZE, BY APPLICATION, 2018–2025 (MTPA)
TABLE 59 UK: SMALL-SCALE LNG MARKET SIZE, BY APPLICATION, 2018–2025 (USD MILLION)
TABLE 60 UK: SMALL-SCALE LNG MARKET SIZE, BY APPLICATION, 2018–2025 (MTPA)
TABLE 61 FRANCE: SMALL-SCALE LNG MARKET SIZE, BY APPLICATION, 2018–2025 (USD MILLION)
TABLE 62 FRANCE: SMALL-SCALE LNG MARKET SIZE, BY APPLICATION, 2018–2025 (MTPA)
TABLE 63 ITALY: SMALL-SCALE LNG MARKET SIZE, BY APPLICATION, 2018–2025 (USD MILLION)
TABLE 64 ITALY: SMALL-SCALE LNG MARKET SIZE, BY APPLICATION, 2018–2025 (MTPA)
TABLE 65 SPAIN: SMALL-SCALE LNG MARKET SIZE, BY APPLICATION, 2018–2025 (USD MILLION)
TABLE 66 SPAIN: SMALL-SCALE LNG MARKET SIZE, BY APPLICATION, 2018–2025 (MTPA)
TABLE 67 PORTUGAL: SMALL-SCALE LNG MARKET SIZE, BY APPLICATION, 2018–2025 (USD MILLION)
TABLE 68 PORTUGAL: SMALL-SCALE LNG MARKET SIZE, BY APPLICATION, 2018–2025 (MTPA)
TABLE 69 RUSSIA: SMALL-SCALE LNG MARKET SIZE, BY APPLICATION, 2018–2025 (USD MILLION)
TABLE 70 RUSSIA: SMALL-SCALE LNG MARKET SIZE, BY APPLICATION, 2018–2025 (MTPA)
TABLE 71 NETHERLANDS: SMALL-SCALE LNG MARKET SIZE, BY APPLICATION, 2018–2025 (USD MILLION)
TABLE 72 NETHERLANDS: SMALL-SCALE LNG MARKET SIZE, BY APPLICATION, 2018–2025 (MTPA)
TABLE 73 NORWAY: SMALL-SCALE LNG MARKET SIZE, BY APPLICATION, 2018–2025 (USD MILLION)
TABLE 74 NORWAY: SMALL-SCALE LNG MARKET SIZE, BY APPLICATION, 2018–2025 (MTPA)
TABLE 75 TURKEY: SMALL-SCALE LNG MARKET SIZE, BY APPLICATION, 2018–2025 (USD MILLION)
TABLE 76 TURKEY: SMALL-SCALE LNG MARKET SIZE, BY APPLICATION, 2018–2025 (MTPA)
TABLE 77 REST OF EUROPE: SMALL-SCALE LNG MARKET SIZE, BY APPLICATION, 2018–2025 (USD MILLION)
TABLE 78 REST OF EUROPE: SMALL-SCALE LNG MARKET SIZE, BY APPLICATION, 2018–2025 (MTPA)
TABLE 79 MIDDLE EAST & AFRICA: SMALL-SCALE LNG MARKET SIZE, BY COUNTRY, 2018–2025 (USD MILLION)
TABLE 80 MIDDLE EAST & AFRICA: SMALL-SCALE LNG MARKET SIZE, BY COUNTRY, 2018–2025 (MTPA)
TABLE 81 MIDDLE EAST & AFRICA: SMALL-SCALE LNG MARKET SIZE, BY TYPE, 2018–2025 (USD MILLION)
TABLE 82 MIDDLE EAST & AFRICA: SMALL-SCALE LNG MARKET SIZE, BY TYPE, 2018–2025 (MTPA)
TABLE 83 MIDDLE EAST & AFRICA: SMALL-SCALE LNG MARKET SIZE, BY APPLICATION, 2018–2025 (USD MILLION)
TABLE 84 MIDDLE EAST & AFRICA: SMALL-SCALE LNG MARKET SIZE, BY APPLICATION, 2018–2025 (MTPA)
TABLE 85 UAE: SMALL-SCALE LNG MARKET SIZE, BY APPLICATION, 2018–2025 (USD MILLION)
TABLE 86 UAE: SMALL-SCALE LNG MARKET SIZE, BY APPLICATION, 2018–2025 (MTPA)
TABLE 87 ISRAEL: SMALL-SCALE LNG MARKET SIZE, BY APPLICATION, 2018–2025 (USD MILLION)
TABLE 88 ISRAEL: SMALL-SCALE LNG MARKET SIZE, BY APPLICATION, 2018–2025 (MTPA)
TABLE 89 QATAR: SMALL-SCALE LNG MARKET SIZE, BY APPLICATION, 2018–2025 (USD MILLION)
TABLE 90 QATAR: SMALL-SCALE LNG MARKET SIZE, BY APPLICATION, 2018–2025 (MTPA)
TABLE 91 KUWAIT: SMALL-SCALE LNG MARKET SIZE, BY APPLICATION, 2018–2025 (USD MILLION)
TABLE 92 KUWAIT: SMALL-SCALE LNG MARKET SIZE, BY APPLICATION, 2018–2025 (MTPA)
TABLE 93 EGYPT: SMALL-SCALE LNG MARKET SIZE, BY APPLICATION, 2018–2025 (USD MILLION)
TABLE 94 EGYPT: SMALL-SCALE LNG MARKET SIZE, BY APPLICATION, 2018–2025 (MTPA)
TABLE 95 REST OF MIDDLE EAST & AFRICA: SMALL-SCALE LNG MARKET SIZE, BY APPLICATION, 2018–2025 (USD MILLION)
TABLE 96 REST OF MIDDLE EAST & AFRICA: SMALL-SCALE LNG MARKET SIZE, BY APPLICATION, 2018–2025 (MTPA)
TABLE 97 SOUTH AMERICA: SMALL-SCALE LNG MARKET SIZE, BY COUNTRY, 2018–2025 (USD MILLION)
TABLE 98 SOUTH AMERICA: SMALL-SCALE LNG MARKET SIZE, BY COUNTRY, 2018–2025 (MTPA)
TABLE 99 SOUTH AMERICA: SMALL-SCALE LNG MARKET SIZE, BY TYPE, 2018–2025 (USD MILLION)
TABLE 100 SOUTH AMERICA: SMALL-SCALE LNG MARKET SIZE, BY TYPE, 2018–2025 (MTPA)
TABLE 101 SOUTH AMERICA: SMALL-SCALE LNG MARKET SIZE, BY APPLICATION, 2018–2025 (USD MILLION)
TABLE 102 SOUTH AMERICA: SMALL-SCALE LNG MARKET SIZE, BY APPLICATION, 2018–2025 (MTPA)
TABLE 103 BRAZIL: SMALL-SCALE LNG MARKET SIZE, BY APPLICATION, 2018–2025 (USD MILLION)
TABLE 104 BRAZIL: SMALL-SCALE LNG MARKET SIZE, BY APPLICATION, 2018–2025 (MTPA)
TABLE 105 ARGENTINA: SMALL-SCALE LNG MARKET SIZE, BY APPLICATION, 2018–2025 (USD MILLION)
TABLE 106 ARGENTINA: SMALL-SCALE LNG MARKET SIZE, BY APPLICATION, 2018–2025 (MTPA)
TABLE 107 CHILE: SMALL-SCALE LNG MARKET SIZE, BY APPLICATION, 2018–2025 (USD MILLION)
TABLE 108 CHILE: SMALL-SCALE LNG MARKET SIZE, BY APPLICATION, 2018–2025 (MTPA)
TABLE 109 COLOMBIA: SMALL-SCALE LNG MARKET SIZE, BY APPLICATION, 2018–2025 (USD MILLION)
TABLE 110 COLOMBIA: SMALL-SCALE LNG MARKET SIZE, BY APPLICATION, 2018–2025 (MTPA)
TABLE 111 REST OF SOUTH AMERICA: SMALL-SCALE LNG MARKET SIZE, BY APPLICATION, 2018–2025 (USD MILLION)
TABLE 112 REST OF SOUTH AMERICA: SMALL-SCALE LNG MARKET SIZE, BY APPLICATION, 2018–2025 (MTPA)
TABLE 113 EXPANSION
TABLE 114 MERGER & ACQUISITION
TABLE 115 AGREEMENTS & JOINT VENTURES, 2015–2020
LIST OF FIGURES (40 FIGURES)
FIGURE 1 SMALL-SCALE LNG MARKET: DATA TRIANGULATION
FIGURE 2 LIQUEFACTION TYPE TO DOMINATE SMALL-SCALE LNG MARKET
FIGURE 3 HEAVY-DUTY VEHICLES APPLICATION TO DOMINATE SMALL-SCALE LNG MARKET
FIGURE 4 APAC DOMINATED SMALL-SCALE LNG MARKET IN 2019
FIGURE 5 GROWING USAGE OF SMALL-SCALE LNG TO DRIVE THE MARKET
FIGURE 6 APAC REMAINS LARGEST MARKET
FIGURE 7 CHINA ACCOUNTED FOR LARGEST MARKET SHARE IN APAC
FIGURE 8 CHINA TO BE FASTEST-GROWING MARKET BETWEEN 2020 AND 2025
FIGURE 9 DRIVERS, RESTRAINTS, OPPORTUNITIES, AND CHALLENGES IN SMALL-SCALE LNG MARKET
FIGURE 10 SMALL-SCALE LNG MARKET: VALUE CHAIN ANALYSIS
FIGURE 11 SMALL-SCALE LNG MARKET: PORTER’S FIVE FORCES ANALYSIS
FIGURE 12 LNG EXPORTS AND MARKET SHARE BY COUNTRY, 2018 (MTPA)
FIGURE 13 LNG IMPORTS AND MARKET SHARE BY COUNTRY, 2018 (MTPA)
FIGURE 14 LIQUEFACTION TO DOMINATE THE SMALL-SCALE LNG MARKET BETWEEN 2020 AND 2025
FIGURE 15 APAC TO BE THE FASTEST-GROWING MARKET FOR LIQUEFACTION
FIGURE 16 APAC CONTINUES DOMINATING MARKET FOR REGASIFICATION
FIGURE 17 HEAVY-DUTY VEHICLES TO BE THE LARGEST APPLICATION OF SMALL-SCALE LNG
FIGURE 18 APAC TO BE THE LARGEST MARKET IN HEAVY-DUTY VEHICLES APPLICATION
FIGURE 19 EUROPE TO BE THE LARGEST MARKET IN MARINE TRANSPORT APPLICATION
FIGURE 20 APAC TO BE THE LARGEST MARKET IN INDUSTRIAL & POWER APPLICATION
FIGURE 21 APAC TO BE THE LARGEST MARKET IN OTHER APPLICATIONS
FIGURE 22 APAC TO BE THE FASTEST-GROWING SMALL-SCALE LNG MARKET
FIGURE 23 NORTH AMERICA: SMALL-SCALE LNG MARKET SNAPSHOT
FIGURE 24 APAC: SMALL-SCALE LNG MARKET SNAPSHOT
FIGURE 25 EUROPE: SMALL-SCALE LNG MARKET SNAPSHOT
FIGURE 26 MIDDLE EAST & AFRICA: SMALL-SCALE LNG MARKET SNAPSHOT
FIGURE 27 SOUTH AMERICA: SMALL-SCALE LNG MARKET SNAPSHOT
FIGURE 28 COMPANIES PRIMARILY ADOPTED EXPANSION AS THE KEY GROWTH STRATEGY BETWEEN 2015 AND 2020
FIGURE 29 RANKING OF SMALL-SCALE LNG MANUFACTURERS IN 2019
FIGURE 30 THE LINDE GROUP: COMPANY SNAPSHOT
FIGURE 31 THE LINDE GROUP: SWOT ANALYSIS
FIGURE 32 WARTSILA CORPORATION: COMPANY SNAPSHOT
FIGURE 33 WARTSILA CORPORATION: SWOT ANALYSIS
FIGURE 34 HONEYWELL INTERNATIONAL INC.: COMPANY SNAPSHOT
FIGURE 35 HONEYWELL INTERNATIONAL INC.: SWOT ANALYSIS
FIGURE 36 GENERAL ELECTRIC: COMPANY SNAPSHOT
FIGURE 37 GENERAL ELECTRIC: SWOT ANALYSIS
FIGURE 38 ENGIE: COMPANY SNAPSHOT
FIGURE 39 ENGIE: SWOT ANALYSIS
FIGURE 40 GAZPROM: COMPANY SNAPSHOT
The study involved four major activities in estimating the size of the small-scale LNG market. Exhaustive secondary research was done to collect information on the market, peer market, and parent market. The next step was to validate these findings, assumptions, and sizing with industry experts across the value chain through primary research. Both top-down and bottom-up approaches were employed to estimate the total market size. After that, market breakdown and data triangulation were used to estimate the market size of segments and subsegments.
Secondary Research
In the secondary research process, various sources such as Hoovers, Bloomberg Businessweek, Factiva, World Bank, and Industry Journals were used. These secondary sources included annual reports, press releases & investor presentations of companies; white papers; certified publications; articles by recognized authors; and databases.
Primary Research
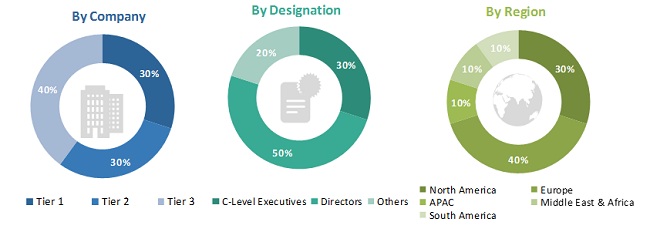
The small-scale LNG market comprises several stakeholders, such as raw material suppliers, end-product manufacturers, and regulatory organizations in the supply chain. Developments in the small-scale LNG market characterize the demand side. The supply side is characterized by market consolidation activities undertaken by manufacturers. Various primary sources from both the supply and demand sides of the market were interviewed to obtain qualitative and quantitative information. Following is the breakdown of primary respondents:
To know about the assumptions considered for the study, download the pdf brochure
Market Size Estimation
Both top-down and bottom-up approaches were used to estimate and validate the total size of the small-scale LNG market. These methods were also used extensively to determine the size of various subsegments in the market. The research methodology used to estimate the market size includes the following:
- The key players in the industry and markets were identified through extensive secondary research.
- The industry’s supply chain and market size, in terms of value, were determined through primary and secondary research processes.
- All percentage shares, splits, and breakdowns were determined using secondary sources and verified through primary sources.
Data Triangulation
After arriving at the overall market size—using the market size estimation processes as explained above—the market was split into several segments and subsegments. To complete the overall market engineering process and arrive at the exact statistics of each market segment and subsegment, the data triangulation and market breakdown procedures were employed, wherever applicable. The data was triangulated by studying various factors and trends from both the demand and supply sides in the small-scale LNG market.
Report Objectives
- To define, describe, and forecast the small-scale LNG market size in terms of value and volume.
- To provide information about the major factors (drivers, restraints, opportunities, and challenges) influencing the market growth
- To analyze and forecast the small-scale LNG market size based on application, type, and region
- To project the market size of the key regions, namely, North America, Asia Pacific (APAC), Europe, Middle East & Africa, and South America
- To strategically analyze the market for individual growth trends, prospects, and their contribution to the overall market
Available Customizations:
With the given market data, MarketsandMarkets offers customizations according to the specific needs of the companies.
The following customization options are available for the report:
Product Analysis
- Product matrix, which gives a detailed comparison of the product portfolio of each company
Regional Analysis
- Further breakdown of Rest of Europe small-scale LNG market into Norway and Denmark
Company Information
- Detailed analysis and profiling of additional market players (up to five)


Growth opportunities and latent adjacency in Small-Scale LNG Market