Virtual Power Plant Market by Enabling Technology (Demand Response, Distributed Generation, and Mixed Asset), End-Use Customer (Commercial & Industrial, and Residential), and Region - Global Trends & Forecasts to 2021


[150 Pages Report] The global virtual power plant market is expected to grow from USD 193.4 million in 2016 to USD 709.2 million by 2021, at a CAGR of 29.68% from 2016 to 2021. Virtual power plants are employed to optimize power generation from existing sources, integrate various renewable energy sources, and, ultimately, reduce the carbon footprint on the environment. Any growth in the smart grid would directly impact the market of virtual power plant. Moreover, factors such as an increasing share of renewable energy in the power generation mix and decreasing costs of solar generation and energy storage would also boost the market for virtual power plant. The base year considered for the study is 2015, and the forecast has been provided for the period between 2016 and 2021.
Market Dynamics
Drivers
- Increasing share of renewable energy in the power generation mix
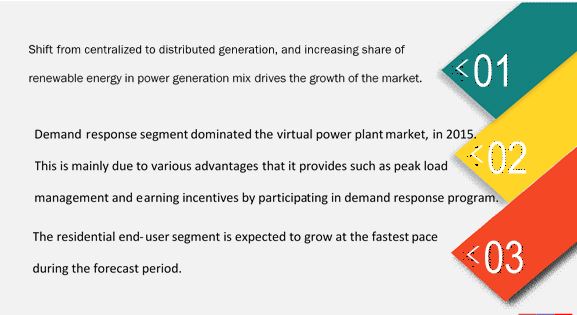
- Shift from centralized to distributed generation
- Decreasing costs of solar generation and energy storage
Restraints
- Health safety concerns regarding electromagnetic frequency (EMF) & radio frequency (RF) exposure
Opportunities
- Rising demand for electric vehicles
- Development of smart grids
Challenges
- Cybersecurity issues associated with the energy sector
Increasing share of renewable energy in the power generation mix drives the global market
Renewable energy is a naturally occurring source of energy that can be easily replenished, and plays an important role in reducing greenhouse gas emissions. Renewable energy is more expensive when compared with fossil fuel-based power generation. Owing to environmental conservation, and rising awareness, countries around the globe are veering towards renewable sources for power generation. As per IEA in 2015, renewables accounted for more than half of the net annual addition to power capacity and overtook coal in terms of cumulative installed capacity in the world. The increasing share of renewables in the power generation mix will positively impact the market.
To know about the assumptions considered for the study, download the pdf brochure
The following are the major objectives of the study.
- To define and segment the virtual power plant market with respect to technology, end-user, and region
- To provide detailed information on major factors influencing the growth of the market (drivers, restraints, opportunities, and industry-specific challenges)
- To strategically analyze the market with respect to individual growth trends, future expansions, and contribution to the market
- To analyze virtual power plant market opportunities for stakeholders, and details of a competitive landscape for market leaders
- To forecast the growth of the market with respect to the major geographical regions (Asia-Pacific, Europe, North America, and Rest of the World)
- To strategically profile key players, and comprehensively analyze their market ranking and core competencies
- To analyze competitive developments such as new product launches, mergers & acquisitions, expansions, and supply contracts in the virtual power plant market
During this research study, major players operating in the virtual power plant market in various regions have been identified, and their offerings, regional presence, and distribution channels have been analyzed through in-depth discussions. Top-down and bottom-up approaches have been used to determine the overall market size. Sizes of the other individual markets have been estimated using the percentage splits obtained through secondary sources such as Hoovers, Bloomberg BusinessWeek, and Factiva, along with primary respondents. The entire procedure includes the study of the annual and financial reports of the top market players and extensive interviews with industry experts such as CEOs, VPs, directors, and marketing executives for key insights (both qualitative and quantitative) pertaining to the market. The figure below shows the breakdown of the primaries on the basis of the company type, designation, and region considered during the research study.
Key players considered in the analysis of the virtual power plant market are ABB Ltd (Switzerland), Siemens AG (Germany), Schneider Electric SE (France), EnerNOC, Inc. (U.S.), Comverge (U.S.), Limejump (U.K.) and Flexitricity (U.K.) .
Major Market Developments
- In October 2016, ABB, Ltd. (Switzerland) launched a micro grid solution in order to address the demand for flexible technology for distributed generation. This would help maximize the use of renewable energy sources while reducing dependency on fossil fuels used by generator sets.
- In May 2016, Cpower (U.S.) acquired Johnson Controls' (France) Integrated Demand Resources (iDR) business. The purchase is a part of CPowers ongoing efforts to expand its demand response portfolio nationwide. For Johnson Controls, the transaction is a part of a continuing strategy to invest in its building management technologies designed to deliver energy and operational efficiency to its customers.
- In August 2016, Enbala Power Networks (Canada) and Encycle, Corp. (Canada) announced a partnership to integrate the Symphony by Enbalas distributed energy resource management platform with Encycles Swarm Energy Management solution for demand response and demand management. This partnership would help the Commercial and Industrial (C&I) customers in lowering their energy usage and costs, enabling utilities to easily achieve their grid balancing and energy efficiency goals.
Target Audience:
- Electric Utilities
- Smart Grid Hardware, Software & Technology Vendors and Service Providers
- Distributed Energy Generation Solution Providers
- Demand Response Aggregators
- Microgrid Developers
- Smart Electric Meter Vendors
- Transmission System Operators
- Distribution Grid Operators
- Energy Storage Device/Equipment Manufacturers and Integrators
- Energy Regulatory Agencies
- Investors and Financial Community Professionals
- Government Agencies
Report Scope:
By Technology:
- Demand Response
- Distributed Generation
- Mixed Asset
By End-User Application:
- Industrial and Commercial
- Residential
By Region:
- North America
- Europe
- Asia-Pacific
- Rest of the world
By Related Markets:
- Demand Response Management System Market
- Battery Energy Storage System Market
- Smart Electric Meter market
- Smart Grid Market
- Microgrid Market
Critical questions which the report answers
- What are new application areas which the virtual power plant companies are exploring?
- Which are the key players in the market and how intense is the competition?
Available Customizations:
Based on the given market data, MarketsandMarkets offers customizations in the reports as per the clients specific requirements. The available customization options are as follows:Company Information
Detailed analysis and profiling of additional market players (Up to 5)
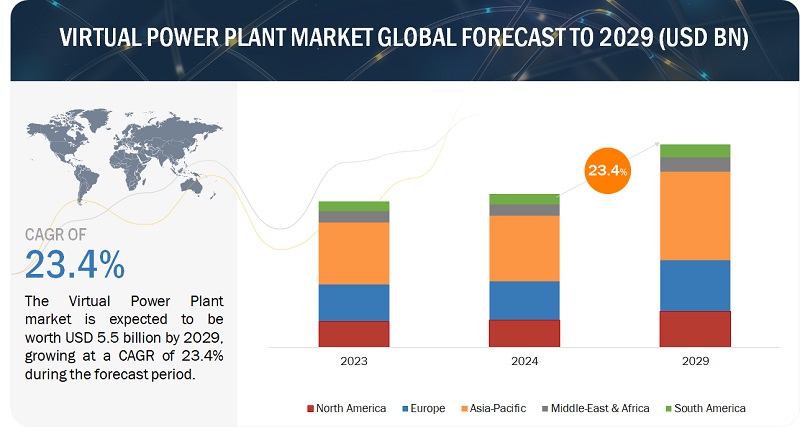
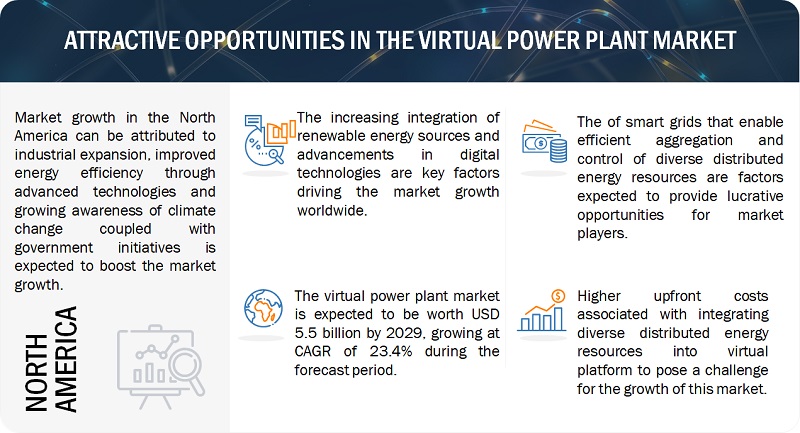
The global virtual power plant market is projected to grow at a CAGR of 29.68% from 2016 to 2021, to reach a market size of USD 709.2 million by 2021. This growth is attributed to the increasing penetration of smart grid technologies as well as increase in residential energy storage system has given rise to the market. An aggregated fleet of distributed energy resources would provide high value to the grid distribution system. Thus, leading to energy efficiency and power savings.
Virtual Power Plant is a combination of various distributed electricity generation entities which are controlled and operated by a central unit using integrated software systems. This technology has the capability to stretch supplies from existing power generation sources (both renewable and nonrenewable energy sources) as well as through utility demand reduction programs. Virtual power plant solutions can be associated with various concepts such as smart grid, microgrid, distributed generation, demand response, and advanced energy storage, among others.
The report segments the virtual power plant market on the basis of technology such as demand response, distributed generation and mixed asset. The demand response segment is projected to dominate the market. This is mainly due to various advantages that it provides such as peak load management and earning incentives by participating in demand response program.
The report segments virtual power plant market based on end-user segment such as commercial & industrial and residential. The residential segment is expected to grow at the fastest pace during the forecast period. The global market is growing in residential homes through participating in demand response programs, energy storage system and distributed generation. It helps in delivering energy at peak usage times and the end users can save up the surplus power in energy storage devices such as solar panels, batteries, among others. Also, government mandates and initiatives for customer engagement, and incentives programs might prove to be an added boost for the residential end-user segment. The growing infrastructure sector, especially in Asia-Pacific region is likely to drive the overall market during the forecast period.
In this report, the virtual power plant market has been analyzed with respect to four regions, namely, North America, Europe, Asia-Pacific, and Rest of the world which includes Latin America and the Middle East and Africa. North America is expected to dominate the global market during the forecast period, owing to the extensive use of these solutions in commercial & industrial as well as residential sector. The Asia-Pacific market is projected to grow at the highest CAGR from 2016 to 2021. The region is the largest market for the infrastructure sector and industrial sector and is taking various steps to reduce carbon footprint and produce clean energy which includes renewable energy such as hydro energy, wind energy and solar energy generation.
Shift from centralized to distributed power generation drive the growth of market
Distributed generation refers to geographically dispersed power generation sources, which are usually less than 10 MW. It comprises both controllable sources, such as generators, and non-controllable sources, such as solar and wind. The demand for energy from distributed energy resources is growing globally due to a number of reasons, such as planned rolling blackouts, power quality problems, unexpected utility power outages, and increases in power costs, among others. So instead of relying totally on utilities for power needs, all end-users, from residential and commercial to industrial customers, have started generating their own power based on these sources. Also, utilities have started shifting their business models from directly selling electricity to involving end-users as a part of their business in order to cater to peak demand without large scale capacity additions. Hence the growth of distributed generation would necessitate growth of the market.
Virtual Power Plant has been segmented demand response, distribution generation, and mixed asset based on technology.
Demand Respons
Demand response can be defined as managing of electricity usage based on a change in the price of power. It enables customers to contribute to energy load reduction during times of peak demand by cutting consumption during peak hours with the help of virtual power plant solutions and software.
Distributed Generation
Distribution generation is a decentralized energy which is generated or stored by a variety of small, grid connected generators referred to as Distributed Energy Resources (DERs) or distributed energy resource systems. With the increasing intensification of energy crisis and environmental pollution problems, the development of new renewable energy has become more and more serious. In order to realize the better integration of these, distributed power generation resources with the help of virtual power plants can be effectively optimized.
Mixed Assets
Mixed Asset consist of multiple technologies such as solar power, battery storage, and energy efficiency systems that are efficient in reducing energy consumption as well as suppling clean power in targeted ways.
Critical questions the report answers:
- Where will all these developments take the industry in the mid to long term?
- What are the upcoming industry applications for virtual power plants?
To speak to our analyst for a discussion on the above findings, click Speak to Analyst
Health safety concern related to radio frequency exposure could be a restraint of the market which might lead to decline in profit. Additionally, RF emissions from smart meters are within the U.S. Federal Communications Commission (FCC) limits. However, some campaign groups (such as Stop Smart Meters U.K.) in both the U.K. and the U.S. believe smart meters to be unnecessary health and security risks. Hence, these uncertainties with respect to smart meters would hinder the market growth.
Key players in the virtual power plant market include ABB Ltd (Switzerland), Siemens AG (Germany), Schneider Electric SE (France), EnerNOC, Inc. (U.S.), Comverge (U.S.), Limejump (U.K.) and Flexitricity (U.K.). Contracts and agreements was the strategy most commonly adopted by the top players, constituting 58% of the total developments from 2013 to 2016. It was followed by new product developments, expansions and investments, and mergers & acquisitions.
Table of Contents
1 Introduction (Page No. - 12)
1.1 Objectives of the Study
1.2 Market Definition
1.3 Market Scope
1.3.1 Markets Covered
1.3.2 Countries Covered
1.3.3 Years Considered for the Study
1.4 Currency & Pricing
1.5 Limitations
1.6 Stakeholders
2 Research Methodology (Page No. - 17)
2.1 Introduction
2.1.1 Secondary Data
2.1.1.1 Key Data From Secondary Sources
2.1.2 Primary Data
2.1.2.1 Key Data From Primary Sources
2.1.2.2 Key Industry Insights
2.1.2.3 Breakdown of Primaries
2.2 Market Size Estimation
2.3 Market Breakdown & Data Triangulation
2.4 Research Assumptions
3 Executive Summary (Page No. - 24)
3.1 Historical Backdrop
3.2 Current Scenario
3.3 Future Outlook
3.4 Conclusion
4 Premium Insights (Page No. - 29)
4.1 Virtual Power Plant Market, By Technology
4.2 Market, By End-User
4.3 North America: the Largest Market During the Forecast Period
5 Market Overview (Page No. - 32)
5.1 Introduction
5.2 Market Segmentation
5.2.1 By Technology
5.2.2 By End-User
5.2.3 By Region
5.3 Market Dynamics
5.3.1 Drivers
5.3.1.1 Increasing Share of Renewable Energy in the Power Generation Mix
5.3.1.2 Shift From Centralized to Distributed Generation
5.3.1.3 Decreasing Costs of Solar Generation and Energy Storage
5.3.2 Restraints
5.3.2.1 Health Safety Concerns Regarding Electromagnetic Frequency & Radio Frequency Exposure
5.3.3 Opportunities
5.3.3.1 Rising Demand for Electric Vehicles
5.3.3.2 Development of Smart Grids
5.3.4 Challenges
5.3.4.1 Cybersecurity Issues Associated With the Energy Sector
6 Industry Trends (Page No. - 42)
6.1 Introduction
6.2 Smart Grid Market
6.3 Microgrid Market
6.4 Demand Response Management System Market
6.5 Battery Energy Storage System Market
6.6 Smart Electric Meter Market
7 Virtual Power Plant, By Technology (Page No. - 64)
7.1 Introduction
7.2 Demand Response
7.3 Distribution Generation
7.4 Mixed Asset
8 Virtual Power Plant, By End-User (Page No. - 68)
8.1 Introduction
8.2 Commercial & Industrial
8.2.1 Commercial
8.2.2 Industrial
8.3 Residential
9 Virtual Power Plant Market, By Region (Page No. - 71)
9.1 Introduction
9.2 Asia-Pacific
9.2.1 By Technology
9.2.2 By Country
9.2.2.1 Australia
9.2.2.2 South Korea
9.2.2.3 Japan
9.2.2.4 The Rest of Asia-Pacific
9.3 North America
9.3.1 By Technology
9.3.2 By Country
9.3.2.1 The U.S.
9.3.2.2 Canada
9.4 Europe
9.4.1 By Technology
9.4.2 By Country
9.4.2.1 Germany
9.4.2.2 Denmark
9.4.2.3 The U.K.
9.4.2.4 France
9.4.2.5 The Rest of Europe
10 Competitive Landscape (Page No. - 90)
10.1 Overview
10.2 Virtual Power Plant: Market Ranking, 2015
10.3 Competitive Situations & Trends
10.4 Market: MnM Dive Vendor Comparission
11 Company Profiles (Page No. - 96)
(Overview, Products and Services, Financials, Strategy & Development)*
11.1 Introduction
11.2 ABB, Ltd.
11.3 Autogrid Systems, Inc.
11.4 Blue Pillar
11.5 Cisco Systems, Inc.
11.6 Comverge
11.7 Cpower Energy Management
11.8 Enbala Power Networks, Inc.
11.9 Enernoc, Inc
11.10 Flexitricity Limited
11.11 General Electric
11.12 Hitachi, Ltd.
11.13 IBM
11.14 Limejump Limited
11.15 Next Kraftwerke
11.16 Olivene, Inc.
11.17 Open Access Technology International, Inc.
11.18 Osisoft
11.19 Power Analytics Corporation
11.20 Robert Bosch GmbH
11.21 Schneider Electric
11.22 Siemens AG
11.23 Spirae, Inc.
11.24 Sunverge
11.25 Toshiba Corporation
11.26 Upside Energy, Ltd.
*Details on Overview, Products and Services, Financials, Strategy & Development Might Not Be Captured in Case of Unlisted Companies
12 Appendix (Page No. - 136)
12.1 Insights of Industry Experts
12.2 Discussion Guide
12.3 Knowledge Store: Marketsandmarkets Subscription Portal
12.4 Introducing RT: Real-Time Market Intelligence
12.5 Available Customizations
12.6 Related Reports
12.7 Author Details
List of Tables (66 Tables)
Table 1 Global Weighted Average Solar & Wind Power Investment Costs, 2015 & 2025
Table 2 Smart Grid Market Size, By Solution, 20142021 (USD Million)
Table 3 Smart Grid Market Size, By Service, 20142021 (USD Million)
Table 4 Smart Grid Market Size, By Region, 20142021 (USD Million)
Table 5 North America: Smart Grid Market Size, By Type, 20142021 (USD Million)
Table 6 Europe: Smart Grid Market Size, By Type, 20142021 (USD Million)
Table 7 Asia-Pacific: Smart Grid Market Size, By Type, 20142021 (USD Million)
Table 8 Latin America: Smart Grid Market Size, By Type, 20142021 (USD Million)
Table 9 Middle East & Africa: Smart Grid Market Size, By Type, 20142021 (USD Million)
Table 10 Microgrid Market Size, By Offering, 20142021 (USD Billion)
Table 11 Microgrid Market Size, By Connectivity, 20142021 (USD Billion)
Table 12 Microgrid Market Size, By Vertical, 20142021 (USD Billion)
Table 13 Microgrid Market Size, By Region, 20142021 (USD Billion)
Table 14 Americas: Microgrid Market Size, By Region, 20142021 (USD Billion)
Table 15 North America: Microgrid Market Size, By Country, 20142021 (USD Billion)
Table 16 Latin America: Microgrid Market Size, By Country, 20142021 (USD Billion)
Table 17 Europe: Microgrid Market Size, By Country, 20142021 (USD Billion)
Table 18 Asia-Pacific: Microgrid Market Size, By Country, 20142021 (USD Billion)
Table 19 Rest of the World: Microgrid Market Size, By Region, 20142021 (USD Billion)
Table 20 Demand Response Management System Market Size, By Solution, 20142021 (USD Million)
Table 21 Demand Response Management System Market Size, By Service, 20142021 (USD Million)
Table 22 Demand Response Management System Market Size, By Vertical, 20142021 (USD Million)
Table 23 Demand Response Management System Market Size, By Region, 20142021 (USD Million)
Table 24 North America: Demand Response Management System Market Size, By Country, 20142021 (USD Million)
Table 25 Europe: Demand Response Management System Market Size, By Country, 20142021 (USD Million)
Table 26 Asia-Pacific: Demand Response Management System Market Size, By Country, 20142021 (USD Million)
Table 27 Latin America: Demand Response Management System Market Size, By Country, 20142021 (USD Million)
Table 28 Battery Energy Storage System Market Size, By Battery Type, 20142021 (USD Million)
Table 29 Battery Energy Storage System Market Size, By Connection Type, 20142021 (USD Million)
Table 30 Battery Energy Storage System Market Size, By Ownership, 20142021 (USD Million)
Table 31 Battery Energy Storage System Market Size, By Application, 20142021 (USD Million)
Table 32 Battery Energy Storage System Market Size, By Region, 20142021 (USD Million)
Table 33 Smart Electric Meter Market Size, By Phase, 20142021 (USD Million)
Table 34 Smart Electric Meter Market Size, By End-User, 20142021 (USD Million)
Table 35 Smart Electric Meter Market Size, By Communication Technology, 20142021 (USD Million)
Table 36 Smart Electric Meter Market Size, By Region, 20142021 (USD Million)
Table 37 North America: Smart Electric Meter Market Size, By Country, 20142021 (USD Million)
Table 38 Europe: Smart Electric Meter Market Size, By Country, 20142021 (USD Million)
Table 39 Asia-Pacific: Smart Electric Meter Market Size, By Country, 20142021 (USD Million)
Table 40 Middle East: Smart Electric Meter Market Size, By Country, 20142021 (USD Million)
Table 41 South America: Smart Electric Meter Market Size, By Country, 20142021 (USD Million)
Table 42 Africa: Smart Electric Meter Market Size, By Country, 20142021 (USD Million)
Table 43 Market, By Technology, 20142021 (USD Million)
Table 44 Demand Response: Market Size, By Region, 20142021 (USD Million)
Table 45 Distribution Generation: Market Size, By Region, 20142021 (USD Million)
Table 46 Mixed Asset: Market Size, By Region, 20142021 (USD Million)
Table 47 Global Market Size, By End-User, 20142021 (USD Million)
Table 48 Global Market Size, By Region, 20142021 (USD Million)
Table 49 Asia-Pacific: Market Size, By Technology, 20142021 (USD Million)
Table 50 Asia-Pacific: Market Size, By Country, 20142021 (USD Million)
Table 51 Australia: Market Size, By Technology, 20142021 (USD Million)
Table 52 South Korea: Market Size, By Technology, 20142021 (USD Million)
Table 53 Japan: Market Size, By Technology, 20142021 (USD Million)
Table 54 Rest of Asia-Pacific:Market Size, By Technology, 20142021 (USD Million)
Table 55 North America: Market Size, By Technology, 20142021 (USD Million)
Table 56 North America: Market Size, By Country, 20142021 (USD Million)
Table 57 U.S.: Market Size, By Technology, 20142021 (USD Million)
Table 58 Canada: Market Size, By Technology, 20142021 (USD Million)
Table 59 Europe: Market Size, By Technology, 20142021 (USD Million)
Table 60 Europe: Market Size, By Country, 20142021 (USD Million)
Table 61 Germany: Market Size, By Technology, 20142021 (USD Million)
Table 62 Denmark: Market Size, By Technology, 20142021 (USD Million)
Table 63 U.K.: Market Size, By Technology, 20142021 (USD Million)
Table 64 France: Market Size, By Technology, 20142021 (USD Million)
Table 65 Rest of Europe: Market Size, By Technology, 20142021 (USD Million)
Table 66 Key Contributors Market
List of Figures (32 Figures)
Figure 1 Virtual Power Plants Market: Research Design
Figure 2 Breakdown of Primary Interviews: By Company Type, Designation, & Region
Figure 3 Market Size Estimation Methodology: Bottom-Up Approach
Figure 4 Market Size Estimation Methodology: Top-Down Approach
Figure 5 Data Triangulation Methodology
Figure 6 Asia-Pacific Occupied the Largest Market Share in 2015
Figure 7 Global Market Share, By Technology, 2016 & 2021 (USD Million)
Figure 8 Commercial & Industrial By End-User Segment are Expected to Account for the Maximum Share During the Forecast Period
Figure 9 Market Snapshot: North America is Expected to Be the Largest Market During the Forecast Period
Figure 10 Top Market Development (20142015)
Figure 11 Attractive Market Opportunities in the Market
Figure 12 Market Share (Value), By Technology, 20162021
Figure 13 Commercial & Industrial Segment is Estimated to Dominate the Market By 2021
Figure 14 Asia-Pacific is Expected to Grow at the Fastest Pace During the Forecast Period
Figure 15 Market: Market Segmentation
Figure 16 Market, By Technology
Figure 17 Market, By End-User
Figure 18 Market, By Region
Figure 19 Increasing Share of Renewable Energy in the Power Generation Mix is A Major Factor Driving the Market
Figure 20 Electricity Production From Renewable Sources, Excluding Hydroelectric (TWH)
Figure 21 Plug-In Hybrid Electric Cars, Stock By Country, 20112015
Figure 22 Plug-In Hybrid Electric Cars, New Registrations By Country, 20112015
Figure 23 International Bank for Reconstruction and Development (IBRD)/International Development Association (IDA) Smart Grid Commitments, By Type & Year, 20102016 (USD Million)
Figure 24 Technologies Related to Virtual Power Plants
Figure 25 Regional Snapshot: Growth Rate of the Market in Important Countries, From 2016 to 2021
Figure 26 Regional Snapshot: Asia-Pacific Offered Attractive Market Opportunities in 2015
Figure 27 Regional Snapshot: the North American Market Was the Largest in 2015
Figure 28 Companies Adopted Contracts & Agreements and New Product Launches as Key Strategies to Capture the Market, 20132017
Figure 29 Market Evaluation Framework: Contracts & Agreements Fueled the Growth of the Companies, 20132017
Figure 30 Vendor Dive Matrix
Figure 31 Product Strategy Comparison
Figure 32 Business Strategy Comparison


Growth opportunities and latent adjacency in Virtual Power Plant Market